The digital marketing landscape has reached a point of saturation where acquiring new traffic is often more expensive than optimizing existing visitors. In this high-stakes environment, Conversion Rate Optimization (CRO) has evolved from a series of "best practice" tweaks into a rigorous scientific discipline. Industry data suggests that while the average e-commerce conversion rate hovers between 2% and 3%, top-tier companies utilizing systematic optimization frameworks achieve rates significantly higher, often doubling the performance of their competitors. Central to this systematic approach is the SHIP model—Scrutinize, Hypothesize, Implement, Propagate—a continuous loop designed to replace guesswork with data-driven certainty.
The Lifecycle of Optimization: Understanding the SHIP Model
The SHIP model provides a structural backbone for any professional CRO program. Unlike ad-hoc testing, which often results in "flat" tests with no significant statistical winners, the SHIP model ensures that every experiment is grounded in deep research. The process begins with the Scrutinize phase, where practitioners gather both quantitative and qualitative data to identify friction points. This leads to the Hypothesize phase, where teams develop specific, testable predictions. The Implement phase involves the actual deployment of A/B or multivariate tests, and finally, the Propagate phase focuses on scaling winning variations and documenting learnings to inform the next cycle.
Market analysts note that the cyclical nature of this model is its greatest strength. By treating CRO as a continuous loop rather than a one-off project, organizations can benefit from the compound effect of incremental gains. A 5% improvement in conversion rate every month does not merely result in a 60% annual increase; through compounding, the impact on the bottom line can be transformative for a brand’s annual recurring revenue (ARR).
Phase 1: The Scrutinize Process and Data Acquisition
The Scrutinize phase is arguably the most critical component of the SHIP model. Experts argue that most teams fail because they jump to testing without understanding the root cause of user abandonment. This phase acts as a diagnostic audit, blending quantitative metrics—the "what"—with qualitative insights—the "why."
Quantitative data is typically sourced from analytics platforms like Google Analytics 4 (GA4). Practitioners look for high drop-off rates in the conversion funnel, identifying specific pages where users exit the site prematurely. Key metrics include the bounce rate on landing pages, cart abandonment rates, and form completion times. However, quantitative data only identifies the location of the "leak"; it does not explain why the leak is occurring.
To uncover the underlying causes, qualitative research is employed. This includes:
- User Testing: Observing real users as they attempt to complete tasks on the site.
- Heatmaps and Session Recordings: Visualizing where users click, scroll, and hesitate.
- Customer Surveys and Polls: Gathering direct feedback regarding Fear, Uncertainty, and Doubt (FUDs).
- Expert Heuristic Analysis: Using established usability principles to identify obvious friction points.
Categorizing Site Issues: Bugs, Usability, and Conversion
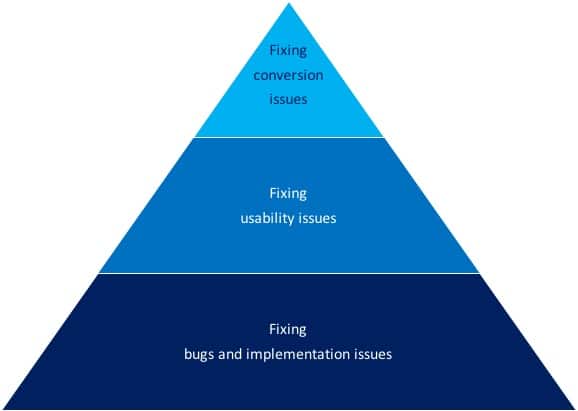
During the Scrutinize phase, issues are generally categorized into three distinct buckets: bugs, usability issues, and conversion blockers. While these terms are often used interchangeably, professional CRO consultants distinguish them to prioritize fixes.

Bugs are technical failures, such as a broken "Add to Cart" button or a checkout page that fails to load on specific mobile browsers. These are not subjects for A/B testing; they are immediate "just do it" fixes. Usability issues involve the ease of use—how intuitive the navigation is or how clearly the information is presented. A website can be highly usable but still fail to convert if it does not persuade the user.
Conversion issues are psychological. They relate to the value proposition, trust, and the "nudge" required to move a visitor to action. For instance, a page may be perfectly functional (no bugs) and easy to navigate (high usability), but if the visitor does not trust the brand’s security or finds the price-to-value ratio unclear, they will not convert. As industry veterans often state, "Every usability issue is a conversion issue, but not every conversion issue is a usability issue."
Developing the Hypothesis: From Initial to Concrete
Once the research opportunities are identified, they must be translated into a testable hypothesis. A hypothesis is not merely a guess; it is a predictive statement that links a specific change to a predicted outcome based on evidence.
The process involves two stages: the Initial Hypothesis and the Concrete Hypothesis. An initial hypothesis might state, "Adding social proof will enhance visitor trust and increase conversions." While this provides a direction, it lacks the specificity required for a rigorous scientific test.

A concrete hypothesis refines this by incorporating data and specific goals: "Based on qualitative data from exit-intent polls, we observed that users are hesitant because they are unfamiliar with the brand. By adding a ‘Trusted by 10,000+ Customers’ badge and three verified testimonials to the homepage, we will increase the click-through rate to the product page by 10%." This level of detail allows for a more accurate assessment of the test’s success and provides a clear benchmark for statistical significance.
The Challenge of Prioritization: Evaluating Industry Frameworks
A common bottleneck in CRO programs is the "Research Opportunities List," which can often grow to hundreds of items. Because companies have limited traffic and development resources, they cannot test everything at once. This necessitates a prioritization framework. Several models have become industry standards, each with its own methodology for scoring ideas.
The PIE Framework (Widerfunnel): Developed by Chris Goward, PIE stands for Potential, Importance, and Ease.
- Potential: How much improvement can be made on this page?
- Importance: How valuable is the traffic to this page? (High-volume, high-cost traffic pages are prioritized).
- Ease: How difficult is it to implement the test technically?
While popular for its simplicity, critics argue that PIE is highly subjective, as "Potential" often relies on the practitioner’s intuition rather than hard data.
The Hotwire Framework: Introduced by Pauline Marol, this model adds layers of strategic alignment. It evaluates how a test contributes to overall business objectives and the specificity of the problem identified. This framework is often favored by large enterprises where cross-departmental goals must be synchronized.

The PXL Framework (CXL): Peep Laja and the team at CXL developed PXL to bring more objectivity to the process. It uses a binary (yes/no) scoring system for various criteria, such as "Is the change above the fold?" or "Is it addressing a known friction point from user testing?" By moving away from a 1-10 subjective scale, PXL attempts to standardize how different team members view the same test idea.
The Invesp Prioritization Model: A Weighted Approach
The Invesp framework represents a more granular evolution of prioritization. It recognizes that not all data sources are equal and that the complexity of a change should be weighted against its potential impact. This model uses a weighted average to score items based on several criteria:
- Source of Data: Tests derived from multiple research methods (e.g., both analytics and user testing) receive higher scores. If an issue is identified through four or five different research methods, it receives a maximum score of 12, whereas an issue found through only one method scores a 3.
- Type of Change: The framework assigns scores based on the nature of the modification. Adding or removing an element is scored at 3, while simply changing the location or emphasizing an existing element is scored at 1.
- Strategic Value: The model assesses whether the test targets a high-value page or a critical stage in the conversion funnel, such as the checkout or lead-capture form.
- Technical Effort: Implementation is scored based on the development hours required. A test that can be set up in a visual editor without developer intervention is prioritized over one requiring back-end coding.
Chronology of a CRO Campaign
To understand how these frameworks function in a real-world setting, one can look at the typical 90-day cycle of a CRO engagement.
- Days 1-30 (The Scrutinize Phase): Extensive data mining, setting up tracking, and conducting qualitative research.
- Days 31-45 (The Prioritization Phase): The research opportunities list is populated, and the chosen framework (e.g., Invesp or PXL) is applied to rank the top 10 test ideas.
- Days 46-90 (The Testing Phase): Implementation of the first two to three high-priority tests. Results are monitored for statistical significance, typically requiring a 95% confidence level.
Broader Implications for the Digital Economy
The shift toward these rigorous frameworks reflects a maturing digital economy. As privacy regulations like GDPR and CCPA limit the efficacy of third-party data for ad targeting, brands are forced to focus on "first-party" optimization—improving the experience they control on their own domains.

Furthermore, the integration of Artificial Intelligence in CRO is beginning to automate parts of the Scrutinize and Hypothesize phases. AI tools can now analyze thousands of session recordings to identify patterns of "rage clicking" or "hovering," feeding these insights directly into prioritization frameworks. However, the human element remains essential in crafting the Concrete Hypothesis and ensuring that tests align with the brand’s long-term identity and ethics.
In conclusion, the SHIP model and its associated prioritization frameworks provide a roadmap for navigating the complexities of modern e-commerce. By treating conversion optimization as a disciplined scientific process rather than a series of creative guesses, businesses can ensure that every dollar spent on testing contributes to a deeper understanding of their customers and a more robust bottom line. While no framework is perfect, the move toward weighted, data-backed scoring systems marks a significant step forward in the professionalization of the digital marketing industry.