The global mobile application market, currently valued at hundreds of billions of dollars, has reached a point of saturation where marginal gains in user retention can determine the long-term viability of a digital product. While the majority of mobile app professionals utilize sophisticated quantitative analytics to monitor performance, industry analysts have identified a systemic flaw in standard optimization workflows. This flaw stems from a disproportionate reliance on numerical data, which, while effective at identifying "what" is occurring within an app, consistently fails to explain the "why" behind user behavior. To address this intelligence gap, a new paradigm in mobile strategy is emerging—one that integrates qualitative analytics into the traditional data stack to provide a holistic view of the user journey.
The Quantitative Limitation and the Rise of Qualitative Intelligence
For the past decade, the industry standard for app optimization has been rooted in quantitative metrics. Product managers and developers have focused on Key Performance Indicators (KPIs) such as Daily Active Users (DAU), churn rates, session length, and conversion funnels. These metrics act as a vital diagnostic tool; for instance, quantitative data can alert a team that 40% of users abandon the registration screen or that the app’s average session length has dropped following a recent update. However, numbers alone remain silent on the specific friction points causing these shifts.
The integration of qualitative analytics—specifically touch heatmaps and user session recordings—fills this informational void. By observing the actual behavior of users, app professionals can move beyond statistical speculation and identify the root causes of user frustration. This shift represents a transition from reactive firefighting to proactive experience management, allowing brands to deliver products that are not just functional, but intuitive.
Technical Components of Qualitative Analytics
To understand how qualitative data transforms a workflow, it is necessary to examine the primary technologies involved: touch heatmaps and user session recordings. These tools provide a visual representation of the user experience that numerical spreadsheets cannot replicate.
Aggregate Behavioral Mapping via Touch Heatmaps
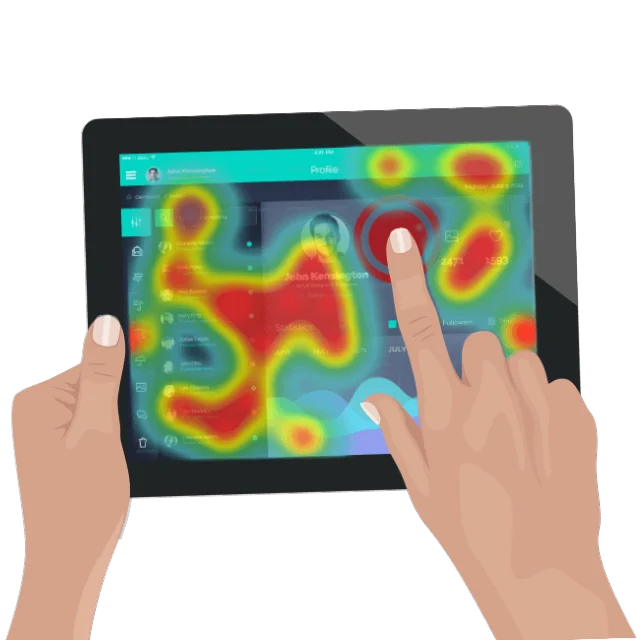
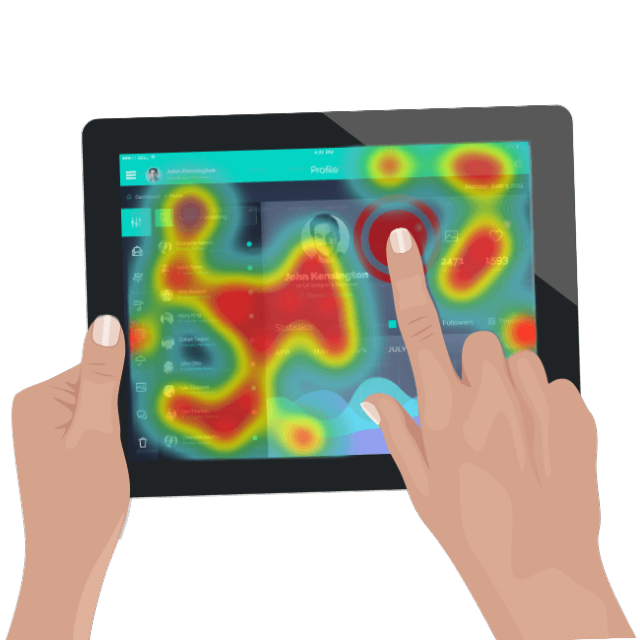
Touch heatmaps function by gathering every gesture performed by a user on a specific screen—including taps, double-taps, long presses, and swipes—and aggregating this data into a visual overlay. This allows developers to see "hot" zones of high interaction and "cold" zones that are being ignored.
A critical metric derived from this technology is the "unresponsive gesture." This occurs when a user interacts with a UI element—such as an icon or a piece of text—expecting a response that never occurs. Industry data suggests that unresponsive gestures are a leading cause of "rage clicking," a behavior where users repeatedly tap a screen in frustration, often followed by an immediate exit from the app. By identifying these zones, designers can determine if a button is too small, if a non-interactive element looks too much like a link, or if a backend bug is preventing a command from executing.
Unbiased Observation through User Session Recordings
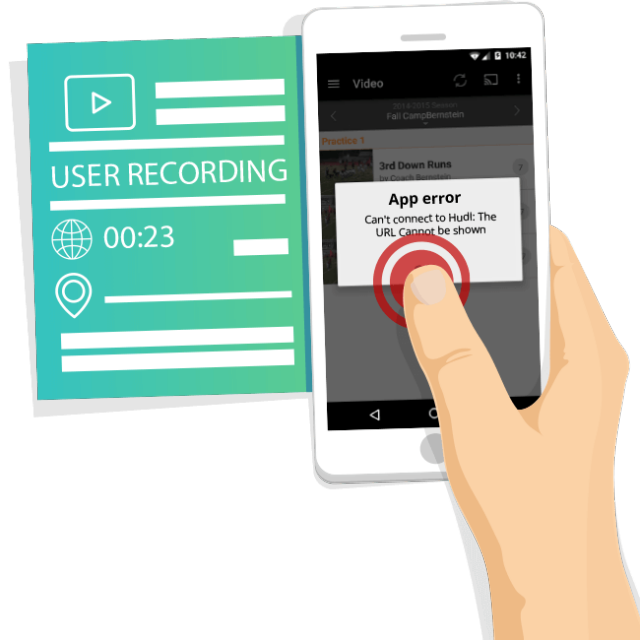
User session recordings provide a literal view of the user’s screen as they navigate the application. Unlike traditional usability testing, which often takes place in a controlled laboratory setting where users may alter their behavior (the Hawthorne Effect), session recordings capture "in the wild" interactions.
These recordings document every sequence of events, allowing teams to witness the exact moment a user becomes confused. For example, if a user spends three minutes on a checkout page before force-closing the app, a session recording might reveal that the "Submit" button was obscured by a keyboard overlay or that a specific form field was throwing an error message that was difficult to read. This level of detail is essential for troubleshooting crashes on specific devices or operating systems where the error logs might be inconclusive.
Strategic Workflows: A New Chronology for Optimization
The implementation of qualitative analytics fundamentally alters the timeline of app development and maintenance. Rather than waiting for a monthly report to show a decline in performance, teams can adopt two primary workflows: Data-Fueled Optimization and Proactive Troubleshooting.
Data-Fueled Optimization
In a traditional workflow, optimization is often a process of trial and error. If a conversion funnel shows a drop-off, a team might A/B test several different button colors or copy changes, hoping one will stick. Qualitative analytics streamlines this by providing a clear investigative path.
- Alert (Quantitative): The system detects a 15% drop in shopping cart completions.
- Investigate (Qualitative): The product team reviews session recordings of users who abandoned the cart. They observe that the "Enter Promo Code" box is confusing users, who leave the app to search for a code and never return.
- Resolve (Action): The team moves the promo code box to a later stage or clarifies the UI.
- Validate: Subsequent quantitative data confirms the conversion rate has stabilized.
This "Alert-Investigate-Resolve" loop reduces the time spent on ineffective A/B tests and ensures that engineering resources are directed toward solving verified user problems.
Proactive Troubleshooting
Proactive troubleshooting allows developers to identify and fix bugs before they impact a significant portion of the user base. Quantitative metrics are inherently lagging; a developer must wait for enough users to experience a crash or a failure before the numbers become statistically significant.
By contrast, monitoring a small sample of daily session recordings can reveal "silent" errors. For instance, a developer might notice that users attempting to authenticate via a third-party API, such as Twitter or Google, are experiencing a momentary freeze followed by a crash. Even if this only affects a specific version of an operating system, seeing it happen in real-time allows for a patch to be deployed before the issue escalates into a wave of negative App Store reviews and increased churn.
Market Context and Industry Implications
The shift toward qualitative-heavy workflows comes at a time when user acquisition costs (CAC) are at an all-time high. With the implementation of stricter privacy regulations, such as Apple’s App Tracking Transparency (ATT), it has become more expensive and difficult to acquire new users. Consequently, the industry has shifted its focus toward retention and Lifetime Value (LTV).
Market analysts note that companies specializing in qualitative analytics, such as Appsee (which was acquired by ServiceNow in 2019), have paved the way for a broader "Experience Management" (XM) movement. This movement treats the user experience as a measurable asset. By understanding the "why" behind the data, companies can make strategic decisions with higher confidence, reducing the financial risk associated with major app redesigns.
Broader Impact on Product Management and Design
The integration of these tools also fosters a more collaborative environment between different departments. Historically, developers and designers have operated in silos, with designers focusing on aesthetics and developers on stability. Qualitative data serves as a "common language." When a heatmap shows that users are consistently missing a primary call-to-action because of a design layout, the data is undeniable, leading to faster consensus and more agile development cycles.
Furthermore, as Artificial Intelligence (AI) and Machine Learning (ML) continue to evolve, the future of qualitative analytics likely involves automated insight generation. Future systems may be able to automatically flag session recordings that contain "frustrated" gestures or high levels of UI friction, further reducing the manual labor required to analyze user behavior.
Conclusion and Future Outlook
The maturation of the mobile app industry has rendered traditional, numbers-only analytics insufficient for maintaining a competitive edge. The "fresh twist" in the industry is not the abandonment of quantitative data, but its marriage to qualitative insights. By combining the "what" of the numbers with the "why" of user behavior, app professionals can move toward a more sophisticated, proactive, and data-fueled method of optimization.
As the digital landscape becomes increasingly complex, the ability to empathize with the user through visual data will become a prerequisite for success. Organizations that continue to rely solely on quantitative metrics risk operating with a significant blind spot, while those that embrace qualitative workflows will be better positioned to troubleshoot issues, optimize conversions, and ultimately build products that resonate more deeply with their audience. The result is a more resilient app ecosystem where technical stability and user-centric design are no longer separate goals, but two sides of the same coin.