 Dwi Wanna
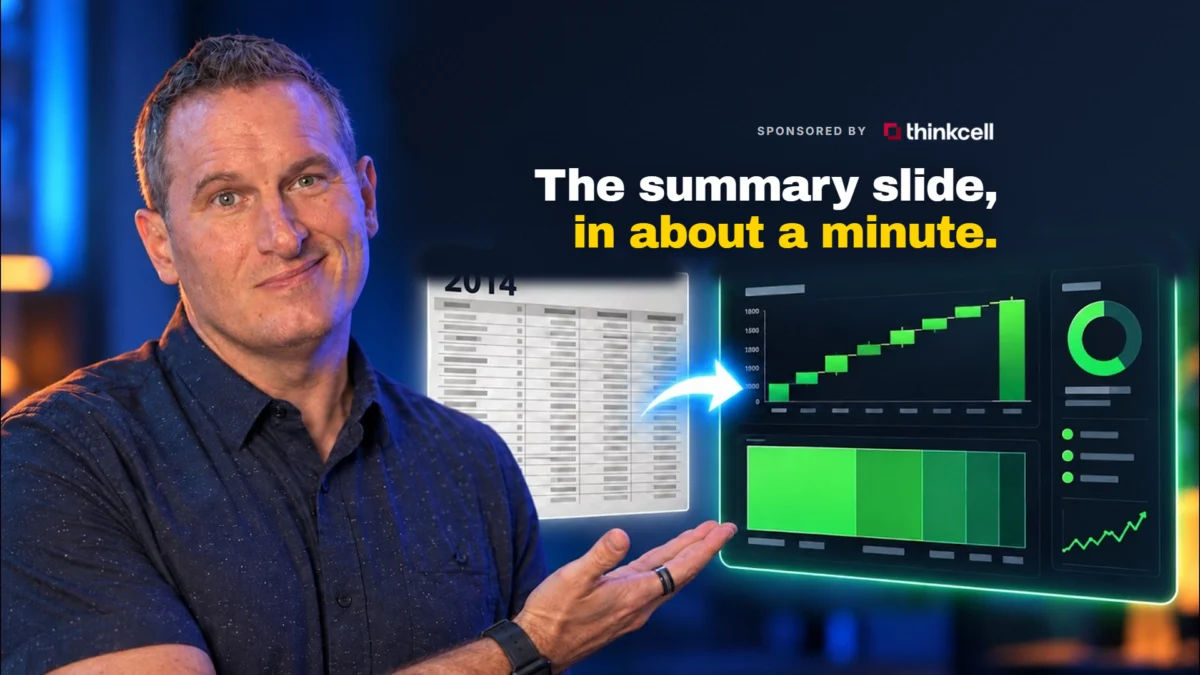
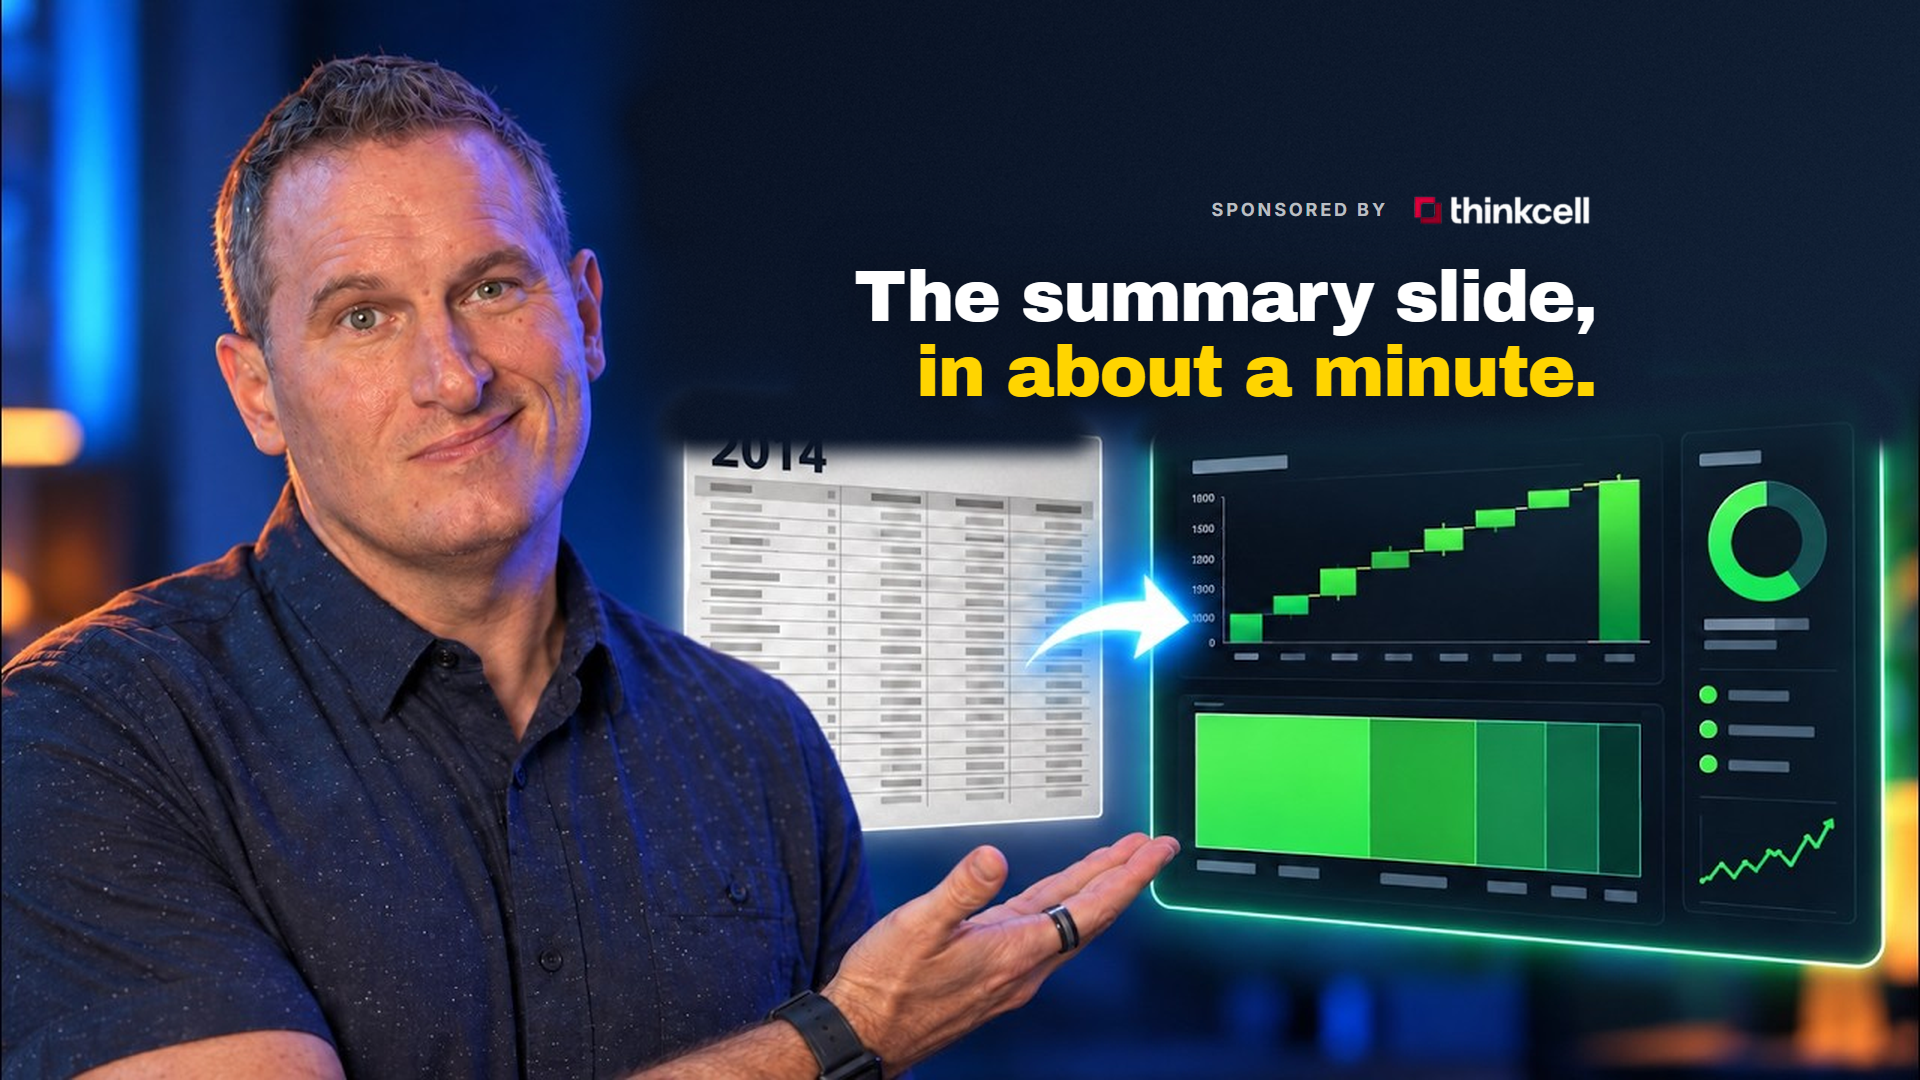
The landscape of digital marketing and corporate communications is currently undergoing a significant transition as artificial intelligence moves from generative text into the realm of structured data visualization and automated reporting. For over a decade, professional service providers and marketing agencies have relied on static templates to convey performance metrics to stakeholders. However, the introduction of thinkcell Assist represents a shift toward dynamic, AI-integrated workflows designed to eliminate the manual friction inherent in monthly reporting cycles. This development addresses a long-standing bottleneck in the professional services industry: the "last mile" of data communication, where insights are often lost in the tedious process of manual entry and slide formatting.
The Context of the Reporting Burden in Digital Marketing
Since the early 2010s, the digital marketing industry has struggled with the paradox of data abundance. While tools like Google Analytics, Meta Ads, and various CRM platforms provide a wealth of information, the process of synthesizing this data into a coherent narrative for clients has remained largely manual. Jeff Sauer, a prominent figure in the digital marketing space, released a monthly reporting template in 2014 that became an industry standard, downloaded tens of thousands of times. Despite its popularity, the template highlighted a systemic issue: even with a solid structural framework, professionals were still required to manually populate every cell, chart, and table on a recurring basis.
Industry data suggests that marketing agencies spend between 10% and 20% of their billable hours on report generation. For a mid-sized agency, this translates to hundreds of hours per month spent on data entry rather than strategic analysis. The emergence of AI-driven tools like thinkcell Assist aims to reclaim this time by automating the bridge between spreadsheet data and presentation software.
Technical Specifications and the AI Integration Layer
thinkcell, a software company long established in the management consulting world for its advanced PowerPoint charting capabilities, has introduced "Assist" to integrate Large Language Model (LLM) capabilities directly into the Microsoft Office environment. Unlike general-purpose AI chatbots, this tool is specifically engineered to interact with thinkcell’s proprietary library of complex chart types, including Waterfall, Mekko, and Gantt charts.
The integration functions as an overlay within PowerPoint and Excel, utilizing a chat interface that allows users to command the software to build, update, or reformat slides based on raw data inputs. This represents a move toward "Intent-Based Design," where the user provides the goal and the data, and the AI handles the execution of the visualization according to professional standards.

The Installation and Implementation Process
The implementation of thinkcell Assist on modern operating systems, including macOS, underscores the increasing demand for cross-platform compatibility in professional environments. Technical reviews indicate that the installation process is streamlined, though it requires specific system-level permissions to allow the AI to communicate across different applications in the Microsoft Office suite.
A common friction point identified during the setup phase involves the granting of accessibility permissions. Without these, the AI layer cannot "read" the existing slide structure or push updates to the Excel-linked charts. This highlights a broader trend in enterprise software where security and inter-app communication must be carefully balanced to enable automation features.
Chronology of a Modernized Reporting Workflow
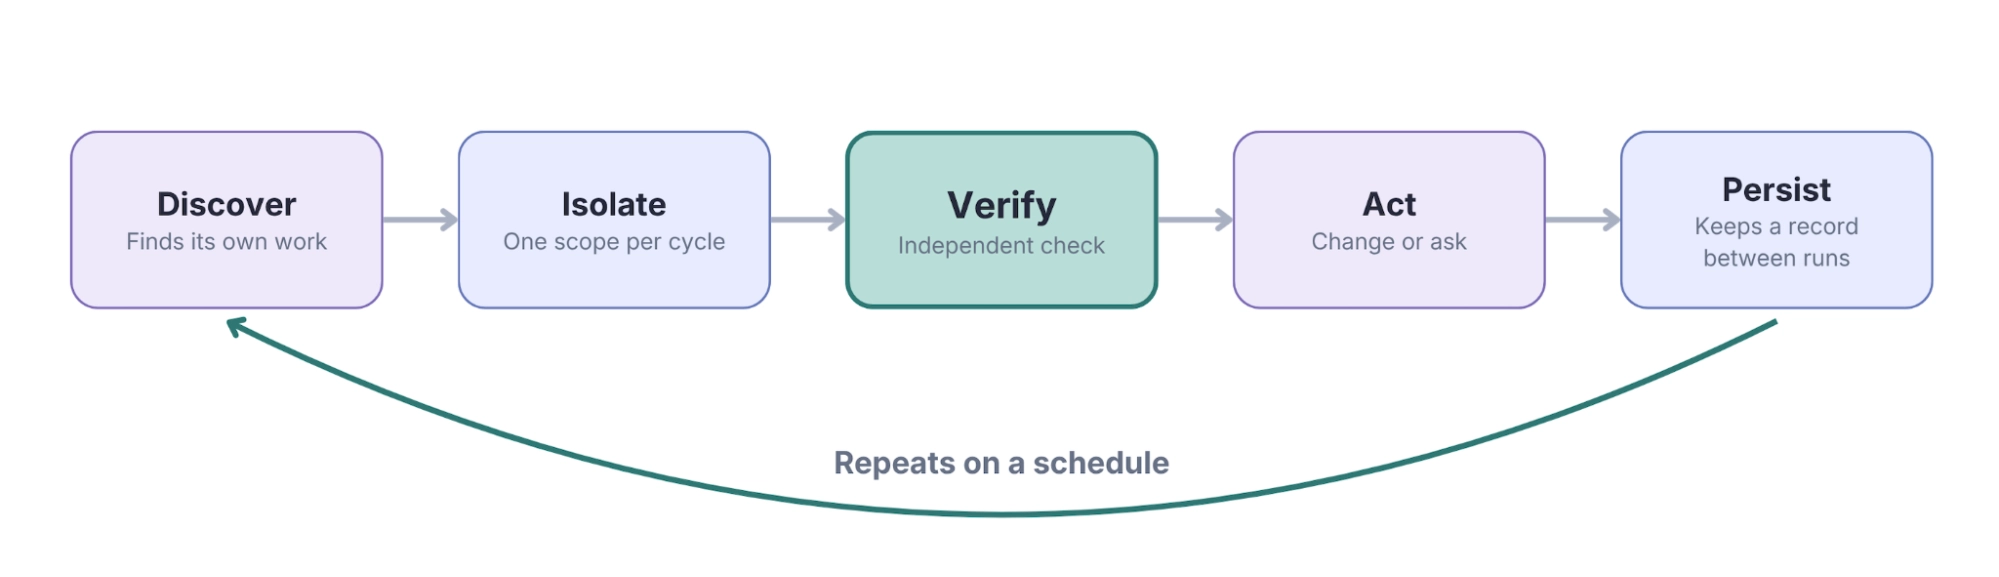
The transition from a manual reporting process to an automated one using thinkcell Assist follows a specific logical progression. This workflow demonstrates how AI can modernize legacy assets, such as the decade-old templates used by many veteran consultants.

- Diagnostic Analysis: Upon launching the tool within an existing presentation, the AI conducts an audit of the current slides. It identifies outdated chart types and provides specific recommendations for better data visualization. For example, it may suggest replacing a standard bar chart with a Waterfall chart to better illustrate the components of revenue growth.
- Visual Modernization: The AI can update font styles, color palettes, and text formatting across an entire deck simultaneously. While current iterations of the tool have limitations regarding the modification of "Slide Masters" (the underlying background architecture of a PowerPoint file), they can handle the labor-intensive task of updating body copy and individual element styles.
- Data Ingestion and Table Construction: Users can input raw KPI data—such as revenue, conversion rates, and Customer Acquisition Cost (CAC)—directly into the chat interface. The AI then constructs formatted tables and charts that compare these figures against predefined targets.
- The Excel-PowerPoint Nexus: The final stage of the setup involves linking the PowerPoint elements to a live Excel spreadsheet. This creates a "single source of truth," where future updates to the spreadsheet are automatically reflected in the presentation slides, effectively turning the monthly report into a self-updating document.
The Role of "Pushback" in Human-AI Collaboration
A significant finding in the deployment of thinkcell Assist is the necessity of "active prompting" or "pushing back" against the AI. In some instances, the AI may initially claim an inability to perform a complex task, such as rebuilding a narrative table from a spreadsheet. However, by providing additional context or referencing previous successful actions within the same session, users can guide the AI to complete the task.
This phenomenon is well-documented in the field of prompt engineering. It suggests that as reporting tools become more sophisticated, the skill set of the marketing professional will shift from "data entry" to "AI orchestration." The ability to accurately frame requests and hold the AI accountable for its capabilities is becoming a core competency in the modern office.
Supporting Data: Efficiency Gains and Visualization Quality
The impact of specialized visualization tools like thinkcell is most visible in the quality of the output. Traditional PowerPoint charts often lack the precision required for high-stakes executive meetings. In contrast, thinkcell’s library is designed for clarity and professional aesthetics.

- Time Efficiency: Preliminary testing indicates that the time required to build a comprehensive monthly executive summary can be reduced from several hours to approximately 60 seconds once the data links are established.
- Accuracy: By linking slides directly to Excel, the risk of human error—such as typos during manual data transfer—is virtually eliminated.
- Narrative Synthesis: One of the most advanced features of the Assist tool is its ability to generate an executive summary. By analyzing the data contained within the report, the AI can draft a summary slide that highlights whether targets were met and what the implications are for the business, a task that previously required significant cognitive effort from a senior analyst.
Broader Implications for the Professional Services Industry
The automation of reporting has profound implications for the agency business model. Traditionally, many agencies have relied on the "billable hour," where time-intensive tasks like reporting contributed to revenue. As these tasks are automated, agencies may need to shift toward value-based pricing, where they are compensated for the insights and strategic growth they provide rather than the time spent formatting slides.
Furthermore, the democratization of high-end data visualization means that smaller firms can now produce reports that match the aesthetic and analytical quality of global management consultancies like McKinsey or BCG, who have used thinkcell for years. This levels the playing field in terms of professional presentation, forcing firms to compete more on the actual substance of their marketing results.
Current Limitations and Future Developments
Despite the advancements, the current state of AI reporting tools still faces hurdles. A notable absence in the current version of thinkcell Assist is the lack of direct API integrations with primary data sources like Google Analytics 4 (GA4) or Meta Ads Manager. Users must still move data from these platforms into Excel before the AI can take over.

Industry analysts expect the next phase of development to include "Direct-to-Source" connectivity, where the AI assistant can pull data directly from an advertising API and generate a full report without a spreadsheet intermediary. Until then, the Excel-to-PowerPoint link remains the most robust method for maintaining data integrity.
Conclusion: The Strategic Shift in Marketing Analytics
The integration of AI into the reporting process through tools like thinkcell Assist marks the end of the era of the "manual template." While the structure of a good report remains constant—starting with high-level KPIs and moving into granular insights and executive summaries—the method of delivery is becoming increasingly automated.
For the digital marketing professional, this shift represents a move away from the "technician" role and toward the "strategist" role. By offloading the mechanical aspects of data visualization to an AI that understands the nuances of professional charting, analysts can spend more time interpreting what the numbers mean for the client’s bottom line. The success of these tools will ultimately be measured not just by the time they save, but by the clarity of the decisions they enable.


 Jia Lissa

 Siti Muinah