The mobile application industry has reached a point of saturation where traditional performance metrics are no longer sufficient to guarantee market success or long-term user retention. While the majority of mobile app professionals currently utilize some form of analytics to monitor their products, a significant portion of these workflows remains fundamentally flawed due to an over-reliance on quantitative data. This systemic gap in data analysis often leaves developers and product managers with a comprehensive understanding of what is happening within their apps, but no clear indication of why those events are occurring. To address this, industry leaders are increasingly turning toward qualitative analytics—specifically touch heatmaps and user session recordings—to bridge the gap between numerical data and human behavior, thereby creating a more holistic approach to app optimization and troubleshooting.
The Quantitative Limitation and the Rise of Behavioral Data
For the past decade, the standard for mobile app success has been measured through quantitative analytics. These tools provide a wealth of numerical data, including Daily Active Users (DAU), Monthly Active Users (MAU), churn rates, and conversion funnels. This data is essential for identifying broad trends; for instance, quantitative metrics can alert a team if 40% of users abandon a signup flow on the third screen. However, these numbers act as a diagnostic alarm rather than a solution. They indicate the presence of a problem without diagnosing the specific friction point, such as a confusing UI element, a broken button, or a field that asks for too much personal information.
The limitation of a purely quantitative approach is that it treats users as data points rather than individuals with specific intentions and frustrations. As the cost of user acquisition (CAC) continues to rise across both iOS and Android platforms, the financial stakes for retaining users have never been higher. Industry reports suggest that the average mobile app loses nearly 77% of its DAUs within the first three days after installation. To combat this, the integration of qualitative analytics has moved from a "luxury" feature to a core requirement in the development lifecycle. By observing the actual user journey through visual tools, professionals can identify the "User Experience (UX) friction" that numbers alone cannot capture.
Technological Fundamentals: Touch Heatmaps and Session Recordings
Qualitative analytics is primarily comprised of two sophisticated technological features: touch heatmaps and user session recordings. Each serves a distinct purpose in the investigative process of app optimization.
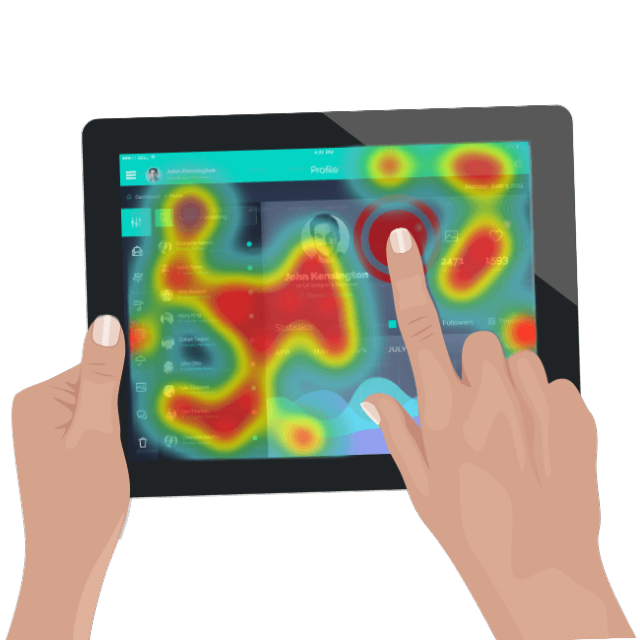
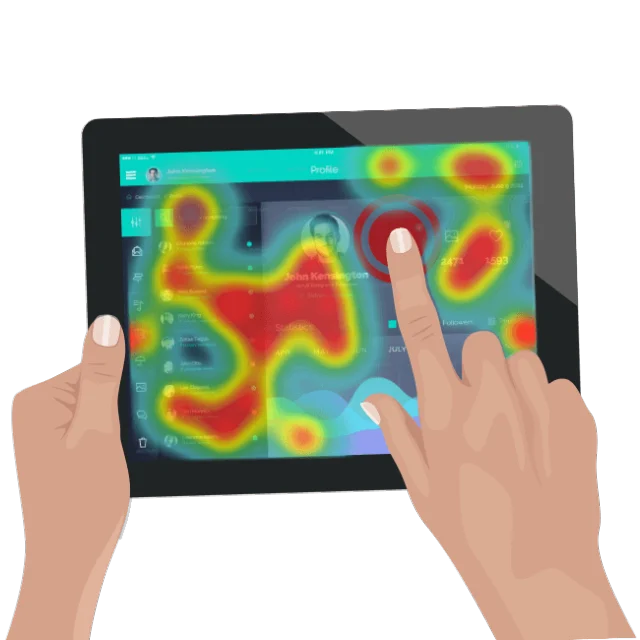
Touch heatmaps function by aggregating every gesture performed by a user on a specific screen. This includes taps, double-taps, long presses, and swipes. The data is then visualized as a color-coded overlay, where "hot" areas indicate high interaction and "cold" areas indicate neglect. This visualization allows developers to immediately see if users are ignoring a primary Call to Action (CTA) or if they are consistently tapping on an element that is not actually interactive. These "unresponsive gestures" are critical indicators of user frustration. When a user taps a non-button element expecting a result, it reveals a fundamental mismatch between the designer’s intent and the user’s mental model.
User session recordings provide an even more granular view. This technology captures the entirety of a user’s interaction with the app in a video format, showing the sequence of screens, the duration of pauses, and the path taken to reach a specific goal. Unlike traditional usability testing, which occurs in a controlled laboratory setting, session recordings offer an unbiased view of how users behave in their natural environments. This "in the wild" data is invaluable for identifying why an app might be crashing on a specific device or why users are failing to complete a checkout process. Modern qualitative tools are designed to run in the background with minimal impact on device performance, ensuring that the data collected is reflective of a standard user experience.
Chronology of Analytics Evolution
The transition toward qualitative integration can be viewed through a three-stage chronological evolution of the mobile industry:
- The Primitive Era (2008–2012): Early mobile analytics were largely mirrored after web analytics. Developers focused on simple download counts and basic crash logs. The primary goal was functional stability rather than optimized experience.
- The Quantitative Era (2013–2018): As the App Store and Google Play grew, sophisticated quantitative tools emerged. Concepts like "AARRR" (Acquisition, Activation, Retention, Referral, Revenue) became the industry standard. This era focused on "The What"—tracking every click and event to build complex funnels.
- The Qualitative/Behavioral Era (2019–Present): With the market nearing maturity, the focus shifted toward "The Why." The emergence of privacy-compliant session recording and heatmap technology allowed teams to see the human behavior behind the data. This era is characterized by the synthesis of both data types to drive "Data-fueled Optimization."
Data-Fueled Optimization and Proactive Troubleshooting
The modern analytics workflow is being revamped into two primary strategic frameworks: Data-fueled Optimization and Proactive Troubleshooting.
In the Data-fueled Optimization workflow, quantitative and qualitative tools work in a feedback loop. Quantitative data acts as the "Alert" system. For example, if an e-commerce app sees a 15% drop in conversion at the shipping selection stage, the quantitative tool flags the drop. The qualitative tool then serves as the "Investigative" phase. By watching session recordings of the users who dropped off, the product team might discover that the "Next" button is hidden by the keyboard on certain screen sizes. The final phase is "Resolution," where the UI is adjusted, and the quantitative numbers are monitored to confirm the fix worked. This "Alert-Investigate-Resolve" cycle replaces the traditional method of "guess-and-check" optimization.
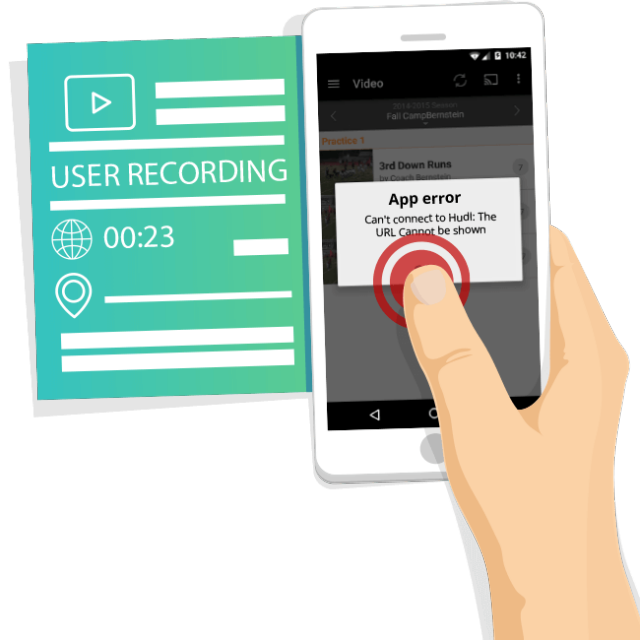
Proactive Troubleshooting represents a shift from reactive maintenance to preventative care. Traditionally, developers waited for crash reports or negative App Store reviews to fix bugs. With qualitative analytics, teams can monitor session recordings and heatmaps in real-time or near-real-time. This allows them to spot usability issues—such as a login button that requires three taps to respond—before they result in a mass exodus of users. By identifying these "micro-frustrations," developers can patch issues during regular update cycles, often before the majority of the user base even realizes a problem existed.
Industry Implications and Privacy Considerations
The broader impact of this shift is felt across the entire corporate structure. Product managers can now present visual evidence to stakeholders to justify design changes, rather than relying on subjective opinions. For developers, session recordings provide a clear reproduction of bugs, drastically reducing the time spent on troubleshooting. Marketing teams can see exactly which parts of a landing page capture attention, allowing for more effective ad spend.
However, the rise of qualitative analytics has also brought data privacy into the spotlight. Regulations such as the General Data Protection Regulation (GDPR) in Europe and the California Consumer Privacy Act (CCPA) in the United States have forced analytics providers to implement rigorous "privacy by design" features. Modern qualitative tools now include automatic masking of sensitive information, such as passwords, credit card numbers, and personal identifiers, ensuring that while the behavior is recorded, the user’s private data remains secure. This balance between behavioral insight and data security is the current frontier of the industry.
Analysis of Future Trends
Looking forward, the integration of Artificial Intelligence (AI) with qualitative analytics is expected to be the next major milestone. Currently, analyzing hundreds of hours of session recordings can be labor-intensive. Emerging AI algorithms are beginning to "watch" these recordings automatically, flagging sessions that contain "rage clicks" (repeatedly tapping a button in frustration) or "u-turns" (quickly leaving a screen after entering). This will allow for even faster identification of UX friction at a massive scale.
In conclusion, the evolution of mobile app analytics is moving toward a more nuanced, human-centric model. By combining the "what" of quantitative data with the "why" of qualitative insights, mobile professionals can move beyond simple tracking and toward true product excellence. The ability to visualize the user journey through heatmaps and recordings provides a competitive advantage that is becoming indispensable in an increasingly crowded digital marketplace. The transition from a flawed, single-track workflow to a dual-layered analytical approach is not merely a technical upgrade; it is a strategic necessity for any mobile product aiming for long-term viability and user satisfaction.