

In the contemporary digital economy, data-driven decision-making has transitioned from a competitive advantage to a fundamental requirement for survival. At the heart of this transition is A/B testing—a method of comparing two versions of a webpage or app against each other to determine which one performs better. While software platforms have made it easier than ever to deploy these experiments, the interpretation of the resulting data remains a complex challenge that requires a blend of statistical rigor, behavioral psychology, and strategic business analysis. Misinterpreting a dashboard’s "winner" can lead organizations to implement changes that inadvertently harm the user experience or fail to deliver expected revenue growth. To truly leverage experimentation, stakeholders must look beyond the surface-level metrics provided by testing software and understand the underlying mechanisms of statistical significance, sample size stability, and segmented user behavior.
The Foundations of Reliable Experimentation
The process of interpreting A/B test results begins long before the final data is analyzed. It starts with the establishment of a robust experimental framework. Experts in conversion rate optimization (CRO) emphasize that the first step in any analysis is ensuring that the results are statistically significant and derived from a sufficiently large sample size. Statistical significance is a measure of the probability that the difference in performance between two variations is not due to random chance. However, significance alone is insufficient. A test may reach a 95% confidence level within hours if a sudden surge of specific traffic occurs, but without a large enough sample size to represent the total audience, that significance is volatile and prone to "regressing to the mean."
Furthermore, practitioners must account for business cycles. A standard recommendation is to run a test for at least one to two full business cycles—typically one to two weeks. This duration ensures that the data captures variations in user behavior that occur on different days of the week or times of day. For instance, an e-commerce site may see highly motivated "mission shoppers" on Monday mornings and "leisure browsers" on Sunday evenings. A test that concludes prematurely may inadvertently favor a variation that appeals only to one of these groups.
The Chronology of an A/B Test Lifecycle
Understanding the results requires a retrospective look at the experiment’s timeline. A professional experimentation workflow generally follows five distinct phases:
- The Hypothesis Phase: Analysts identify a friction point in the user journey and propose a change. This stage defines the "Primary Metric" (e.g., completed purchases) and "Guardrail Metrics" (e.g., page load speed or unsubscribe rates) to ensure the change doesn’t cause collateral damage.
- The Deployment Phase: The software splits traffic between the Control (A) and the Variation (B). During this time, "peeking"—the act of checking results early and making decisions—is discouraged, as it can lead to false positives.
- The Data Accumulation Phase: The experiment runs until it reaches a pre-calculated sample size. Modern software platforms often use automated calculators to determine how many users are needed to detect a specific "Minimum Detectable Effect" (MDE).
- The Statistical Validation Phase: The software’s engine applies either Frequentist or Bayesian models to calculate the probability of success.
- The Post-Test Analysis Phase: This involves segmenting the results by device, traffic source, and user type to see if the "average" result masks significant wins or losses in specific sub-groups.
Decoding Statistical Models: Frequentist vs. Bayesian
One of the primary sources of confusion in interpreting A/B test results is the difference between the two main statistical engines used by software: Frequentist and Bayesian.
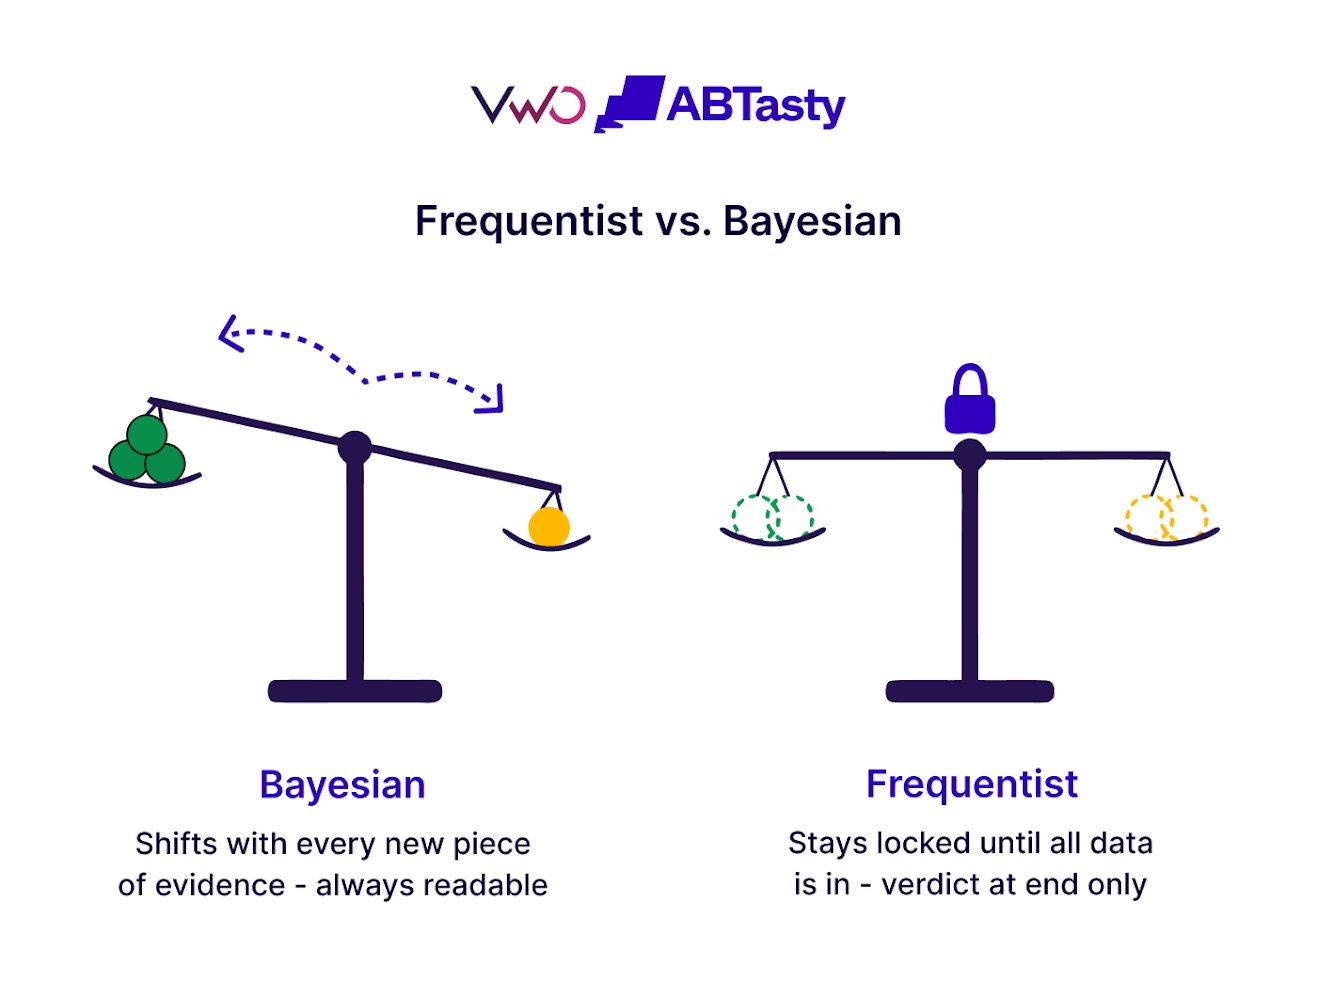
The Frequentist approach, which has been the industry standard for decades, focuses on the "p-value." It asks: "If there were no real difference between the variations, how likely is it that we would see these results?" A p-value of less than 0.05 is typically considered significant. However, Frequentist models require a fixed sample size determined in advance. If an analyst stops the test the moment the p-value hits 0.05 without reaching the target sample size, the risk of a Type I error (a false positive) increases dramatically.
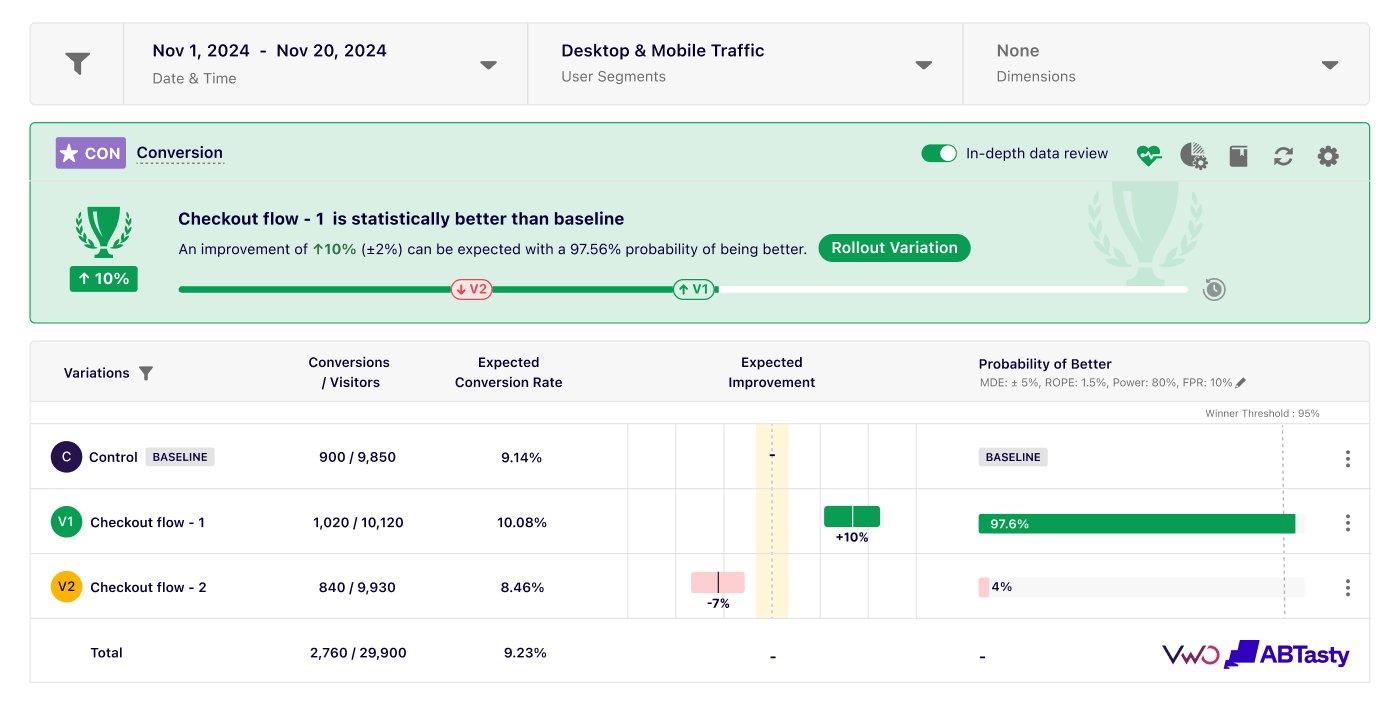
Conversely, the Bayesian approach, adopted by platforms like VWO and GrowthBook, asks: "Given the data we have collected, what is the probability that Variation B is better than Variation A?" This model provides a more intuitive "Probability of Being Best" score. Bayesian statistics are generally more flexible, allowing for real-time data updates without the same "peeking" penalties associated with Frequentist models. Understanding which model a platform utilizes is crucial for determining when and how to act on the data.
Strategic Segmentation and Behavioral Validation
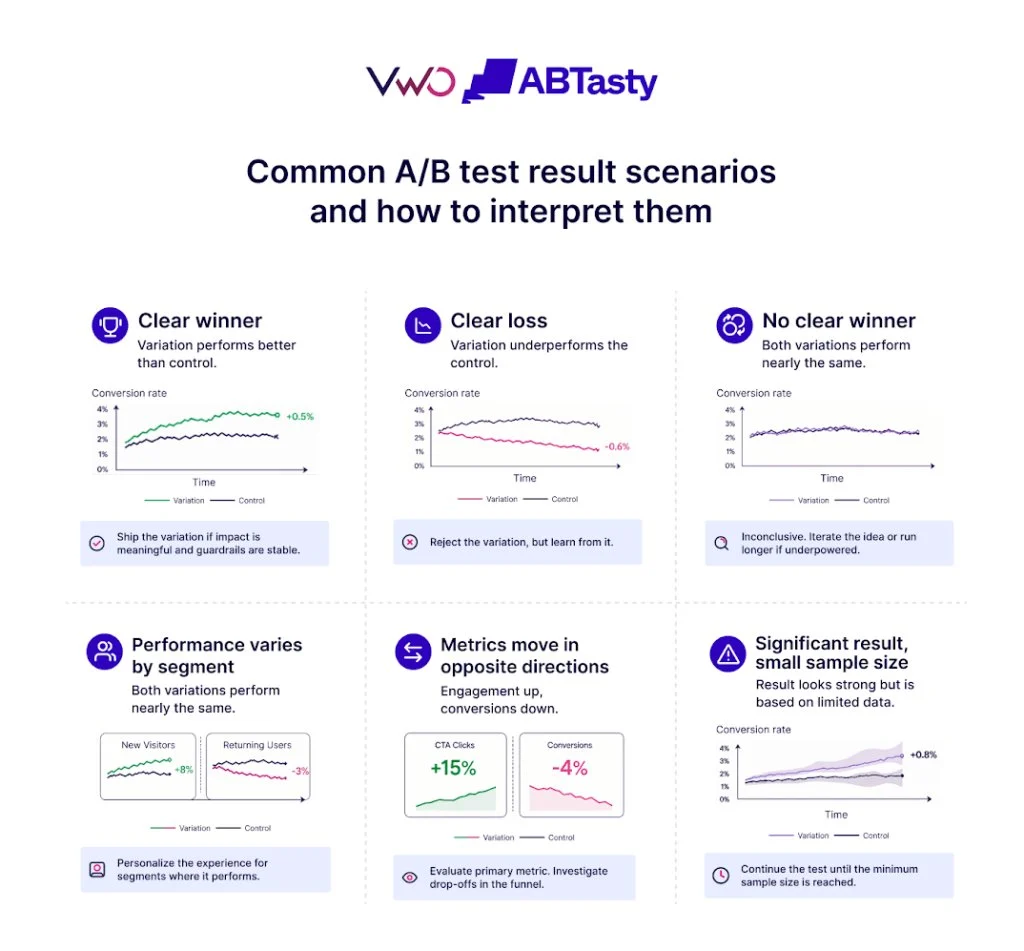
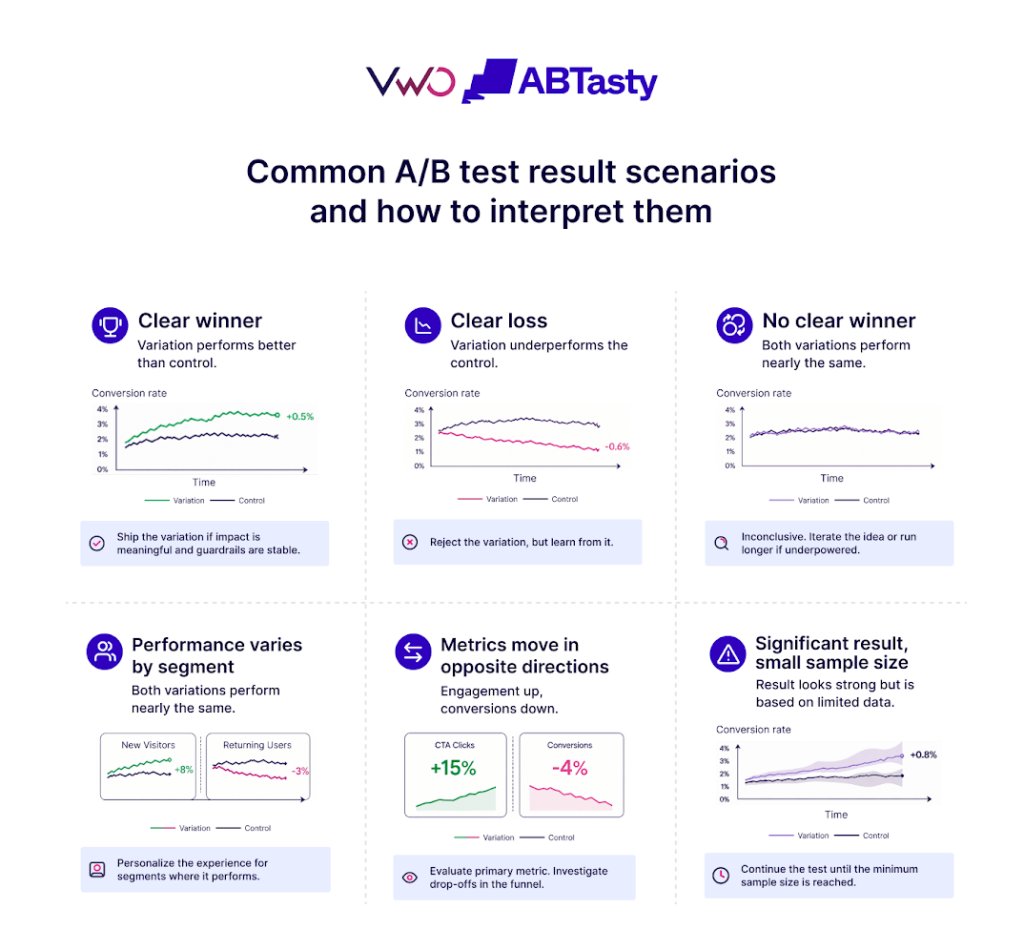
Aggregated results can be deceptive. A test may show a "flat" result—meaning no significant difference between the control and the variation—when in reality, the variation was a massive success on mobile devices but a failure on desktop. This phenomenon, often referred to as Simpson’s Paradox, occurs when a trend appears in several groups of data but disappears or reverses when these groups are combined.
To avoid this, results must be segmented by:
- Device Type: Mobile, tablet, and desktop users often have different intents and technical constraints.
- Traffic Source: Users arriving from organic search may behave differently than those from a high-intent paid social campaign.
- User Type: New visitors are often more susceptible to UI changes, while returning visitors may experience "Change Aversion," where they initially react negatively to any alteration of a familiar interface.
Beyond numerical data, behavioral validation acts as a "sanity check." Modern testing suites often integrate heatmaps, session recordings, and scroll behavior analysis. If the data shows a 10% lift in conversions, but session recordings reveal that users are clicking a button they didn’t intend to, the "win" might be a result of a dark pattern or a technical glitch rather than a genuine improvement in user experience.
Comparative Analysis of Industry-Leading Software Engines
How a platform presents data is governed by its underlying statistical engine. A survey of the current market reveals several distinct approaches:
- VWO (SmartStats): Utilizing a Bayesian-powered engine, VWO provides a "Probability to Outperform" metric. This is designed to give practitioners a clear estimate of potential revenue impact and the "loss function"—the risk associated with choosing the wrong variation.
- Optimizely: Known for its "Stats Engine," Optimizely uses sequential testing. This Frequentist-based modification allows for continuous monitoring of results while controlling for false positives, effectively solving the "peeking problem" that plagued earlier digital experimentation.
- GrowthBook: This open-source platform offers the unique flexibility to switch between Bayesian and Frequentist models. Its primary strength lies in its ability to connect directly to a company’s data warehouse, ensuring that the experiment data is consistent with the "source of truth" used by the rest of the business.
- Statsig: Focused heavily on product experimentation, Statsig uses a "Scorecard" approach. It highlights not just the primary goal but also how a change impacts dozens of secondary metrics across the entire product ecosystem, providing a holistic view of the experiment’s impact.
Common Pitfalls and Expert Perspectives
Even with sophisticated software, human error remains a significant factor in misinterpretation. One common mistake is ignoring "Guardrail Metrics." For example, a redesign might increase the "Add to Cart" rate but simultaneously increase the "Customer Support Ticket" rate because the new checkout flow is confusing.
Vinayak Purshan, Associate Marketing Director at Cashfree Payments, notes that the fear of failure often prevents teams from running critical experiments. "We should have this in our mind, that not every test will win," Purshan stated in a recent industry podcast. "The moment you think all tests are going to pass, you will not have a free hand in running any critical experience because you have fear in your mind that it might fail." This perspective highlights the importance of documenting "losses" as much as "wins," as they provide vital information about what users do not want.
Another pitfall is the "Novelty Effect," where users engage with a new element simply because it is new. This can lead to a temporary spike in engagement that disappears once the novelty wears off. Running tests for at least two weeks helps mitigate this bias.

Turning Data into Actionable Business Intelligence
The ultimate goal of interpreting A/B test results is to make an informed "ship" or "no-ship" decision. This requires a structured four-step approach:
First, confirm that the test has met the pre-defined criteria for significance and sample size. Second, translate the percentage lift into actual business terms. A 0.5% lift in conversion might be statistically significant, but if it only translates to an extra $100 a month for a multi-million dollar enterprise, the engineering cost of implementing the change may outweigh the benefit.
Third, account for external factors. Was there a major holiday during the test? Did a competitor launch a massive sale? These external variables can skew results in ways that the software cannot always detect. Fourth, act on every result. If a test is a clear winner, ship it. If it is a clear loss, document the learning and iterate. If it is inconclusive, use the directional signals to form a more aggressive or targeted hypothesis for the next round of testing.
Broader Impact and the Future of Experimentation
As artificial intelligence and machine learning become integrated into testing platforms, the interpretation of results is moving toward "automated insights." Tools are now capable of automatically identifying which segments saw the most lift or predicting the long-term impact of a change on customer lifetime value (CLV).
However, the human element remains irreplaceable. The ability to ask "Why did the user behave this way?" is what separates a data-informed company from a data-driven one. A data-driven company follows the numbers blindly; a data-informed company uses the numbers as one of many signals to build a better product. By mastering the art and science of result interpretation, organizations can transform their experimentation program from a series of isolated tests into a powerful engine for continuous growth and innovation. In the end, the most successful companies are not those that run the most tests, but those that best understand the results of the tests they run.







