The landscape of digital marketing has undergone a radical transformation over the last decade, transitioning from a creative-led discipline to a data-driven science. At the heart of this shift is A/B testing, a methodology that, in theory, allows brands to apply the same rigorous scientific principles used in physics, medicine, and genetics to their user interfaces and marketing funnels. Each A/B experiment functions as a randomized controlled trial (RCT), the gold standard for establishing causality. However, a growing rift has emerged between the academic standards of statistics and the practical applications found in the corporate world. Industry experts warn that the common advice and standard practices in A/B testing are lagging nearly half a century behind modern statistical approaches to experimentation, leading to a "replication crisis" within conversion rate optimization (CRO).
The discrepancy between theoretical science and marketing practice has led to significant financial inefficiencies and illusory results. Most A/B testing literature and the software tools used daily by practitioners suffer from three fundamental flaws: the misuse of statistical significance, a total lack of consideration for statistical power, and the inherent inefficiency of classical fixed-sample testing. To bridge this gap, a new framework known as the AGILE statistical approach—inspired by the rigorous protocols of clinical trials—is being proposed as a necessary evolution for the industry.
The Statistical Significance Trap and the Perils of Data Peeking
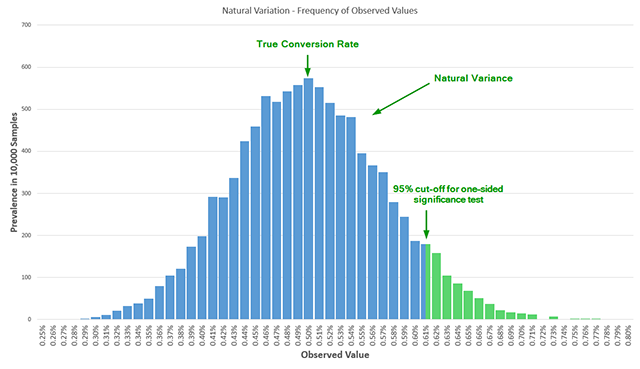
In the lexicon of digital marketing, "statistical significance" is perhaps the most cited yet least understood term. In its simplest form, a significance test measures the probability that an observed difference in conversion rates occurred due to random chance rather than the changes implemented in the test variant. However, classical statistical models, such as the Student’s T-test, come with a strict mathematical constraint: the sample size must be fixed in advance.
The standard model assumes that data is evaluated at a single, predetermined point in time. If a practitioner decides to test 40,000 users, they must wait until the 40,000th user has completed their journey before looking at the results. In the high-pressure environment of e-commerce and SaaS, this requirement is frequently ignored. Managers and stakeholders, eager to see results or minimize losses, engage in "data peeking"—the act of checking the results daily and making decisions based on fluctuating confidence levels.
This "optional stopping" is a violation of the fundamental assumptions of frequentist statistics. When a practitioner peeks at the data multiple times, the probability of a false positive (Type I error) increases exponentially. Historical data indicates that peeking just five times during an experiment can increase the actual error rate to 3.2 times the reported nominal error. Peeking ten times can result in a five-fold increase in false positives. This phenomenon was documented by statisticians as early as 1969, yet it remains a rampant issue in modern digital experimentation. Without adjusting for these multiple evaluations, the reported "95% confidence" is often a statistical illusion, leading companies to implement changes that provide no real value or, in some cases, actively harm their conversion rates.
The Invisible Crisis of Statistical Power
While false positives are a well-known risk, "false negatives"—failing to detect a real improvement—are equally damaging to a company’s bottom line. This issue stems from a lack of statistical power, often referred to as "test sensitivity." Statistical power is the probability that a test will detect an effect of a certain size if that effect truly exists.
A review of seven influential books on A/B testing published between 2008 and 2014 revealed a startling oversight: only one book mentioned statistical power in a proper context, and even then, the coverage was superficial. This lack of education has resulted in a culture where many tests are "under-powered." Running an under-powered test is akin to looking for a needle in a haystack with a broken flashlight; even if the needle is there, you are unlikely to find it.
Statistical power is inextricably linked to sample size. To design a valid experiment, a practitioner must balance four variables: the historical baseline conversion rate, the desired significance threshold (Alpha), the desired power (Beta), and the minimum effect size of interest (MDE). Many free online calculators operate at a default power of 50%, which is effectively no better than a coin toss. To achieve a more standard power of 80% or 90%, the required sample sizes are often much larger than marketing teams anticipate. When teams fail to account for power, they often abandon successful ideas prematurely, believing they "didn’t work," when in reality, the test simply wasn’t sensitive enough to capture the gains.
The Inefficiency of Classical Fixed-Sample Testing
The third major hurdle is the sheer inefficiency of the classical "Fixed-Sample Size" approach. While these methods are effective in stable environments like agricultural research or physics, they are poorly suited for the volatile, high-stakes world of digital business.
In a fixed-sample test, the duration is set based on the "Minimum Detectable Effect." If a team plans a test for a 10% lift but the variant actually delivers a 20% lift, the test continues to run long after the result has become obvious, wasting valuable time and traffic. Conversely, if a variant is performing disastrously, a fixed-sample test technically requires the practitioner to keep the losing variant live until the full sample size is reached to maintain statistical integrity. This leads to "efficacy waste"—the loss of potential revenue because a winner wasn’t implemented sooner—and "downside risk"—the continued exposure of users to a harmful user experience.
The AGILE Solution: Borrowing from Bio-Statistics
The solution to these challenges lies in the field of medical science and bio-statistics. In clinical trials, where human lives are at stake, researchers cannot afford to be inefficient, nor can they ignore the ethics of continuing a trial when a drug is clearly working or clearly failing. This led to the development of "Group Sequential Design," which forms the basis of the AGILE statistical method for A/B testing.
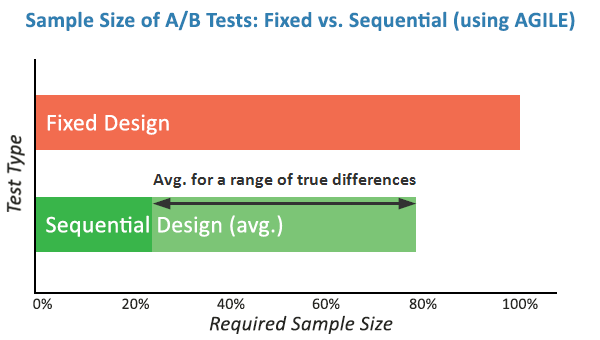
The AGILE method introduces several critical innovations to the CRO workflow:
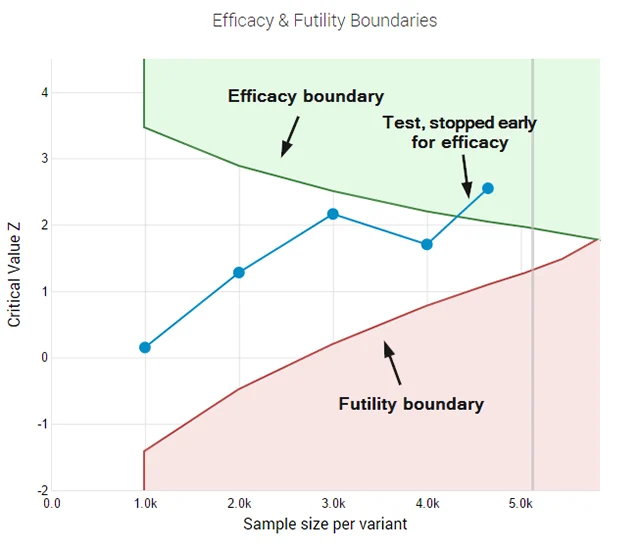
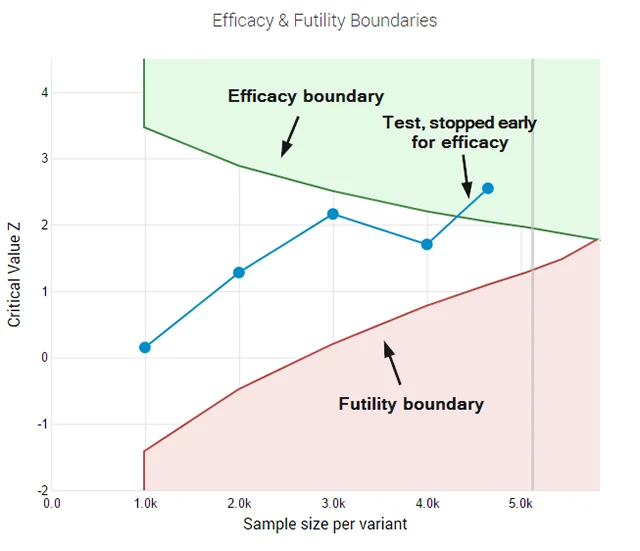
- Error-Spending Functions: Instead of requiring a single look at the end of a test, AGILE uses mathematical functions to "spend" the allowed error rate across multiple interim analyses. This allows practitioners to peek at the data legally, adjusting the significance thresholds at each stage to ensure the overall false positive rate remains controlled.
- Early Stopping for Efficacy: If a new feature is performing exceptionally well, the AGILE method provides a statistical framework to "call" the winner early. This can result in efficiency gains of 20% to 80%, allowing companies to move on to the next experiment faster.
- Futility Stopping Rules: One of the most powerful aspects of AGILE is the ability to "fail fast." If the data indicates that a variant has almost no chance of reaching significance, the test can be stopped for "futility." This prevents the waste of resources on mediocre ideas and allows teams to pivot toward more promising hypotheses.
- Guaranteed Statistical Power: Because AGILE requires the explicit definition of power during the design phase, it ensures that every test has a calculated chance of success, eliminating the "coin toss" experiments that plague the industry.
Chronology of Statistical Evolution in Experimentation
To understand the necessity of the AGILE approach, one must look at the timeline of how experimental science has intersected with commerce:
- 1920s–1930s: Ronald A. Fisher develops the foundations of frequentist statistics and experimental design, primarily for agricultural research.
- 1950s–1960s: Medical researchers begin adopting Randomized Controlled Trials (RCTs). Sidney Armitage and others identify the "peeking" problem, leading to the birth of sequential analysis.
- 1990s: The dawn of the internet. Companies like Amazon and Google begin using basic A/B testing to optimize web elements.
- 2000s–2010s: A/B testing becomes democratized through "point-and-click" software. However, these tools often prioritize ease of use over statistical rigor, leading to widespread "data-driven" errors.
- 2017–Present: The "AGILE" and "Bayesian" movements emerge in digital experimentation, seeking to bring the rigor of bio-statistics and modern computation to the marketing sector.
Industry Implications and the Path Forward
The transition to more robust statistical methods like AGILE is not merely an academic exercise; it has profound implications for the ROI of digital transformation. For a mid-sized e-commerce company, the ability to run 30% more tests per year due to early stopping can result in millions of dollars in incremental revenue.
Furthermore, as privacy regulations like GDPR and CCPA make user data more scarce and harder to track, the efficiency of every visitor in a test becomes paramount. Organizations that continue to rely on outdated, fixed-sample testing or "wild-west" peeking will find themselves at a competitive disadvantage, making decisions based on "garbage data" while their more rigorous competitors iterate with speed and precision.
Adopting the AGILE method requires a cultural shift within marketing teams. It demands better planning, a deeper understanding of probability, and a departure from the "set it and forget it" mentality. However, for those willing to embrace the complexity, the rewards are clear: a significant decrease in illusory results, a faster pace of innovation, and a truly scientific foundation for digital growth. The era of "guessing and peeking" is coming to an end; the era of agile, rigorous experimentation has arrived.