


The discipline of Conversion Rate Optimization (CRO) has long grappled with a fundamental disconnect between experimental results and actualized financial gains. While a successful A/B test might indicate a 10% lift in a specific metric, stakeholders frequently find that these percentages do not translate linearly into the bottom-line monthly revenue once the winning variant is permanently deployed. This discrepancy has fueled a long-standing debate within the digital marketing and data science communities regarding the validity of revenue forecasting. The central challenge lies in the inherent volatility of the digital ecosystem, where a multitude of external variables—ranging from shifting ad spends to macroeconomic fluctuations—can obscure the true impact of a website modification.

To bridge this gap, practitioners are increasingly moving away from simplistic "vanity" projections toward robust, conservative models that account for statistical decay and external noise. This evolution in thinking reflects a broader maturation of the CRO industry, transitioning from a focus on isolated "wins" to a more holistic view of long-term incremental growth. The necessity of this shift is underscored by the reality that while A/B testing remains the gold standard for proving causality, its predictive power is only as strong as the methodology used to interpret the results in a real-world context.
The Causality Challenge: Why A/B Testing Outperforms Pre-Post Analysis
At the heart of reliable revenue forecasting is the ability to prove that a specific change caused a specific financial outcome. In the absence of a controlled environment, businesses often rely on "pre/post" comparisons—comparing revenue from the month before a change to the month after. However, this method is fundamentally flawed due to its inability to isolate variables. For instance, if a company implements a new checkout flow and subsequently sees a 10% dip in revenue, a pre/post analysis might suggest the change was a failure. In reality, a competitor may have launched a major sale, or the company’s own advertising budget may have been slashed during that period. Without a control group running simultaneously, it is impossible to determine if the new checkout flow actually prevented an even steeper 20% decline.

By utilizing randomized controlled trials (A/B testing), organizations can maintain a baseline (the control) that experiences the same external pressures as the variant. This methodology, borrowed from clinical trials in the medical industry, allows data scientists to filter out "noise" and isolate the true uplift. However, even with causality proven, the transition from a test environment to a permanent implementation introduces new complexities that require a rigorous statistical framework to manage.
Establishing a Robust Statistical Framework for Projections
A revenue forecast is only as reliable as the data points it consumes. To ensure these points are valid, organizations must adhere to strict statistical parameters during the experimentation phase. This involves more than just reaching a 95% confidence level; it requires a deep understanding of "statistical power" and "minimum detectable effect" (MDE).
- Statistical Power: This represents the likelihood that a test will detect an effect if there is one to be found. A test with low power may return a "false negative," leading a company to discard a potentially lucrative improvement.
- Sample Size and Duration: Experiments must run long enough to account for "business cycles," such as weekend vs. weekday behavior. Short-term bursts in data can lead to skewed results that fail to hold up over months or years.
- Representative Targeting: The users included in a test must reflect the broader audience that will eventually see the permanent change. If a test is run only on mobile users but the change is implemented site-wide, the forecast must be adjusted to reflect the different conversion behaviors of desktop users.
By ensuring that individual experiments are adequately powered and methodologically sound, analysts can provide a realistic view of the effect each change will have, creating a stable foundation for the broader revenue model.
The Necessity of Conservative Forecasting and the "Haircut" Approach
One of the most common pitfalls in CRO reporting is the "annualization" of test results without adjustment. A common example involves a store generating $20 million in annual revenue; if a test shows a 10% lift, the team might impulsively claim a $2 million annual gain. This approach is widely considered unrealistic within the industry for several technical and political reasons.
Technical discrepancies often arise from "Selection Bias" and the "Novelty Effect." The novelty effect occurs when returning users interact with a new feature simply because it is new, leading to a temporary spike in engagement that inevitably tapers off as the change becomes part of the standard user experience. Furthermore, the "Regression to the Mean" suggests that extreme results in a short-term test are likely to move closer to the average over a longer duration.
To combat these inaccuracies, seasoned practitioners apply a "haircut" to their projections—a deliberate reduction in the reported lift to account for unforeseen variables. A standard conservative model might include:
- A 10% Initial Haircut: Immediately reducing the observed lift to account for the gap between a controlled test environment and a live production environment.
- Rollout Coverage Adjustments: If a change was tested on a high-traffic product page but is implemented across the entire site, the forecast must be scaled based on actual traffic distribution.
- Time-Decay Modeling: Recognizing that the impact of a website optimization is not permanent. Many models hold the effect steady for a short period (e.g., four months) before applying a monthly decay rate (e.g., 20%) as market conditions and user expectations evolve.
Communicating Value at the Executive Level
For CRO practitioners, the challenge of revenue forecasting is often as much about internal politics as it is about mathematics. While data scientists may be comfortable with the ambiguity of p-values and confidence intervals, executive leadership requires concrete figures to make budgetary decisions. In the boardroom, overly technical explanations can lead to "eye-glazing," whereas realistic, conservative revenue projections speak the language of the C-suite.
The objective of these projections is not to provide an absolute, infallible number, but to provide a "model" for decision-making. By making the assumptions of the model explicit—such as the decay rate and the haircut percentage—the CRO team builds credibility with the finance department. This transparency allows stakeholders to see that the experimentation program is not just "playing with buttons" but is a structured engine for incremental, predictable growth.

A Step-by-Step Methodology for Calculating Cumulative Impact
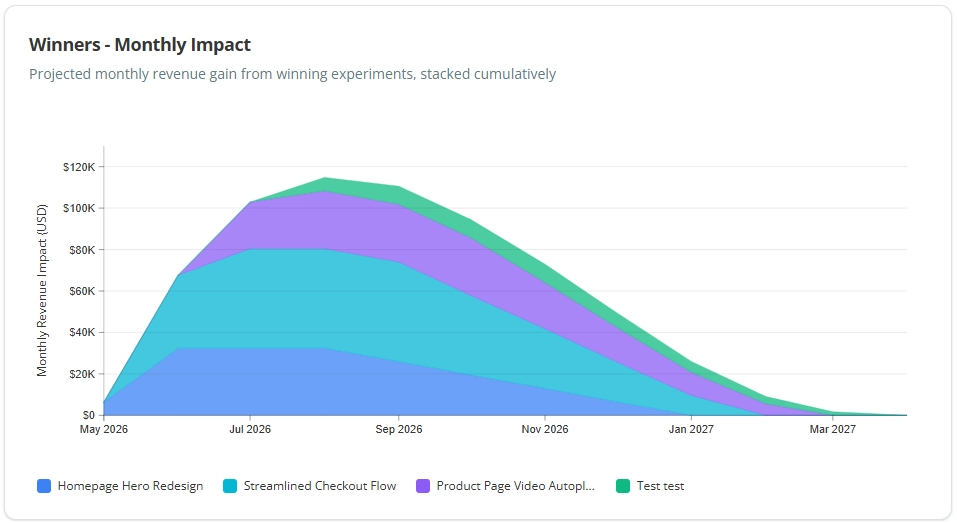
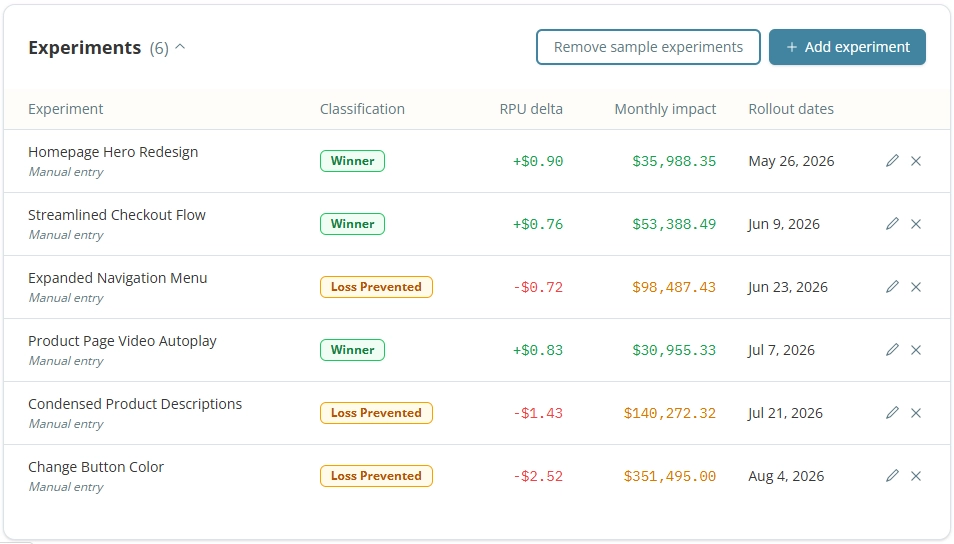
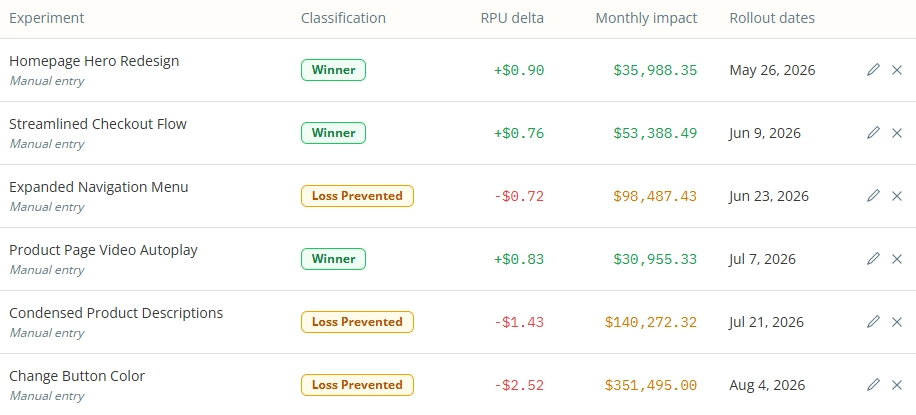
To move from theory to practice, organizations can follow a structured calculation process to determine the projected monthly revenue gain from winning experiments. This process involves stacking the impacts of multiple tests over a specific timeline.
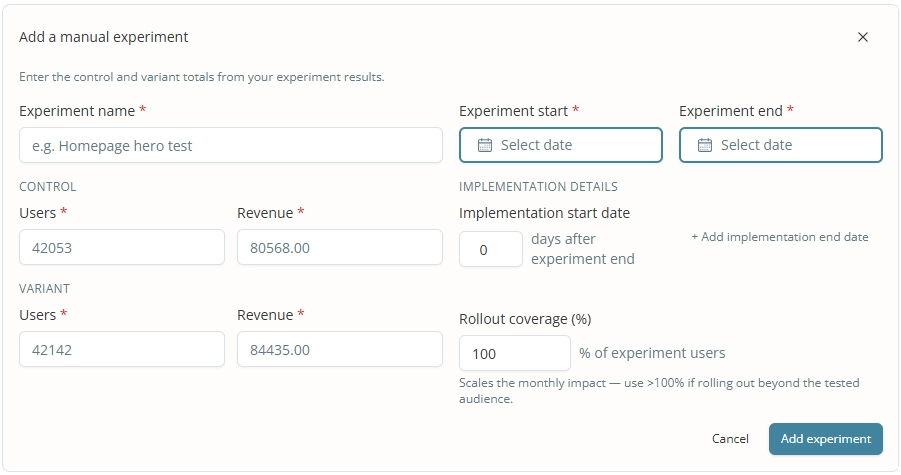
- Calculate the RPU Difference: Determine the difference in Revenue Per User (RPU) between the control and the winning variant.
- Multiply by Monthly Traffic: Apply this RPU difference to the total number of monthly users expected to be exposed to the change.
- Apply the Haircut: Reduce the resulting figure by a predetermined percentage (e.g., 10%) to account for experimental error.
- Determine the Implementation Timeline: Account for the "shipping delay"—the time between the end of a test and the actual code deployment.
- Model the Decay: Apply a reduction over time to show how the "win" eventually fades as the market shifts.
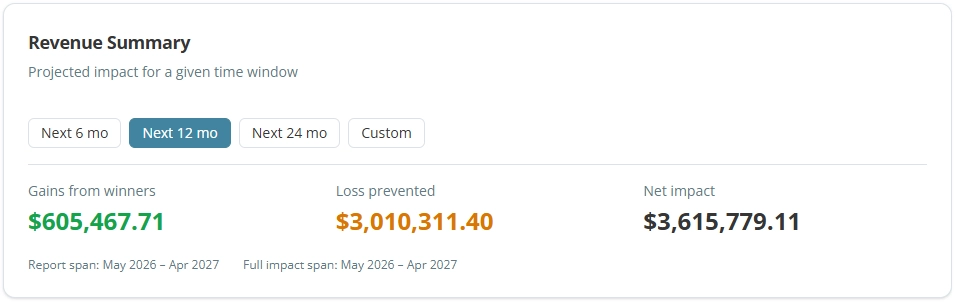
Advanced analytics tools, such as Katsed, have begun automating this process, allowing teams to enter experiment data and generate cumulative graphs. These visualizations are crucial for showing how individual small wins stack on top of one another to create significant long-term revenue shifts. For example, three separate tests, each providing a modest 2% lift, can result in a substantial cumulative impact when their implementation dates are layered correctly.
Integrating Revenue Gains with Return on Investment (ROI)
While revenue forecasting focuses on the "gain" side of the ledger, a complete journalistic analysis must also consider the "investment" side to determine the true ROI of a testing program. The costs associated with CRO are multifaceted and include:
- Personnel: Salaries for dedicated CRO managers, data analysts, and UX designers.
- Engineering Capacity: The "opportunity cost" of using developers to build A/B tests and implement winning changes instead of working on other features.
- Tooling: Subscription costs for A/B testing platforms (e.g., Convert, Optimizely), analytics software, and heatmapping tools.
By comparing the projected revenue gain (after haircuts and decay) against these costs, organizations can justify the expansion of their experimentation programs. If a program costs $500,000 annually but is conservatively projected to generate $2.5 million in incremental revenue, the 5x ROI provides a compelling case for continued investment even in a tightening economy.
Conclusion: The Shift Toward Empirical Realism
Revenue forecasting in the context of digital experimentation is an evolving discipline. While it will never be an exact science due to the chaotic nature of consumer behavior and global markets, the shift toward conservative, model-based reporting represents a significant step forward. By accepting that revenue projections are "models" rather than "promises," the CRO industry can align itself more closely with traditional financial forecasting.
The ultimate value of this approach lies in its ability to turn fragmented data points into a coherent narrative of business growth. As long as the underlying experiments are conducted with statistical rigor and the resulting forecasts are tempered with healthy skepticism, revenue modeling remains the most effective tool for proving the worth of a conversion optimization program in the modern enterprise. In an era where every marketing dollar is scrutinized, the ability to forecast—and then deliver—measurable financial impact is the hallmark of a high-performing digital organization.







