Digital marketing has long positioned itself as the most measurable of the business disciplines, yet a growing consensus among data scientists suggests that the industry’s most fundamental tool—the A/B test—is often executed using statistical frameworks that are nearly half a century behind modern scientific standards. While A/B testing is technically a randomized controlled trial (RCT) akin to those used in clinical medicine or particle physics, the practical application of these tests in conversion rate optimization (CRO) frequently suffers from systemic errors that lead to illusory results, wasted resources, and significant financial losses.
The core of the issue lies in the transition of statistical methods from the laboratory to the dashboard. As digital tools have made it easier to launch experiments, the underlying mathematics have been simplified to the point of fragility. Experts identify three primary failures in current A/B testing methodologies: the misuse of statistical significance tests, a pervasive lack of consideration for statistical power, and the inherent inefficiency of classical fixed-sample testing when applied to the volatile environment of e-commerce and digital interfaces.
The Problem of Data Peeking and Significance Inflation
In the standard A/B testing narrative, "statistical significance" is treated as a finish line. However, classical frequentist statistics, such as the Student’s T-test, were designed under the assumption of a fixed-sample size. This requires a researcher to determine exactly how many subjects will be observed before the experiment begins and to only analyze the data once that threshold is reached.
In the fast-paced world of digital product management, this discipline is rarely maintained. Stakeholders frequently "peek" at data as it accrues. If a variant shows a massive lift after three days, there is immense pressure to stop the test and claim victory. Conversely, if a variant appears to be "tanking," teams often pull the plug early to mitigate losses.
From a statistical standpoint, this "optional stopping" is catastrophic. Every time a practitioner checks the results for significance before the pre-determined sample size is reached, they increase the probability of a false positive (Type I error). Research into experimental design as early as 1969 established that peeking at data just five times can more than triple the actual error rate compared to the reported nominal error. By the tenth peek, the probability of declaring a "winner" that is actually a result of random noise increases fivefold. Without adjusting the mathematical model to account for these multiple looks, the resulting data is effectively "Garbage In, Garbage Out."
Statistical Power: The Missing Sensitivity Metric
While significance (alpha) protects against false positives, statistical power (beta) protects against false negatives. It defines the probability that a test will actually detect an effect if one truly exists. Despite its importance, a comprehensive review of influential A/B testing literature published over the last decade found that the majority of texts failed to mention power entirely or treated it as a secondary concern.
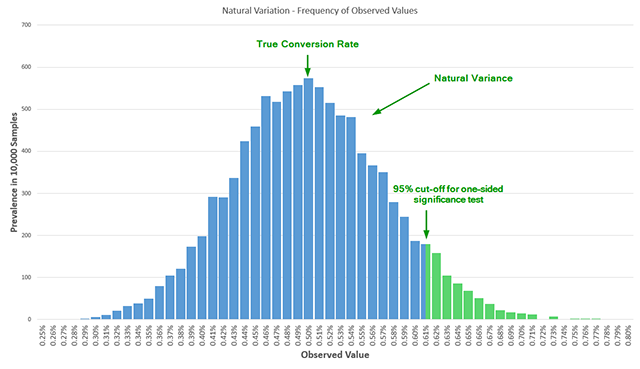
Running an underpowered test is a common pitfall for smaller websites or teams with limited traffic. If a test is designed with only 50% power—essentially a coin toss—there is a high likelihood that a truly superior variant will be discarded simply because the sample size was too small to distinguish its performance from natural variance. This leads to "false negatives," where potentially transformative changes are abandoned, and the organization concludes that a specific strategy "doesn’t work" when, in reality, the experiment was simply too insensitive to measure the gain.
The relationship between power, significance, and sample size is rigid. To increase the sensitivity of a test, one must either increase the sample size, accept a higher risk of false positives, or only aim to detect very large changes. Many free calculators used by marketers defaults to low power settings, leading to a false sense of security regarding the "scientific" nature of their results.
A Chronology of Experimental Design in Industry
The history of A/B testing has moved through three distinct eras, though many practitioners remain stuck in the first.
- The Fisherian Era (1920s–1990s): Based on Sir Ronald A. Fisher’s work, this era focused on agricultural and laboratory experiments where samples were expensive and fixed in advance. This is the origin of the "p-value" and the 95% confidence threshold.
- The Digital Wild West (2000s–2015): As web tools emerged, Fisher’s methods were automated. However, the "real-time" nature of the web led to the "peeking" problem. Marketers treated live dashboards like slot machines, waiting for the "95% Significant" light to flash.
- The Agile/Sequential Era (2015–Present): Borrowing from 1980s-era clinical trials, advanced teams began adopting "Group Sequential Designs." This allows for interim monitoring and early stopping while mathematically correcting for the increased risk of error.
The AGILE Statistical Approach: A New Framework
To bridge the gap between the need for business speed and the requirement for scientific accuracy, the "AGILE" statistical method has been proposed as a solution. Derived from biostatistics used in life-saving medical trials, AGILE (not to be confused with Agile software development) utilizes "error-spending functions."
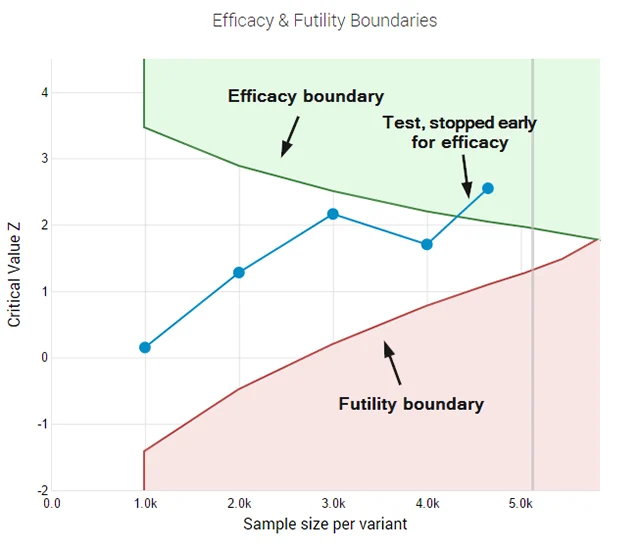
This approach acknowledges that practitioners will inevitably look at their data. Instead of forbidding peeking, the AGILE method "spends" a portion of the allowed error rate at each interim analysis. If you check the data early, the threshold for declaring a winner is much higher (e.g., a p-value of 0.001 instead of 0.05). As the test progresses toward its maximum sample size, the threshold relaxes.
This framework offers several critical advantages for the modern enterprise:
1. Early Efficacy Stopping
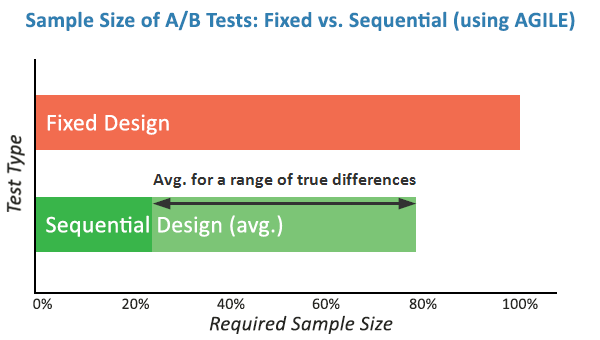
If a new landing page is performing exceptionally well, the AGILE method allows a team to stop the test early with mathematical confidence. Simulations show that if the true lift is significantly higher than the minimum effect of interest, the test can be concluded using only 20% to 50% of the originally planned sample size. This allows companies to realize revenue gains weeks earlier than a fixed-sample test would allow.
2. Futility Stopping Rules
One of the most significant wastes in digital marketing is "running out the clock" on a test that is clearly not going to win. AGILE introduces "futility boundaries." If, halfway through a test, the data shows that the variant has almost no chance of reaching significance, the test can be abandoned. This "fail fast" mentality prevents the "sunk cost fallacy" from tying up testing bandwidth and traffic on losing ideas.
3. Controlled False Positives
By using alpha-spending functions, the overall risk of a false positive remains locked at the desired level (usually 5%), regardless of how many times the dashboard is refreshed. This restores the scientific integrity of the experiment.
Data-Driven Impact and Efficiency Gains
The transition to sequential testing methods like AGILE is not merely a theoretical preference; it has measurable impacts on organizational throughput. According to validation simulations, the AGILE method provides efficiency gains ranging from 20% to 80% compared to classical fixed-sample designs.
In a competitive landscape where the "velocity of experimentation" is a key predictor of success, the ability to run 50% more tests per year using the same amount of traffic is a massive competitive advantage. Furthermore, by reducing the rate of false positives, companies avoid the "leaky bucket" syndrome, where they implement changes that appear to help in a flawed test but actually provide zero or negative value in the long term.
Industry Implications and the Path Forward
The adoption of more rigorous statistical methods represents a maturing of the CRO and digital product industry. For years, the "replication crisis" has plagued social sciences, where researchers found they could not recreate the results of famous studies. Digital marketing is currently facing its own version of this crisis, as many companies find that their "cumulative lifts" from A/B testing over several years do not actually show up in their bottom-line annual revenue. This discrepancy is almost always a result of false positives generated by improper testing.
Industry leaders and lead data scientists are increasingly calling for a "Statistical Reformation." This includes:
- Moving beyond the P-Value: Incorporating Bayesian perspectives or sequential frequentist models like AGILE.
- Mandatory Power Analysis: Ensuring that every test is sized correctly to detect meaningful changes.
- Transparency in Reporting: Moving away from "winning/losing" binary outcomes and toward confidence intervals and effect sizes.
As the barrier to entry for launching experiments continues to drop, the value of the "human in the loop" shifts from execution to design. The practitioners who will succeed in the next decade are those who understand that A/B testing is not just a feature of their software, but a rigorous scientific discipline that requires a modern, agile approach to mathematics. By aligning statistical methods with the reality of business decision-making, the industry can finally deliver on the promise of truly data-driven growth.