Digital marketing has long positioned A/B testing as its most scientifically grounded methodology, yet a significant rift remains between common industry practices and the rigorous standards of modern statistics. While every A/B experiment is fundamentally a randomized controlled trial (RCT)—akin to those utilized in physics, genetics, and clinical medicine—the statistical frameworks applied by many marketing practitioners are nearly half a century behind those used in the hard sciences. This discrepancy has led to widespread issues regarding the validity of experimental results, potentially costing businesses millions in misallocated resources based on illusory data.
The core of the problem lies in the reliance on "fixed-sample" classical statistical tests, which were never designed for the dynamic, high-stakes environment of modern web analytics. As organizations increasingly rely on data-driven decision-making, the need for a more robust, flexible, and efficient framework has become paramount. This requirement has given rise to the AGILE statistical approach, a methodology inspired by clinical trials that allows for interim data monitoring without compromising the integrity of the results.
The Structural Flaws in Traditional A/B Testing
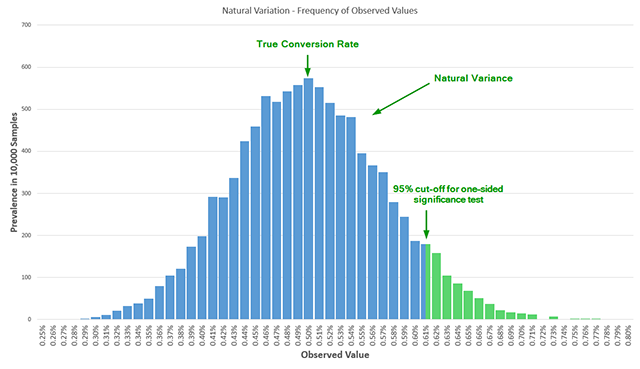
In the current digital landscape, most A/B testing literature focuses heavily on the concept of "statistical significance." However, the application of these tests—most notably the Student’s T-test—often ignores a critical constraint: the requirement to fix the sample size in advance. A statistical significance test is essentially an estimation of the probability of observing a result equal to or more extreme than the one recorded, assuming no true difference exists between the variants (the null hypothesis).
When practitioners monitor a test while it is running and make decisions based on early results, they engage in what statisticians call "data peeking" or "data-driven optional stopping." This practice introduces a significant bias. In a fixed-sample test, the error rate is calculated for a single evaluation point. If a practitioner looks at the data ten times during the experiment, they are effectively performing ten separate tests, each carrying its own risk of a false positive. Without adjusting the statistical model, the reported error rate becomes a fiction.
Supporting data illustrates the severity of this issue. Research dating back to 1969, and verified repeatedly since, shows that peeking at data just twice can more than double the actual error rate compared to the nominal or reported rate. If a practitioner peeks five times, the actual error rate is 3.2 times higher than reported; ten peeks result in an error rate five times higher than the nominal threshold. In short, a test reported at 95% confidence may actually only possess 75% or 80% confidence if peeking occurred, leading to a "Garbage In, Garbage Out" scenario where businesses implement changes based on noise rather than signal.
The Overlooked Pillar: Statistical Power and Sensitivity
While significance (Type I error) receives the most attention, statistical power (Type II error) is frequently neglected. Statistical power is the probability that a test will detect a true effect of a certain size if one actually exists. In a review of seven influential books on A/B testing published between 2008 and 2014, only one mentioned statistical power in a proper context, and even then, the coverage was superficial.
Running an underpowered test is equivalent to using a low-resolution microscope to look for bacteria; if the tool isn’t sensitive enough, the observer will conclude nothing is there, even if the sample is teeming with life. In marketing, this means failing to detect a genuine lift in conversion rates. This results in wasted time, development resources, and the potential abandonment of a viable strategy.
Power is inextricably linked to sample size. To determine the necessary sample size for a scientifically valid test, a practitioner must specify four parameters: the historical baseline conversion rate, the desired significance threshold, the desired power (usually 80% or 90%), and the Minimum Detectable Effect (MDE). Many free online calculators operate at a default power of 50%—essentially a coin toss—which is woefully inadequate for commercial applications. When proper power calculations are applied, practitioners often find that the required sample sizes are much larger than anticipated, forcing a difficult choice between the duration of the test and the certainty of the results.
Chronology of Statistical Evolution in Experimentation
To understand why A/B testing is lagging, one must look at the timeline of statistical development:
- Early 20th Century: Ronald Fisher and others develop the foundations of frequentist statistics and experimental design, primarily for agriculture and biology. These were "fixed-design" experiments where data was analyzed only after the harvest or the conclusion of the study.
- 1940s-1950s: The Neyman-Pearson framework introduces the concept of Type II errors and power, though these concepts take decades to permeate general practice.
- 1960s-1970s: Medical researchers realize that fixed-sample trials are often unethical or inefficient. If a new drug is clearly saving lives or clearly killing patients, waiting for a pre-fixed sample size to be reached is unacceptable. This leads to the development of sequential analysis and "Group Sequential Designs."
- 2000s-Present: Digital A/B testing becomes mainstream. However, the software and "best practices" adopted by the industry largely revert to the early 20th-century fixed-sample models, despite the fact that digital data accrues in real-time, much like the data in medical trials.
- 2017-Present: The introduction of the AGILE statistical method seeks to port the advancements from clinical bio-statistics into the world of Conversion Rate Optimization (CRO).
The AGILE Framework: Efficiency Through Interim Analysis
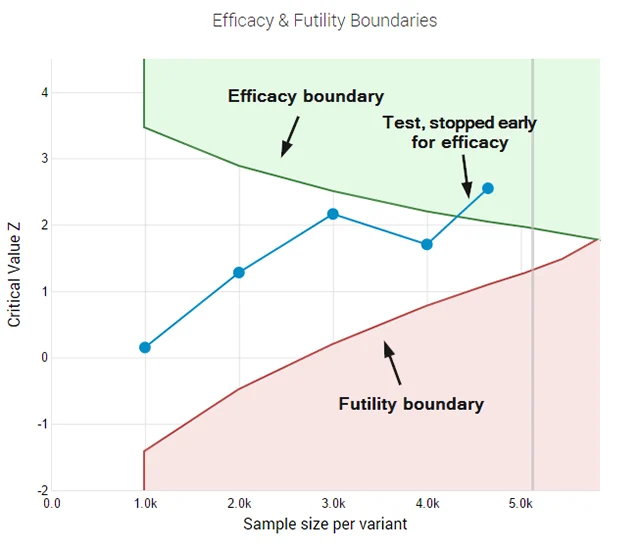
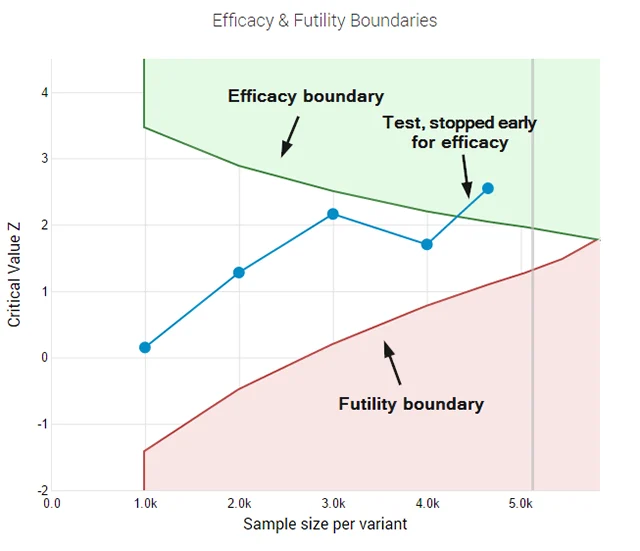
The AGILE statistical method addresses the inefficiencies of classical tests by incorporating "error-spending functions." This mathematical approach allows for the distribution of the total allowed error (Alpha) across multiple interim analyses. Instead of being restricted to one "look" at the end of the test, practitioners can check the data at various intervals—for example, after every 25% of the total sample is collected—without inflating the false positive rate.
This methodology offers three primary advantages:
- Early Stopping for Efficacy: If a variant is performing exceptionally well, the AGILE method provides a statistical "boundary" that, if crossed, allows the practitioner to stop the test early and declare a winner with full confidence. This enables businesses to realize gains much faster than a fixed-sample test would allow.
- Early Stopping for Futility: Perhaps even more valuable is the "futility stopping rule." If a variant is performing poorly or showing no signs of improvement, the test can be abandoned early. This "failing fast" approach saves time and prevents further losses, allowing the team to move on to the next hypothesis.
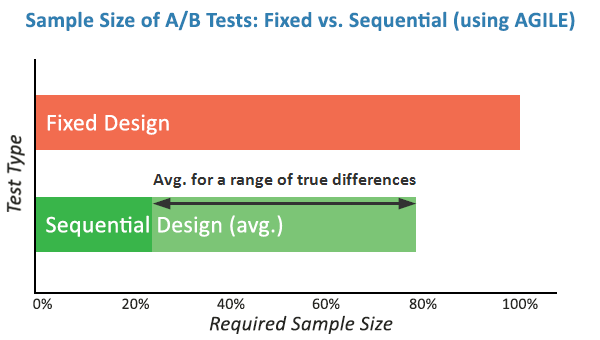
- Significant Efficiency Gains: Simulations show that the AGILE method can result in efficiency gains of 20% to 80% compared to classical fixed-sample tests. The magnitude of these gains depends on the true lift of the variant; the stronger the effect, the sooner the test can be concluded.
Industry Implications and Expert Analysis
The shift toward AGILE methodologies represents a maturing of the CRO industry. Experts in the field argue that as the "low-hanging fruit" of website optimization is picked, the remaining gains require more precise measurements. Traditional methods that ignore power or permit unadjusted peeking are no longer sufficient in a competitive landscape.
From a management perspective, the AGILE approach aligns statistical theory with business reality. Stakeholders naturally want to know how a test is performing while it is live. Instead of statisticians telling managers "you aren’t allowed to look," the AGILE method says "you can look, provided we use the correct mathematical framework to account for it." This transparency fosters better communication between data science teams and executive leadership.
Furthermore, the addition of futility rules provides a "statistical guarantee" for false negatives. In a traditional setup, if a test is stopped early because it "looks like it’s failing," there is no mathematical basis for that decision. Under AGILE, the decision to stop for futility is backed by a calculated probability, ensuring that a potentially winning idea isn’t discarded due to a temporary dip in performance.
Broader Impact and the Future of Digital Experimentation
The adoption of the AGILE statistical method has the potential to redefine the standards of digital marketing. By moving away from the "p-value hacking" and informal peeking that characterizes much of the current landscape, the industry can move toward a more ethical and financially sound model of experimentation.
The financial implications are substantial. For a high-traffic e-commerce site, reducing the time to conclude a test by 40% means 40% more experiments can be run in a year. In a field where only one out of five or one out of ten tests typically yields a positive result, increasing the "velocity" of testing is the most direct path to increasing total annual revenue lift.
As machine learning and automated experimentation platforms become more prevalent, the underlying statistical engine will become the primary differentiator between successful and unsuccessful optimization programs. The AGILE method provides the necessary bridge, ensuring that the speed of digital business does not come at the expense of scientific truth. Ultimately, those who embrace these modern statistical practices will enjoy a significant competitive advantage, characterized by faster iterations, more reliable results, and a deeper understanding of user behavior.