 Lina Hope

The global digital landscape has reached a point of saturation where the mere acquisition of traffic no longer guarantees commercial success; instead, the focus has shifted toward the granular optimization of user experience (UX) and conversion rate optimization (CRO). Central to this shift is the deployment of heatmap tools, sophisticated software that translates complex user interaction data into visual, color-coded representations of engagement. As organizations seek to minimize friction in the customer journey, the selection of a heatmap provider has become a strategic decision involving considerations of data retention, privacy compliance, and integrated testing capabilities.

The Strategic Importance of Visual Analytics
In the current data-driven economy, businesses are increasingly moving away from anecdotal evidence in favor of empirical behavioral data. Heatmap tools provide a window into the "why" behind user actions, moving beyond the "what" provided by traditional platforms like Google Analytics. By recording clicks, scrolls, and mouse movements, these tools allow stakeholders to identify "dead zones" where users lose interest or "friction points" where technical errors or poor UI design impede progress.
Industry data suggests that the conversion rate optimization market is poised for significant growth, driven by the increasing cost of customer acquisition (CAC). As digital advertising costs rise, the ability to convert a higher percentage of existing traffic becomes a primary lever for profitability. Heatmap tools serve as the diagnostic foundation for this process, allowing for the identification of high-impact changes that can be validated through subsequent A/B testing.
Chronology of Heatmap Evolution
The evolution of heatmap technology has mirrored the broader development of the web. In the mid-2000s, the first generation of tools, pioneered by companies like Crazy Egg (founded in 2006), introduced the concept of the "confetti" report, which segmented clicks by referral source. This was a revolutionary departure from the aggregate data of the era.
By the mid-2010s, the market saw the emergence of "Session Replay" technology. Providers like Hotjar and Fullstory began offering the ability to play back individual user sessions like a video, providing unprecedented context to the heatmaps. The late 2010s and early 2020s marked the "Enterprise Era," where tools like Glassbox and Contentsquare began integrating AI-driven insights and friction scores to automatically highlight anomalies in massive datasets.

The most recent disruption occurred in 2020 with the launch of Microsoft Clarity. By offering a robust, completely free heatmap and session recording tool without traffic limits, Microsoft forced a recalibration of the market, pushing paid providers to offer more integrated features, such as built-in A/B testing and advanced product analytics, to justify their subscription costs.
Comprehensive Analysis of Leading Market Solutions
Crazy Egg: The Integrated CRO Ecosystem
Crazy Egg remains a dominant force by positioning itself as a comprehensive optimization suite rather than a standalone heatmap tool. Its primary value proposition lies in the seamless transition from data collection to experimentation. Once a heatmap identifies a problematic element, users can launch an A/B test directly within the platform.

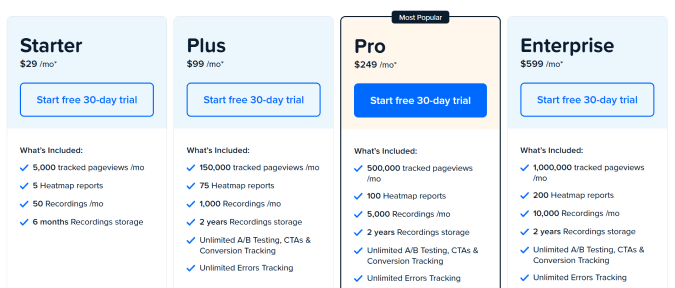
- Key Metrics: Paid plans start at $29 per month for 5,000 tracked pageviews.
- Data Retention: Ranges from six months to two years, depending on the tier.
- Strategic Advantage: It offers five distinct views—Heatmap, Scrollmap, Confetti, Overlay, and List—providing a multi-dimensional view of user intent.
Microsoft Clarity: The Democratic Disruptor
Microsoft Clarity has fundamentally changed the barrier to entry for behavioral analytics. By providing unlimited sessions and heatmaps for free, it has become the standard for small businesses and individual creators.
- Data Privacy: It is GDPR and CCPA compliant, though it utilizes anonymized data to improve Microsoft’s broader AI models.
- Unique Features: The platform uses machine learning to identify "rage clicks" and "excessive scrolling," providing immediate alerts to UX designers regarding potential site failures.
Hotjar and Contentsquare: The Enterprise Standard
Following Contentsquare’s acquisition of Hotjar, the combined entity serves a broad spectrum of the market, from mid-market firms to global enterprises. Hotjar is noted for its ease of use and qualitative feedback tools, such as on-site surveys and sentiment tracking.

- Scale: The platform can handle millions of sessions, making it suitable for high-traffic e-commerce environments.
- Integration: It offers deep integration with Slack, Zapier, and Google Optimize, allowing for automated workflows between data discovery and team action.
Mouseflow: The Friction Specialist
Mouseflow distinguishes itself through its focus on "Friction Scores." It automatically categorizes sessions where users experience difficulties, such as broken links or slow-loading elements.
- Form Analytics: Unlike basic heatmap tools, Mouseflow provides detailed reports on where users drop off in lead generation forms, a critical metric for B2B organizations.
Glassbox and Fullstory: Product Analytics and Regulated Industries
For organizations in the banking, insurance, or healthcare sectors, data security is paramount. Glassbox offers "tagless" data capture and robust mobile SDKs, allowing for the tracking of native iOS and Android applications with the same precision as web properties. Fullstory similarly focuses on "Product Intelligence," helping SaaS companies understand how users interact with complex application dashboards.

Technical Considerations and Comparative Data
When selecting a tool, technical stakeholders must evaluate the impact of the software on site performance and legal compliance.
| Feature | Crazy Egg | Microsoft Clarity | Mouseflow | Hotjar |
|---|---|---|---|---|
| Pricing Model | Tracked Pageviews | Free | Sessions | Sessions |
| A/B Testing | Built-in | No | No | Via Integration |
| Mobile SDK | No (Web only) | Yes | No | No |
| Max Retention | 24 Months | 13 Months (Fav) | 12 Months | 13 Months |
Data Accuracy and Sampling: A common challenge in heatmap analysis is data sampling. Some tools only record a small percentage of total traffic to save on processing costs. Analysts suggest that for a heatmap to be statistically significant, a page should have a minimum of 1,000 to 2,000 pageviews. High-traffic providers like Crazy Egg track 100% of pageviews on selected pages, ensuring that the visual representation is not skewed by a non-representative sample.

Data Privacy and Global Compliance
The implementation of any behavioral tracking tool must be viewed through the lens of the General Data Protection Regulation (GDPR) and the California Consumer Privacy Act (CCPA). Leading heatmap providers have responded by implementing "masking" technologies. This ensures that sensitive user information—such as credit card numbers, passwords, and personal identifiers—is redacted at the browser level before the data ever reaches the provider’s servers.
Furthermore, the physical location of data storage has become a point of contention for legal teams. European firms often require data to be stored on servers located within the EU. Providers like Mouseflow and Hotjar offer specific data residency options to meet these stringent requirements, whereas US-based tools may require additional Data Processing Agreements (DPAs).

Impact on Industry Roles and Decision Making
The proliferation of these tools has redefined several key professional roles:
- UX Designers: Now rely on "scrollmaps" to determine where to place critical information, ensuring that key messages are not lost "below the fold."
- Marketing Managers: Use "confetti maps" to determine which ad campaigns drive the most engaged traffic, rather than just the most clicks.
- Developers: Monitor "rage clicks" to identify bugs that automated testing might have missed.
The broader implication is the democratization of data. Previously, complex behavioral analysis required a dedicated data science team. Modern heatmap tools have moved this capability into the hands of product managers and marketers, shortening the feedback loop between observation and optimization.

Future Implications: AI and Predictive Heatmaps
The next frontier for heatmap technology lies in predictive analytics. Emerging startups are beginning to use neural networks to predict where users will look and click before a page is even launched. By training AI on millions of existing heatmaps, these tools can provide an "instant" heatmap of a design mockup.
However, industry experts maintain that while AI can predict general human behavior, it cannot replace the real-world data captured from a specific audience. The integration of AI within tools like Microsoft Clarity and Fullstory currently focuses on "summarization"—taking thousands of hours of session recordings and providing a text-based summary of the primary user obstacles.

Conclusion for Stakeholders
The selection of a heatmap tool should be dictated by the specific "next step" an organization needs to take. If the goal is purely diagnostic and budget is a primary concern, Microsoft Clarity offers an unparalleled free solution. However, for organizations looking to drive measurable revenue growth through experimentation, integrated platforms like Crazy Egg provide the necessary tools to not only see the problem but also test and implement the solution. As the digital landscape continues to evolve, the ability to visualize and react to user behavior will remain a cornerstone of competitive digital strategy.

 Ammar Sabilarrohman

 Sagoh