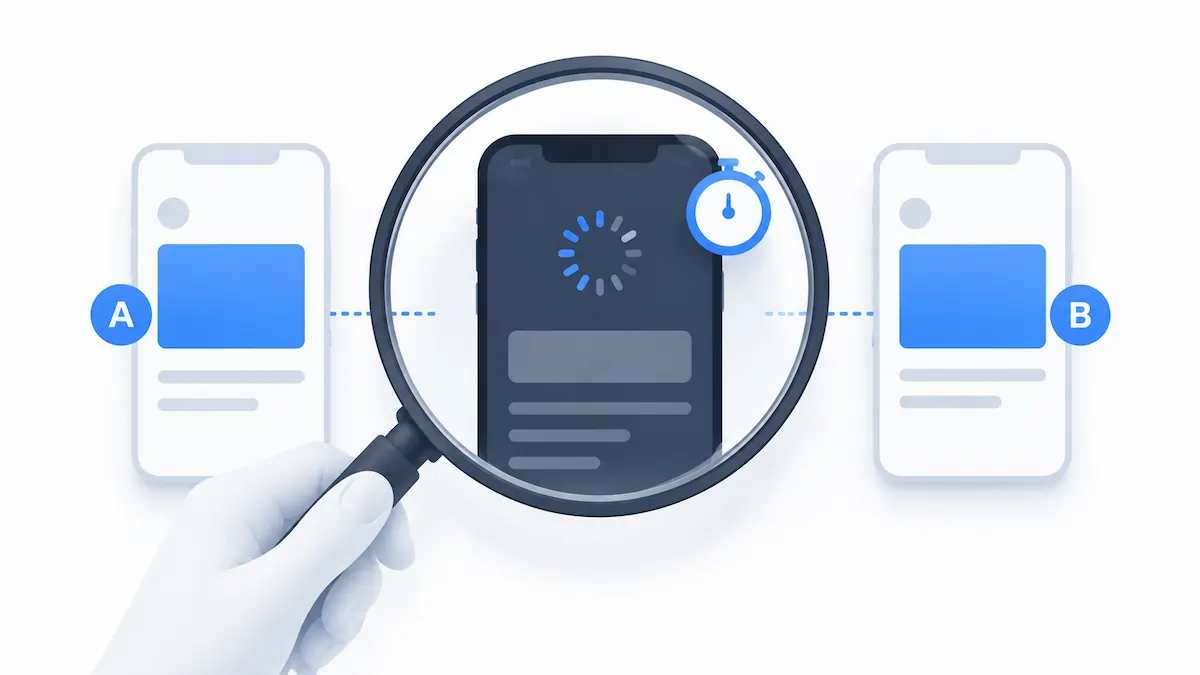
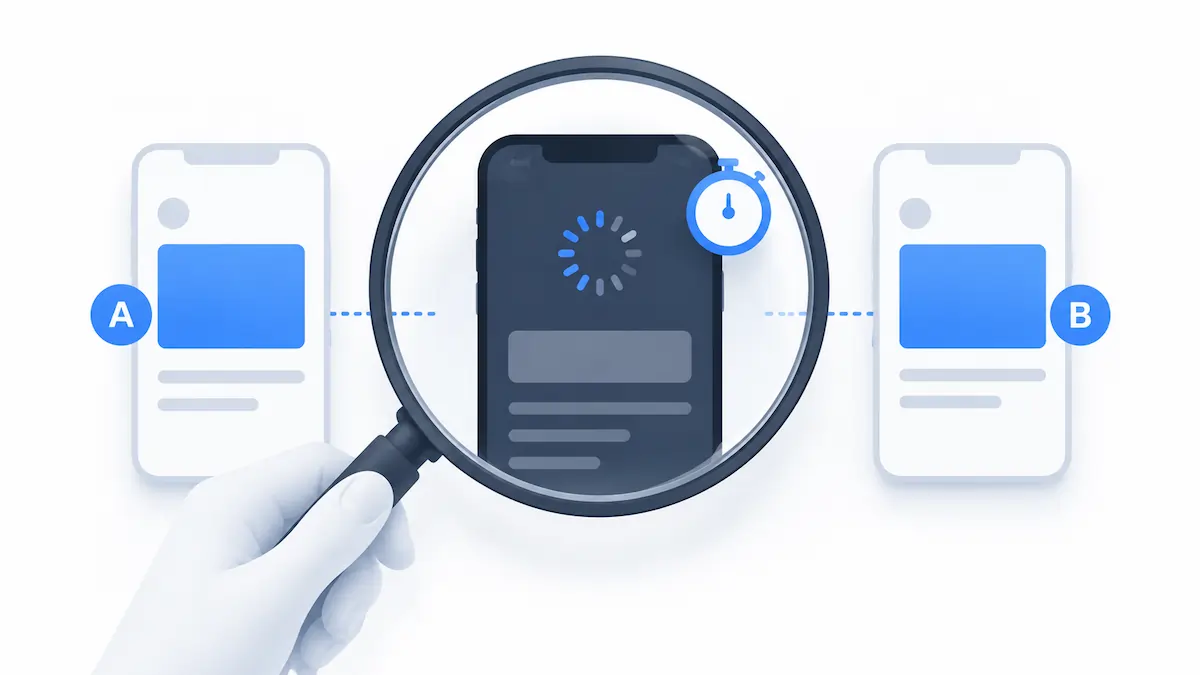
The phenomenon of data mismatch between A/B testing platforms and web analytics suites is a long-standing challenge for conversion rate optimization (CRO) specialists and data analysts. In the contemporary digital ecosystem, where Google Analytics 4 (GA4) has become the industry standard, the discrepancy between the numbers reported by a testing tool and those recorded in GA4 remains a persistent source of friction. While a minor variance is often dismissed as a statistical quirk, significant gaps—sometimes exceeding 10% or 15%—can undermine the integrity of an entire experimentation program. Understanding the technical, environmental, and behavioral drivers of these discrepancies is essential for any organization relying on data to drive business decisions.
The Foundation of Data Variance: Synchronous vs. Asynchronous Execution
To understand why data rarely aligns, one must first examine the fundamental architecture of how tracking scripts are executed within a visitor’s browser. Most A/B testing tools, such as Convert Experiences, are designed to fire their scripts synchronously. This means the script is placed high in the <head> tag of a website’s HTML and executes the moment the page begins to load. This synchronous execution is vital for A/B testing to prevent "flickering"—the jarring experience where a visitor sees the original version of a page for a split second before the variation is applied.
In contrast, Google Analytics 4 is built on an asynchronous framework. To prioritize user experience and page load speed, GA4 loads in the background. It waits for the browser to allocate resources before firing its events. While this is beneficial for Core Web Vitals and general site performance, it creates a "timing window" of vulnerability. If a user has a slow connection or a low-powered device, the A/B testing tool may log the visitor and apply the variation, but the visitor may navigate away or close the tab before the GA4 script has had the opportunity to fire its initial page_view event.
The Five Percent Rule and the Need for Investigation
Industry experts, including veteran optimizer Ryan Levander, have long suggested a rule of thumb for data monitoring: if bottom-of-funnel conversion tracking—such as purchases, lead generations, or trial sign-ups—differs by more than 5% between two systems, an investigation is warranted. However, identifying the root cause is rarely straightforward.
Initial troubleshooting typically focuses on configuration errors. Analysts often look for issues within Google Tag Manager (GTM) triggers, event naming conventions, dimension scopes, or consent banner settings. Other common suspects include attribution model differences, bot filters, GA4’s internal sampling and thresholding, and the increasing prevalence of ad blockers and cookie rejection. While these factors are significant, research conducted by the Convert team over a two-year period suggests that the most overlooked culprit is the intersection of network conditions and device performance.
The Impact of Global Network Infrastructure
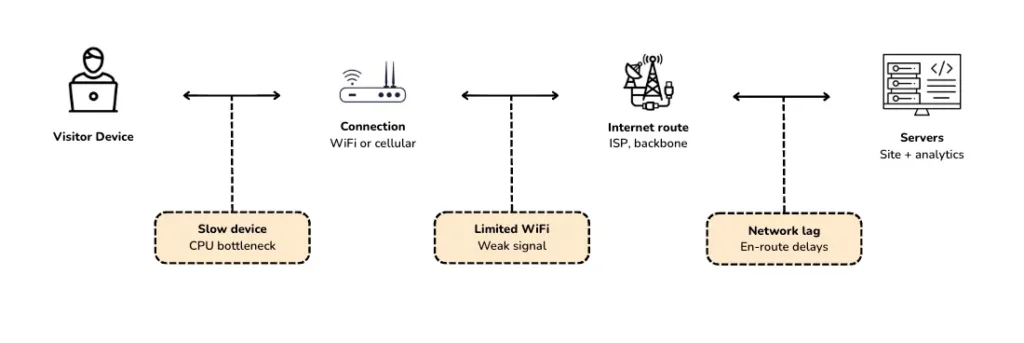
Despite the global push toward 5G connectivity, the reality of mobile internet remains inconsistent. Data from RCR Wireless indicates that as of 2025, only about half of mobile connections in the United States are on 5G networks. Furthermore, reports from Opensignal highlight that even users with 5G-capable devices and plans often spend significant time on LTE or 4G networks due to signal fluctuations.
When a visitor accesses a site via a congested public WiFi network or a weak cellular signal, the browser’s ability to process JavaScript is severely throttled. In these "slow-network" environments, the GA4 analytics beacon may be delayed, partially delivered, or dropped entirely. The A/B testing script, by virtue of its synchronous and early placement, is much more likely to record the interaction before the network bottleneck prevents the analytics tool from doing the same.
Research Findings: The 20-Second Delay and Funnel Signatures
Through intensive debugging of dozens of live customer sites, researchers identified three distinct patterns that explain GA4’s data loss under suboptimal network conditions.

First is the "20-Second First-Pageview Delay." In controlled tests simulating slow 3G or 4G environments, it was observed that GA4’s initial page_view event frequently fired 20 seconds or more after the page began loading. For a typical user, 20 seconds is an eternity; many visitors will have already skimmed the content and exited the site. In these instances, the A/B testing tool logs a participant, but GA4 never records the session. This is the primary driver of the "visitor gap" in experimental data.
Second is the "Funnel Shape Signature." If data loss were random, discrepancies would be uniform across the entire conversion funnel. However, the research showed that the largest gaps occur at the very beginning (funnel entry) and the very end (final conversion). The middle of the funnel—events like "view product" or "add to cart"—often shows much higher alignment. This occurs because any visitor who reaches the middle of the funnel has, by definition, stayed on the site long enough for the initial loading bottleneck to clear. GA4 ties all subsequent events to a successful initial page_view. If that first event fails, the entire session and all downstream conversions are erased from GA4, even if they are captured by the testing tool’s server-side integrations.
Third is the "GTM Window Loaded Trap." A common piece of advice for improving site performance is to set GTM tags to fire on "Window Loaded" rather than "Page View." While this improves lighthouse scores, it significantly increases the risk of data loss. By waiting for every image and sub-resource to load before firing analytics, companies effectively volunteer to lose data from every visitor on a slow connection.

A Systematic Framework for Diagnosing Mismatches
To resolve or account for these discrepancies, organizations should follow a rigorous seven-step diagnostic process:
- Metric Alignment: Ensure the comparison is between "Users" in GA4 and "Visitors" in the testing tool. Comparing "Sessions" to "Visitors" is a fundamental error, as a single visitor can initiate multiple sessions, leading to an artificial gap.
- Experimental Segmentation: Use GA4 integrations to filter reports specifically for visitors exposed to an experiment. Comparing an experiment’s specific audience to the total site traffic in GA4 is a frequent cause of perceived mismatches.
- Temporal Consistency: Align date ranges and time zones precisely. Furthermore, because GA4 can take up to 72 hours to fully process and populate data, analysts should avoid drawing conclusions from the most recent three days of a test.
- Device and Network Analysis: Segment GA4 reports by device category. If the discrepancy is negligible on desktop but substantial on mobile, network latency and device processing power are the confirmed culprits.
- Tag Trigger Audit: Review GTM configurations. If the GA4 tag is firing on any trigger later than "Page View," it should be moved up to minimize the window for data loss.
- Funnel Shape Comparison: Analyze the percentage gap at each stage of the journey. A "top-and-bottom" heavy gap confirms network-related loss, while a uniform gap across all stages suggests a fundamental configuration or logic error.
- Server-Side Cross-Referencing: Use backend CRM or database records as a "source of truth." If the testing tool’s conversion counts align more closely with the backend than GA4 does, it confirms that the analytics tool is suffering from client-side drop-off.
Broader Implications for Digital Strategy
The persistence of this data gap has significant implications for how organizations interpret "data-driven" insights. If an A/B test shows a 10% lift in the testing tool but only a 2% lift in GA4, which number should the executive team trust?
The reality is that neither tool is "wrong"; they are simply measuring different things under different constraints. The A/B testing tool is measuring the effect of a change on every person who saw it. GA4 is measuring the effect of that change on the subset of people whose devices and networks were fast enough to be tracked.

For high-stakes decisions, the trend and the "direction of travel" are more important than the absolute decimal points. If both tools show a positive trend, the experiment is likely a success. However, if the tools contradict each other in direction, the network-loss signature must be investigated to ensure that the "winner" isn’t simply a variation that performs better on slow devices—a factor that might be invisible in a truncated GA4 dataset.
As the web moves toward more privacy-centric and restricted tracking environments, the reliance on client-side JavaScript for all data needs is becoming increasingly risky. Organizations are increasingly turning to server-side GTM and server-to-server API integrations to bypass the limitations of the browser. By moving the tracking of critical conversions to the server, companies can eliminate the "network-loss" variable entirely, ensuring that every purchase or lead is recorded, regardless of whether the visitor was on a 5G network or a congested coffee shop WiFi. Until such systems are universal, the 5-15% "normal" gap remains a necessary reality for digital analysts to navigate.


 Asro
Asro
 Dwi Wanna