

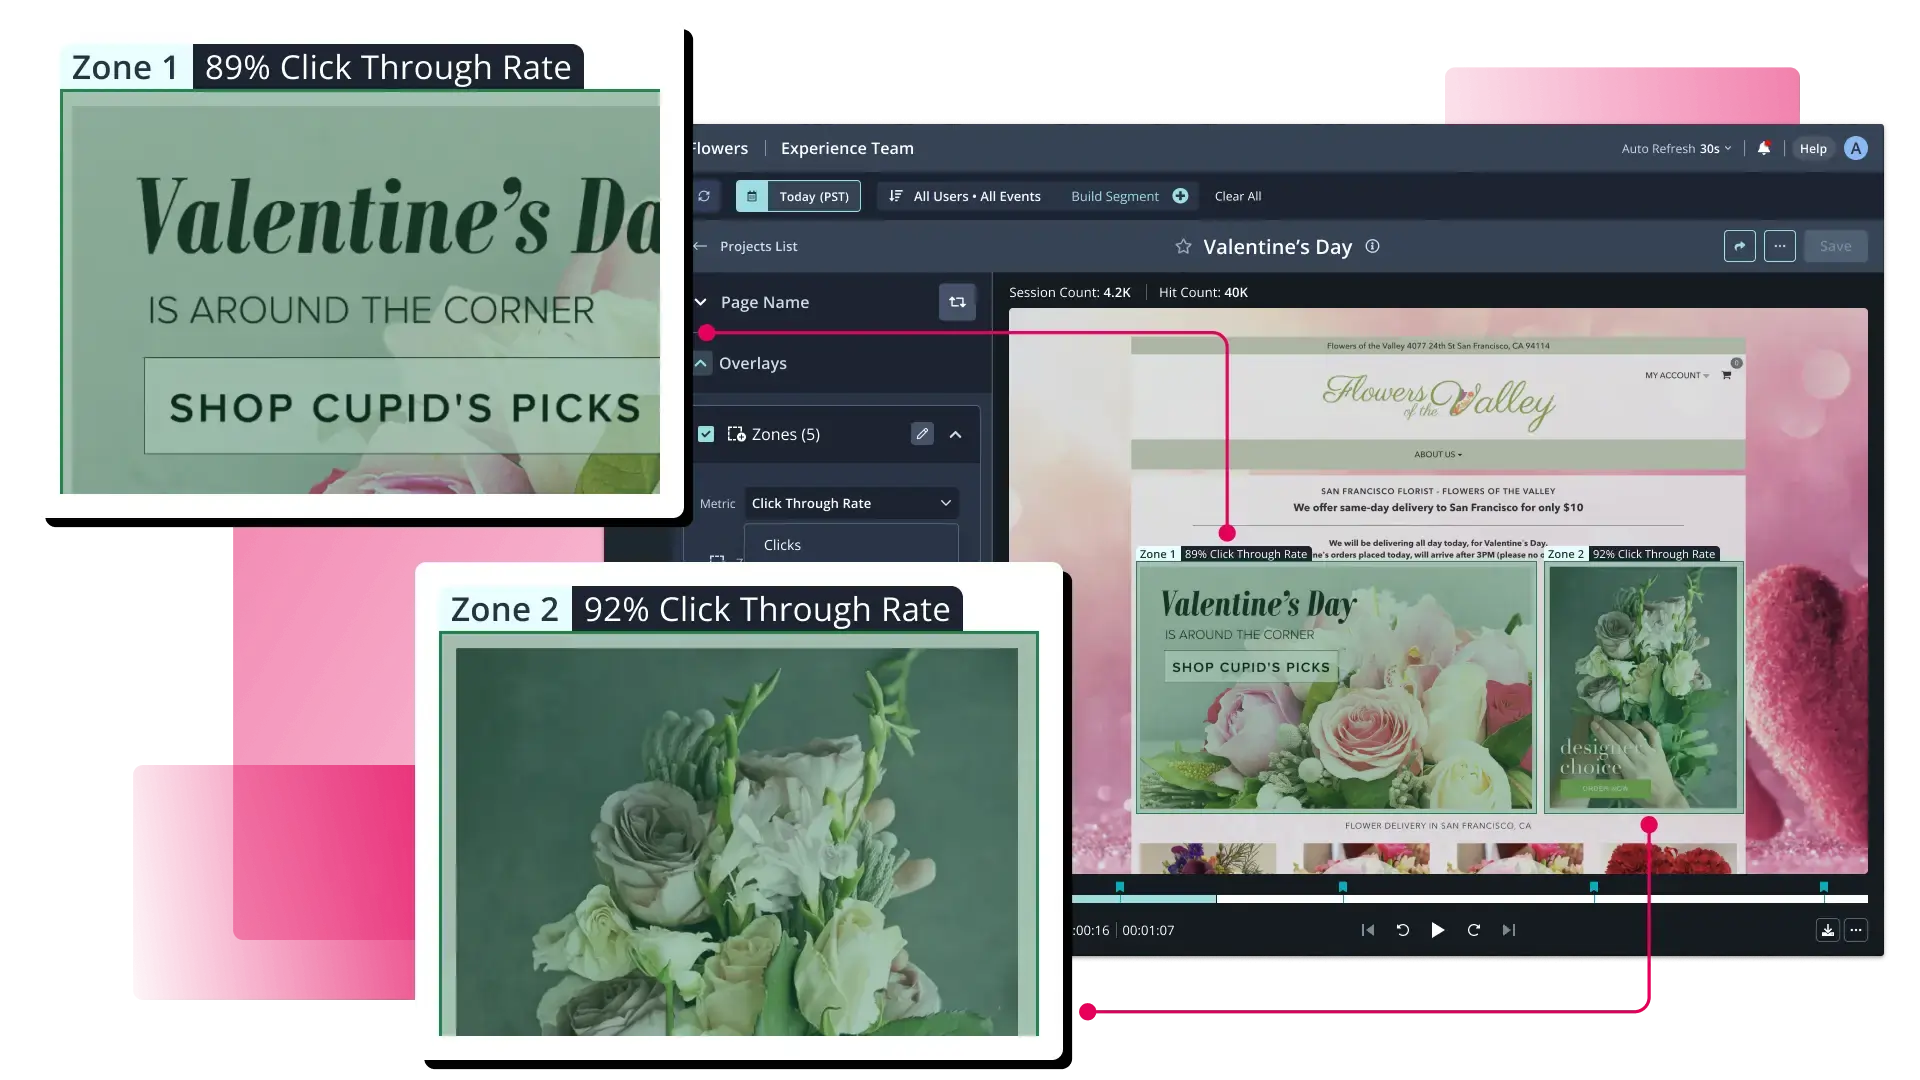
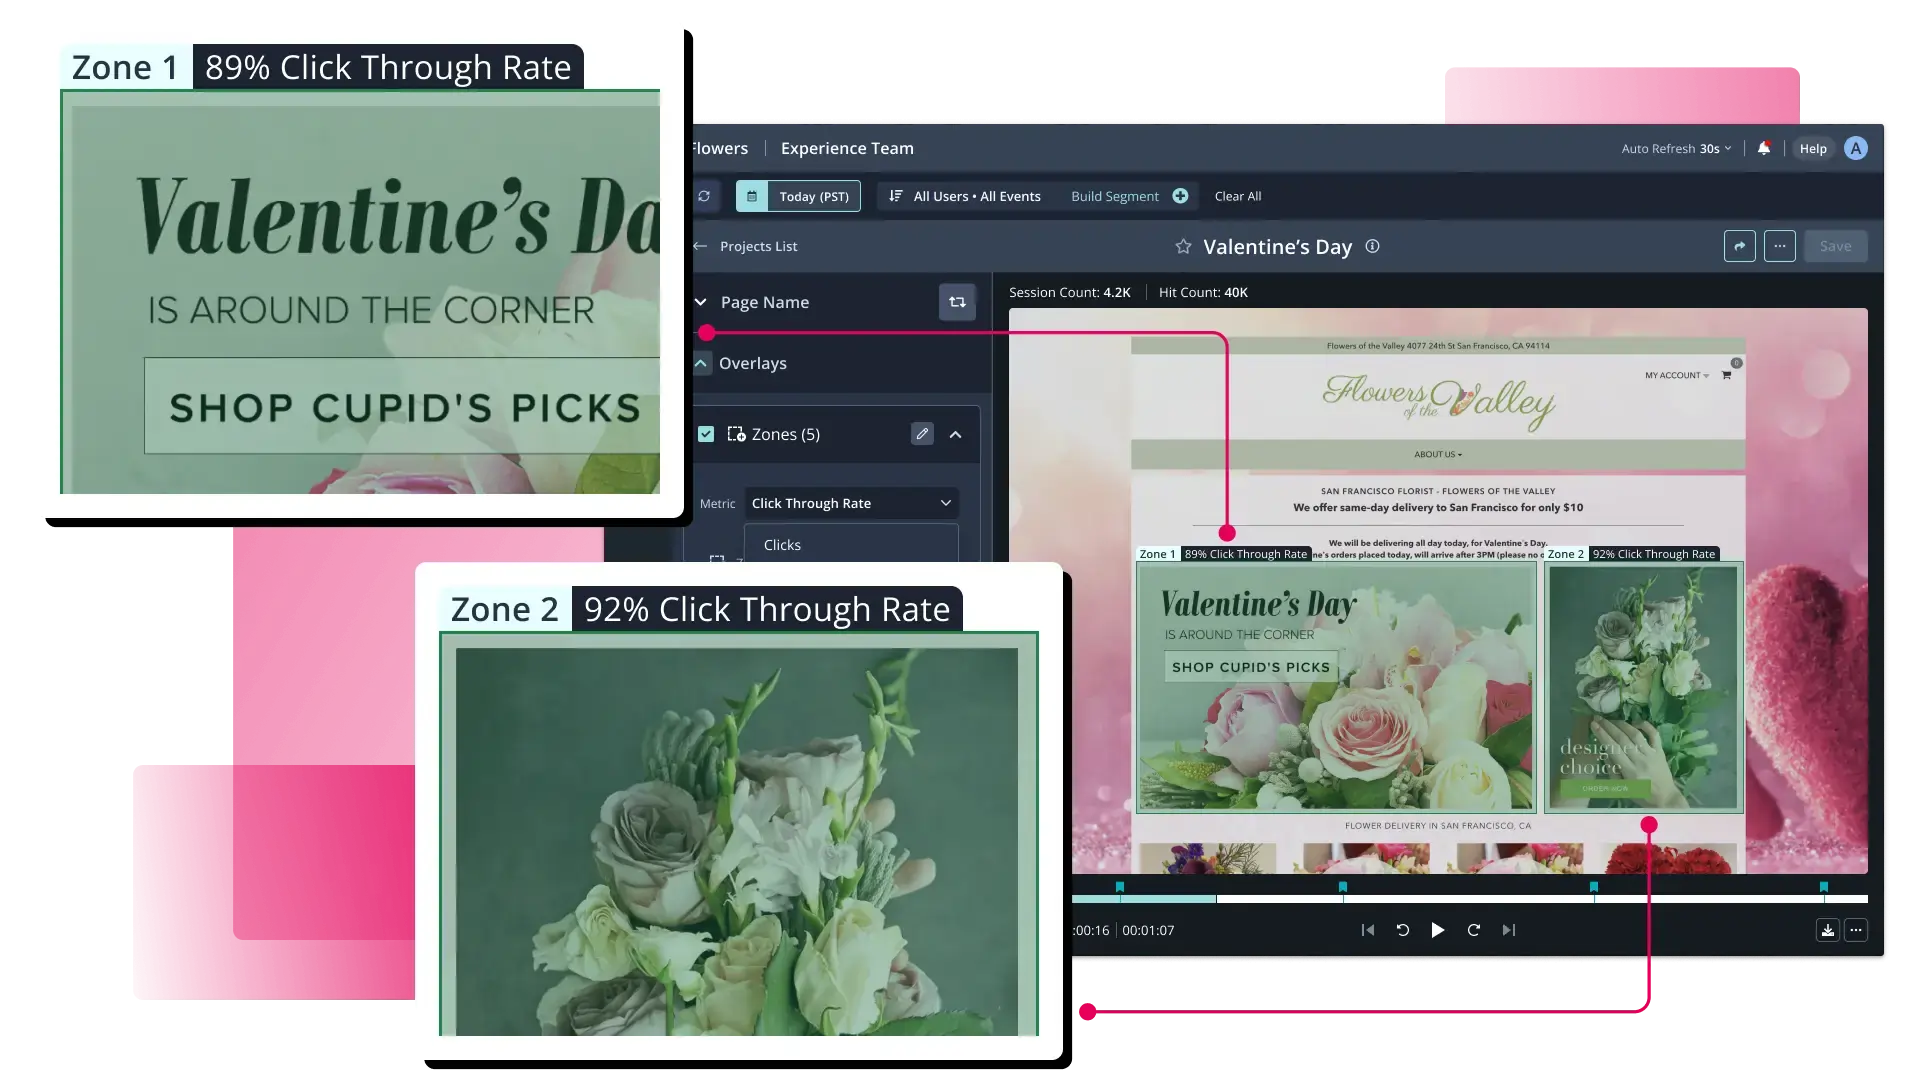
The digital landscape of 2025 has seen a significant shift in how enterprises approach user experience (UX) and conversion rate optimization (CRO), moving away from static analytics toward dynamic, behavioral-driven insights. As global e-commerce competition intensifies, the role of heatmapping software has evolved from a supplementary visual aid into a critical component of the modern tech stack. Industry data indicates that organizations leveraging behavioral analytics alongside traditional A/B testing can see conversion uplifts of up to 25%, as these tools provide the "why" behind user drop-offs that standard metrics often fail to capture. This guide examines the leading heatmapping solutions currently dominating the market, analyzing their technical capabilities, economic impact, and the recent consolidation of major industry players.
The Evolution of Behavioral Analytics: A 2025 Market Overview
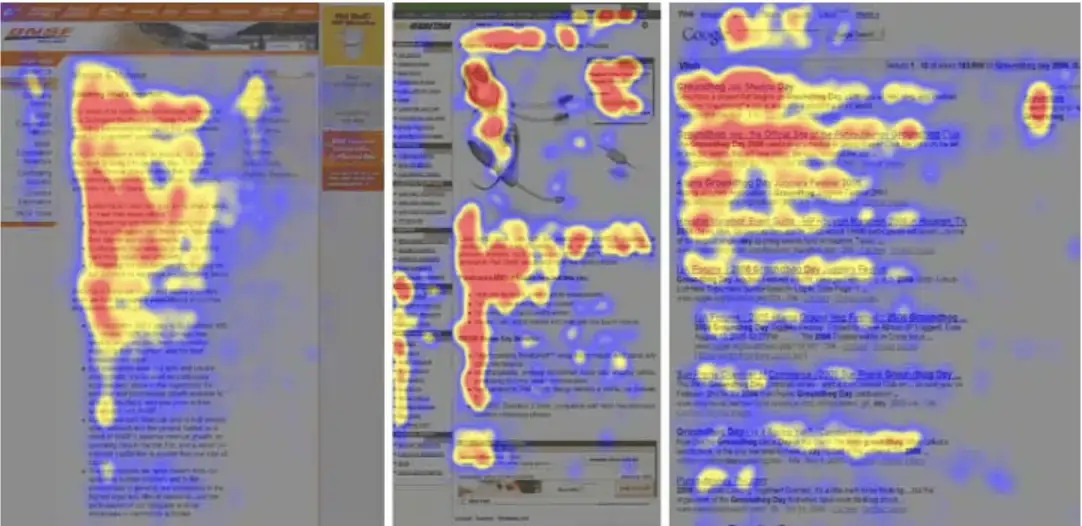
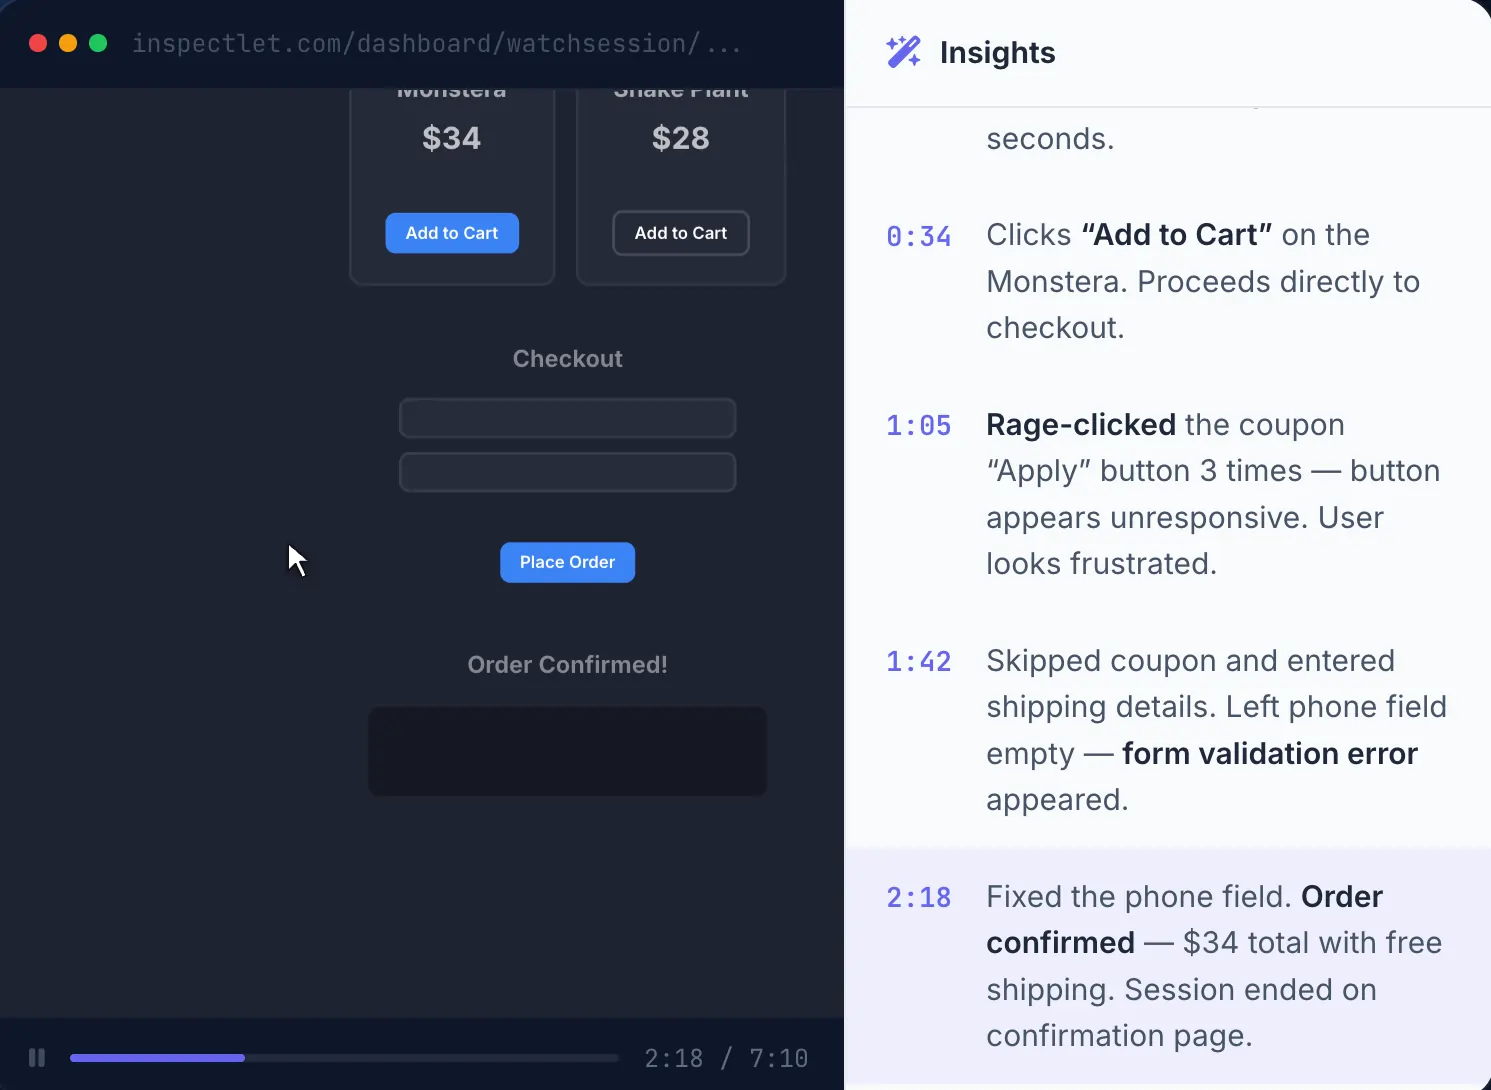
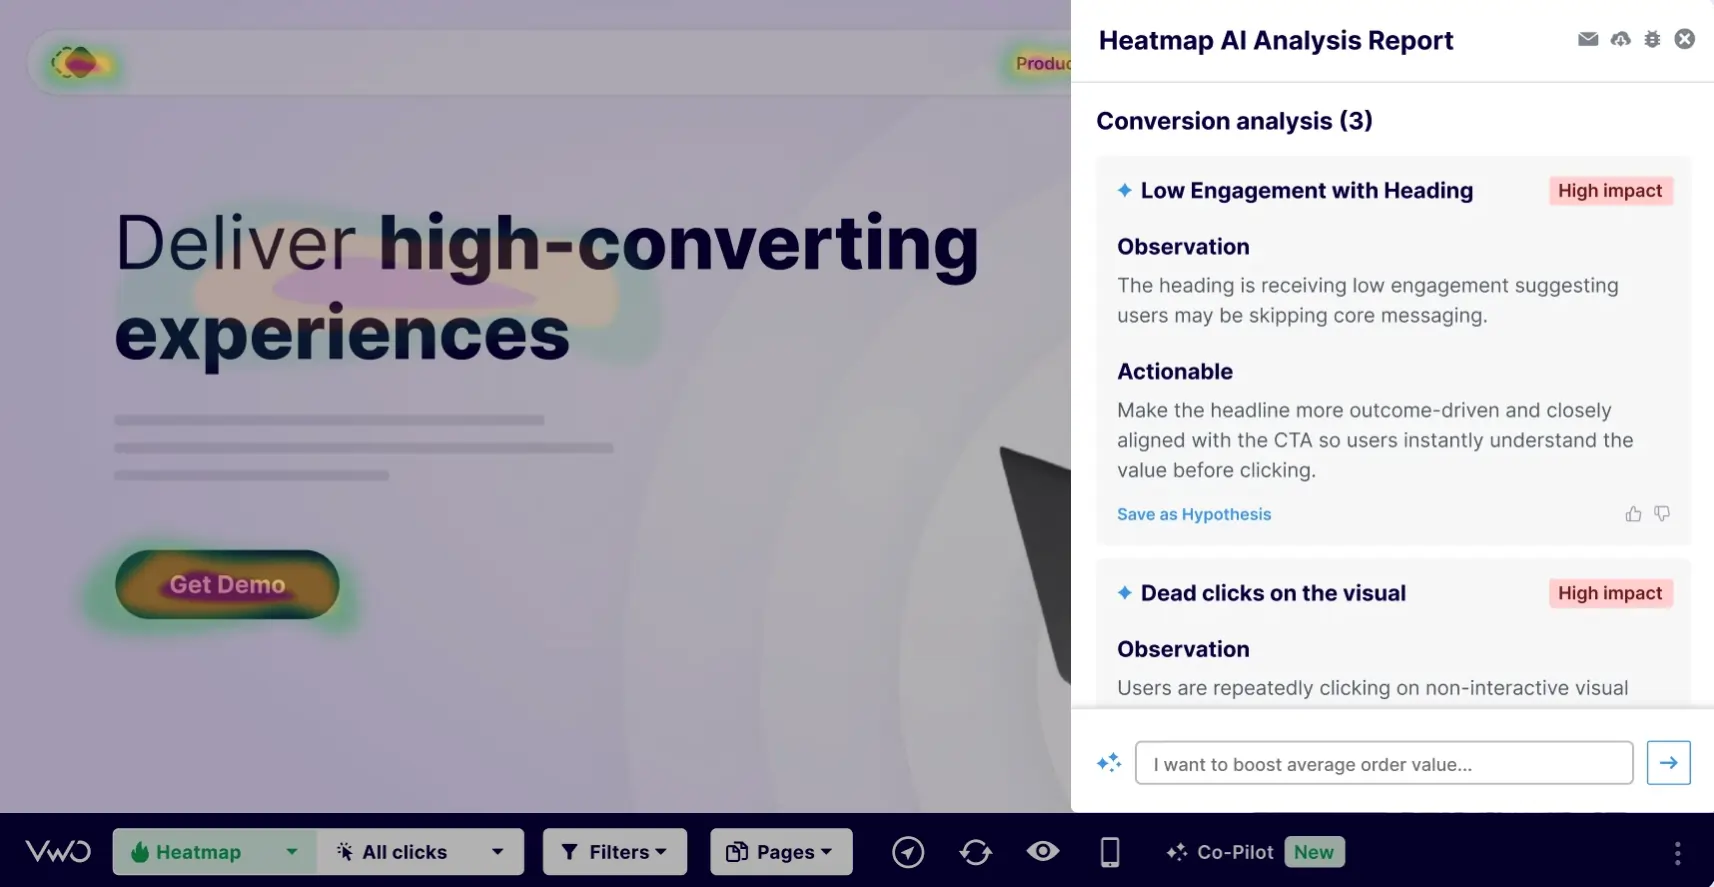
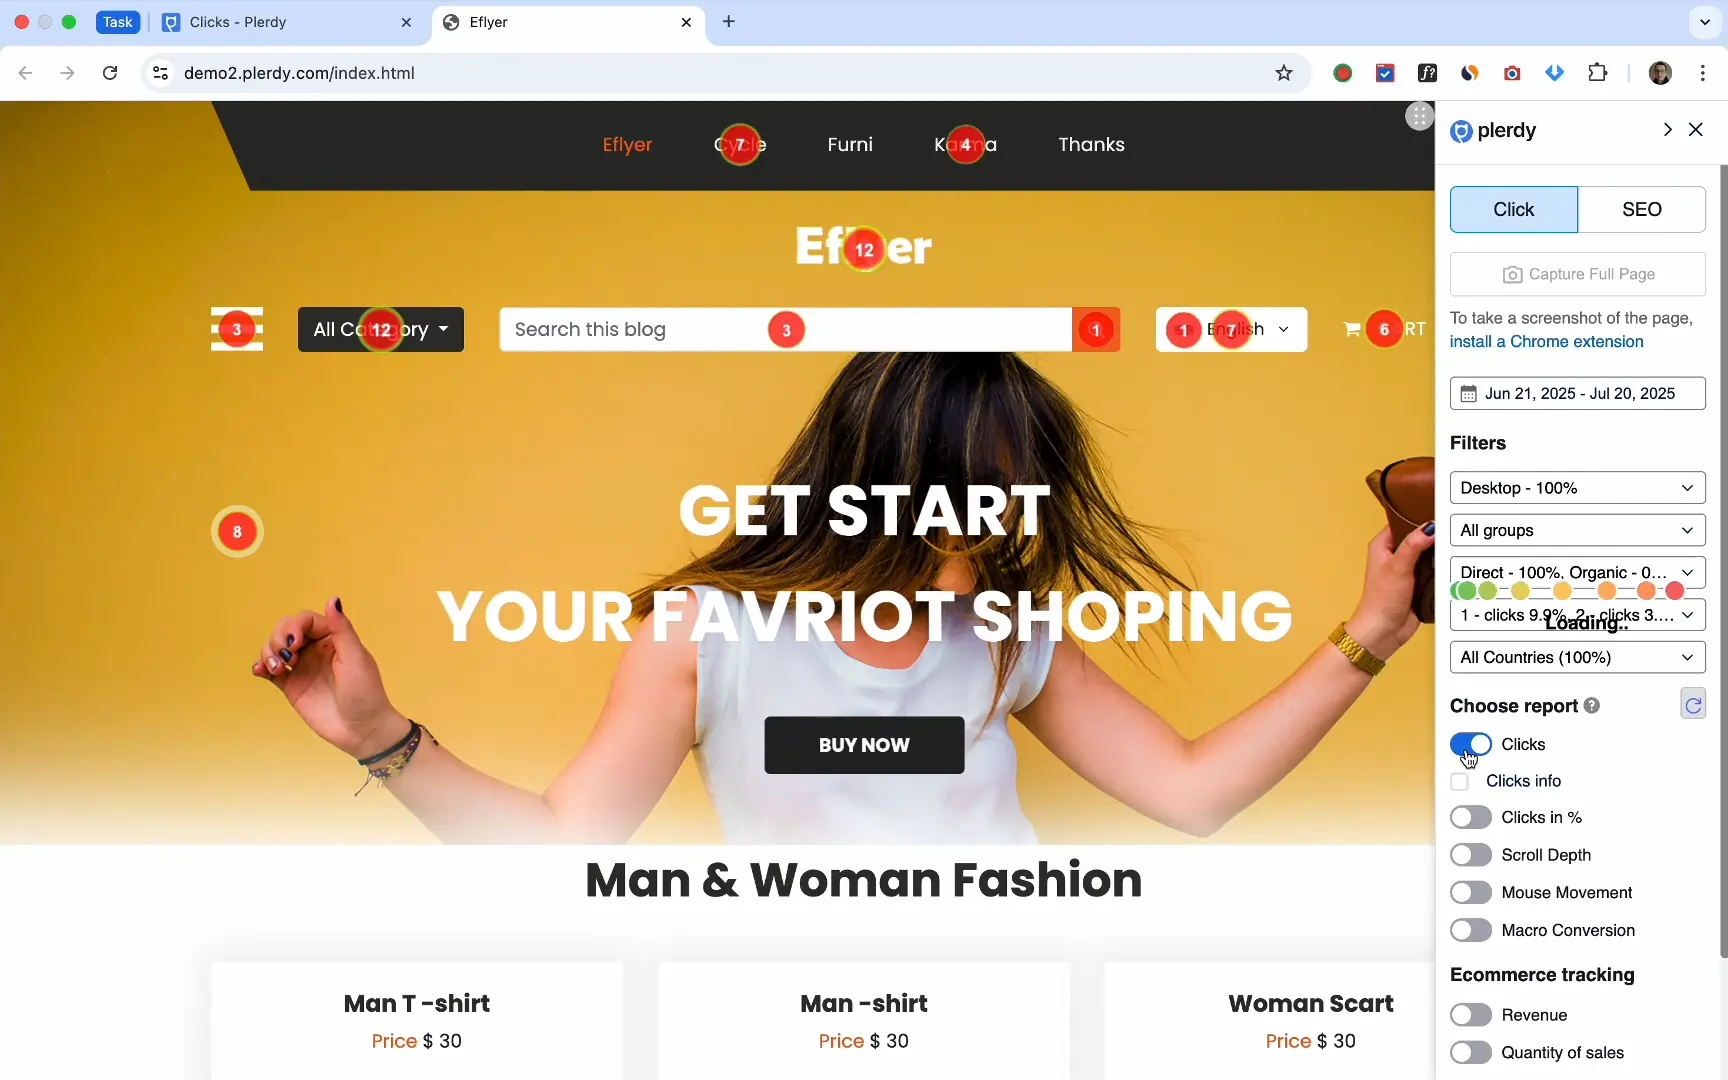
The history of heatmapping in digital commerce began with rudimentary click-tracking scripts in the early 2000s, but the technology has undergone a radical transformation over the last two decades. By 2015, the introduction of session replays allowed researchers to view individual user journeys. By 2020, AI-driven frustration detection—identifying "rage clicks" and "dead clicks"—became the industry standard. Today, in 2025, the market is characterized by "revenue-based heatmapping" and "all-in-one" experimentation platforms that merge qualitative data with quantitative testing.
One of the most significant shifts occurred in July 2025, when Hotjar, a long-time leader in the mid-market segment, fully integrated its operations into its parent company, Contentsquare Group. This merger reflects a broader industry trend: the consolidation of point solutions into comprehensive Digital Experience Intelligence (DXI) platforms. This move has forced competitors to innovate rapidly, leading to the emergence of native heatmapping within A/B testing platforms like Convert Experiences and the rise of high-performance free tools like Microsoft Clarity.
Comprehensive Comparison of Market Leaders
The current market offers a spectrum of tools ranging from free, entry-level scripts to enterprise-grade suites costing thousands of dollars per month. The following table outlines the primary contenders in the 2025 landscape:
| Product | Starting Price (Billed Annually) | Free Trial | Key Differentiators |
|---|---|---|---|
| Convert Experiences | $299/mo | 15 Days | Native heatmaps per variation; Signals® frustration detection |
| Glassbox | Custom Quote | No | Enterprise funnel analytics; automatic interaction capture |
| Quantum Metric | Custom Quote | No | Felix AI insights; 300+ out-of-the-box metrics |
| Microsoft Clarity | Free | N/A | Google Analytics integration; no traffic limits |
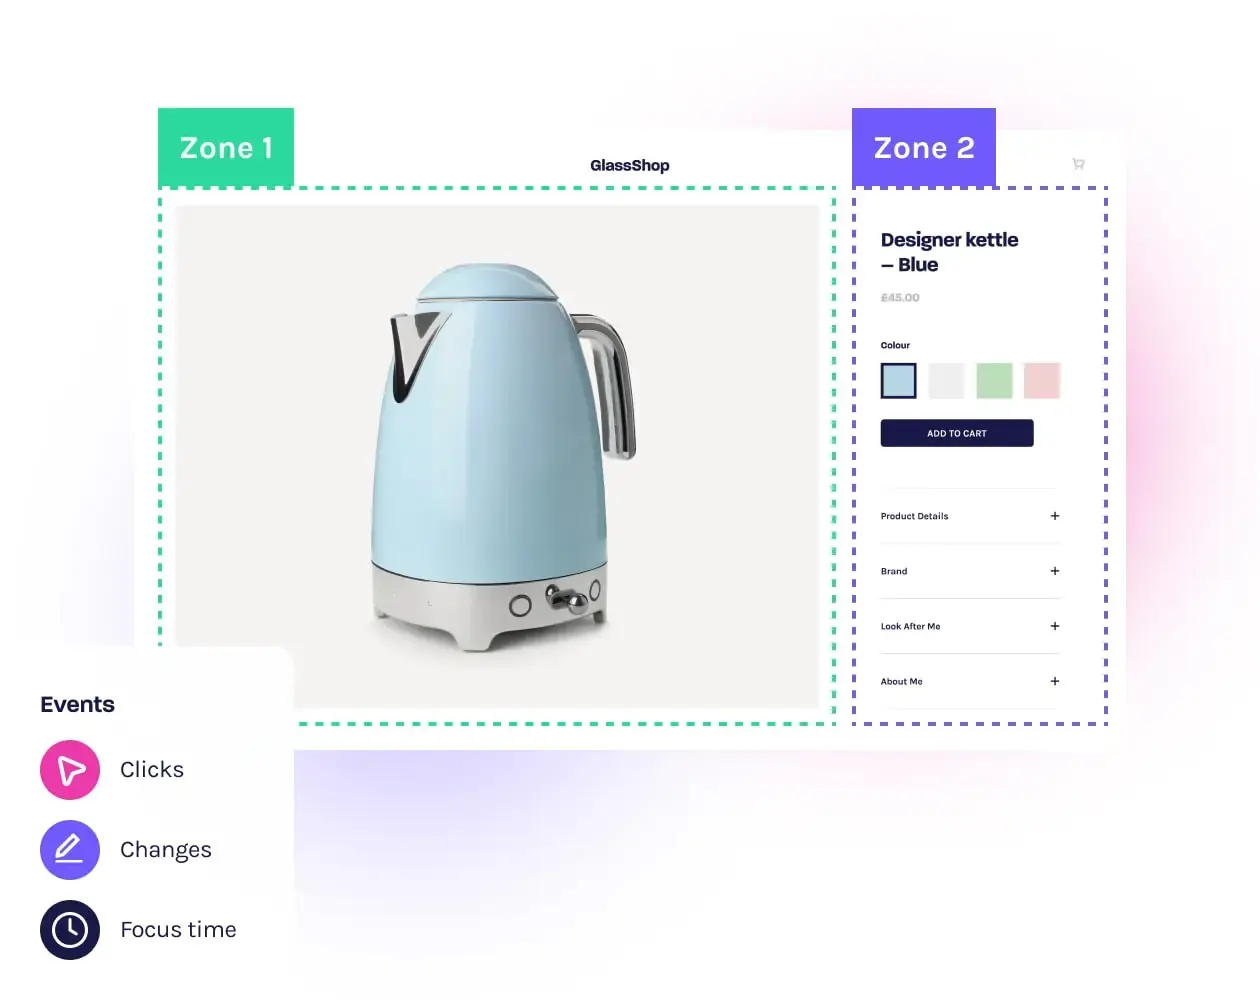
| Heatmap.com | $20/mo | 14 Days | Revenue-per-session (RPS) attribution for every element |
| Mouseflow | $25/mo | 14 Days | 12-month data retention; form abandonment analytics |
| Contentsquare | $39/mo | No | Integrated Hotjar features; voice-of-customer surveys |
Enterprise Solutions and Technical Innovations
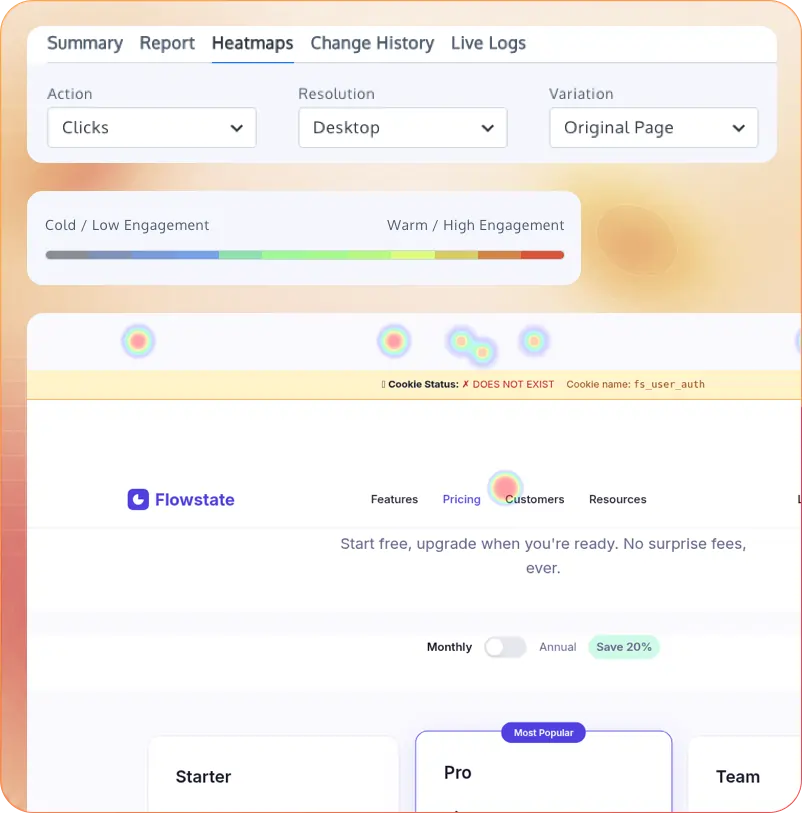
For large-scale organizations, the focus has shifted toward "frustration detection" and AI-assisted analysis. Convert Experiences has addressed a common pain point for CRO agencies—the "tool fatigue" caused by switching between testing platforms and behavioral tools. By integrating native heatmaps directly into the experiment reporting tab, Convert allows testers to compare the behavioral patterns of a "Control" group against several variations in real-time. Their proprietary Signals® technology utilizes machine learning to flag sessions containing render delays, API slowness, or hesitation patterns, effectively automating the most tedious parts of UX research.
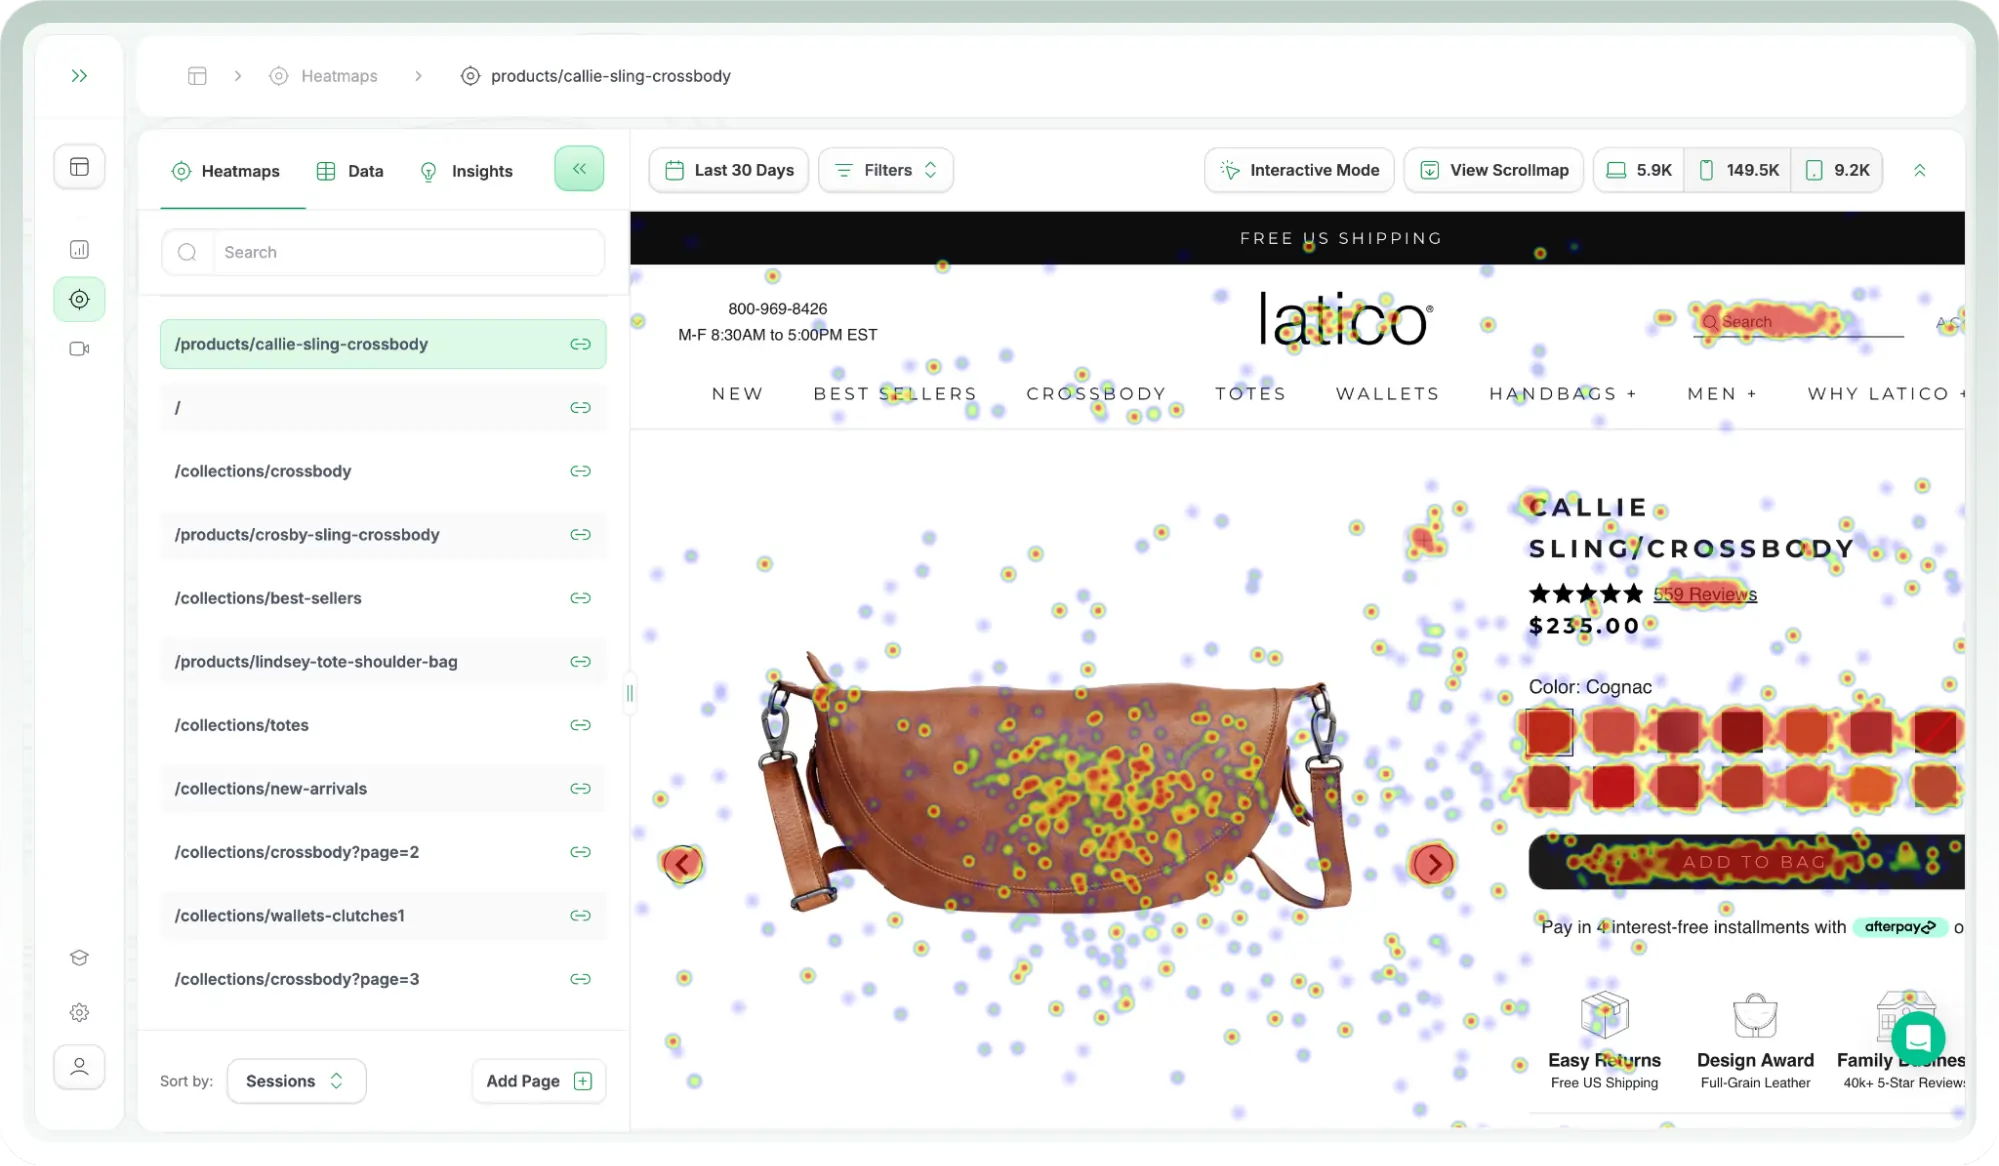
In the enterprise tier, Glassbox and Quantum Metric continue to define the "Digital Experience Intelligence" category. These platforms are designed for complex, multi-step conversion funnels, such as those found in banking or high-volume e-commerce. Quantum Metric’s "Felix AI" represents a 2025 milestone, offering researchers the ability to generate text-based summaries of thousands of user sessions, highlighting common friction points without requiring manual review of recordings.
Revenue-Centric Heatmapping: A New Industry Standard
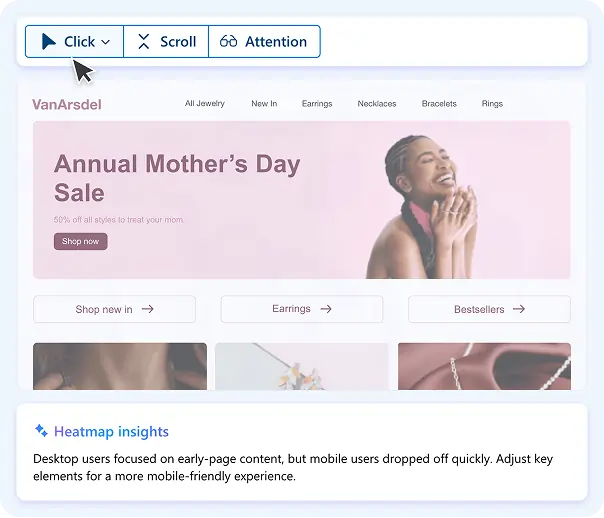
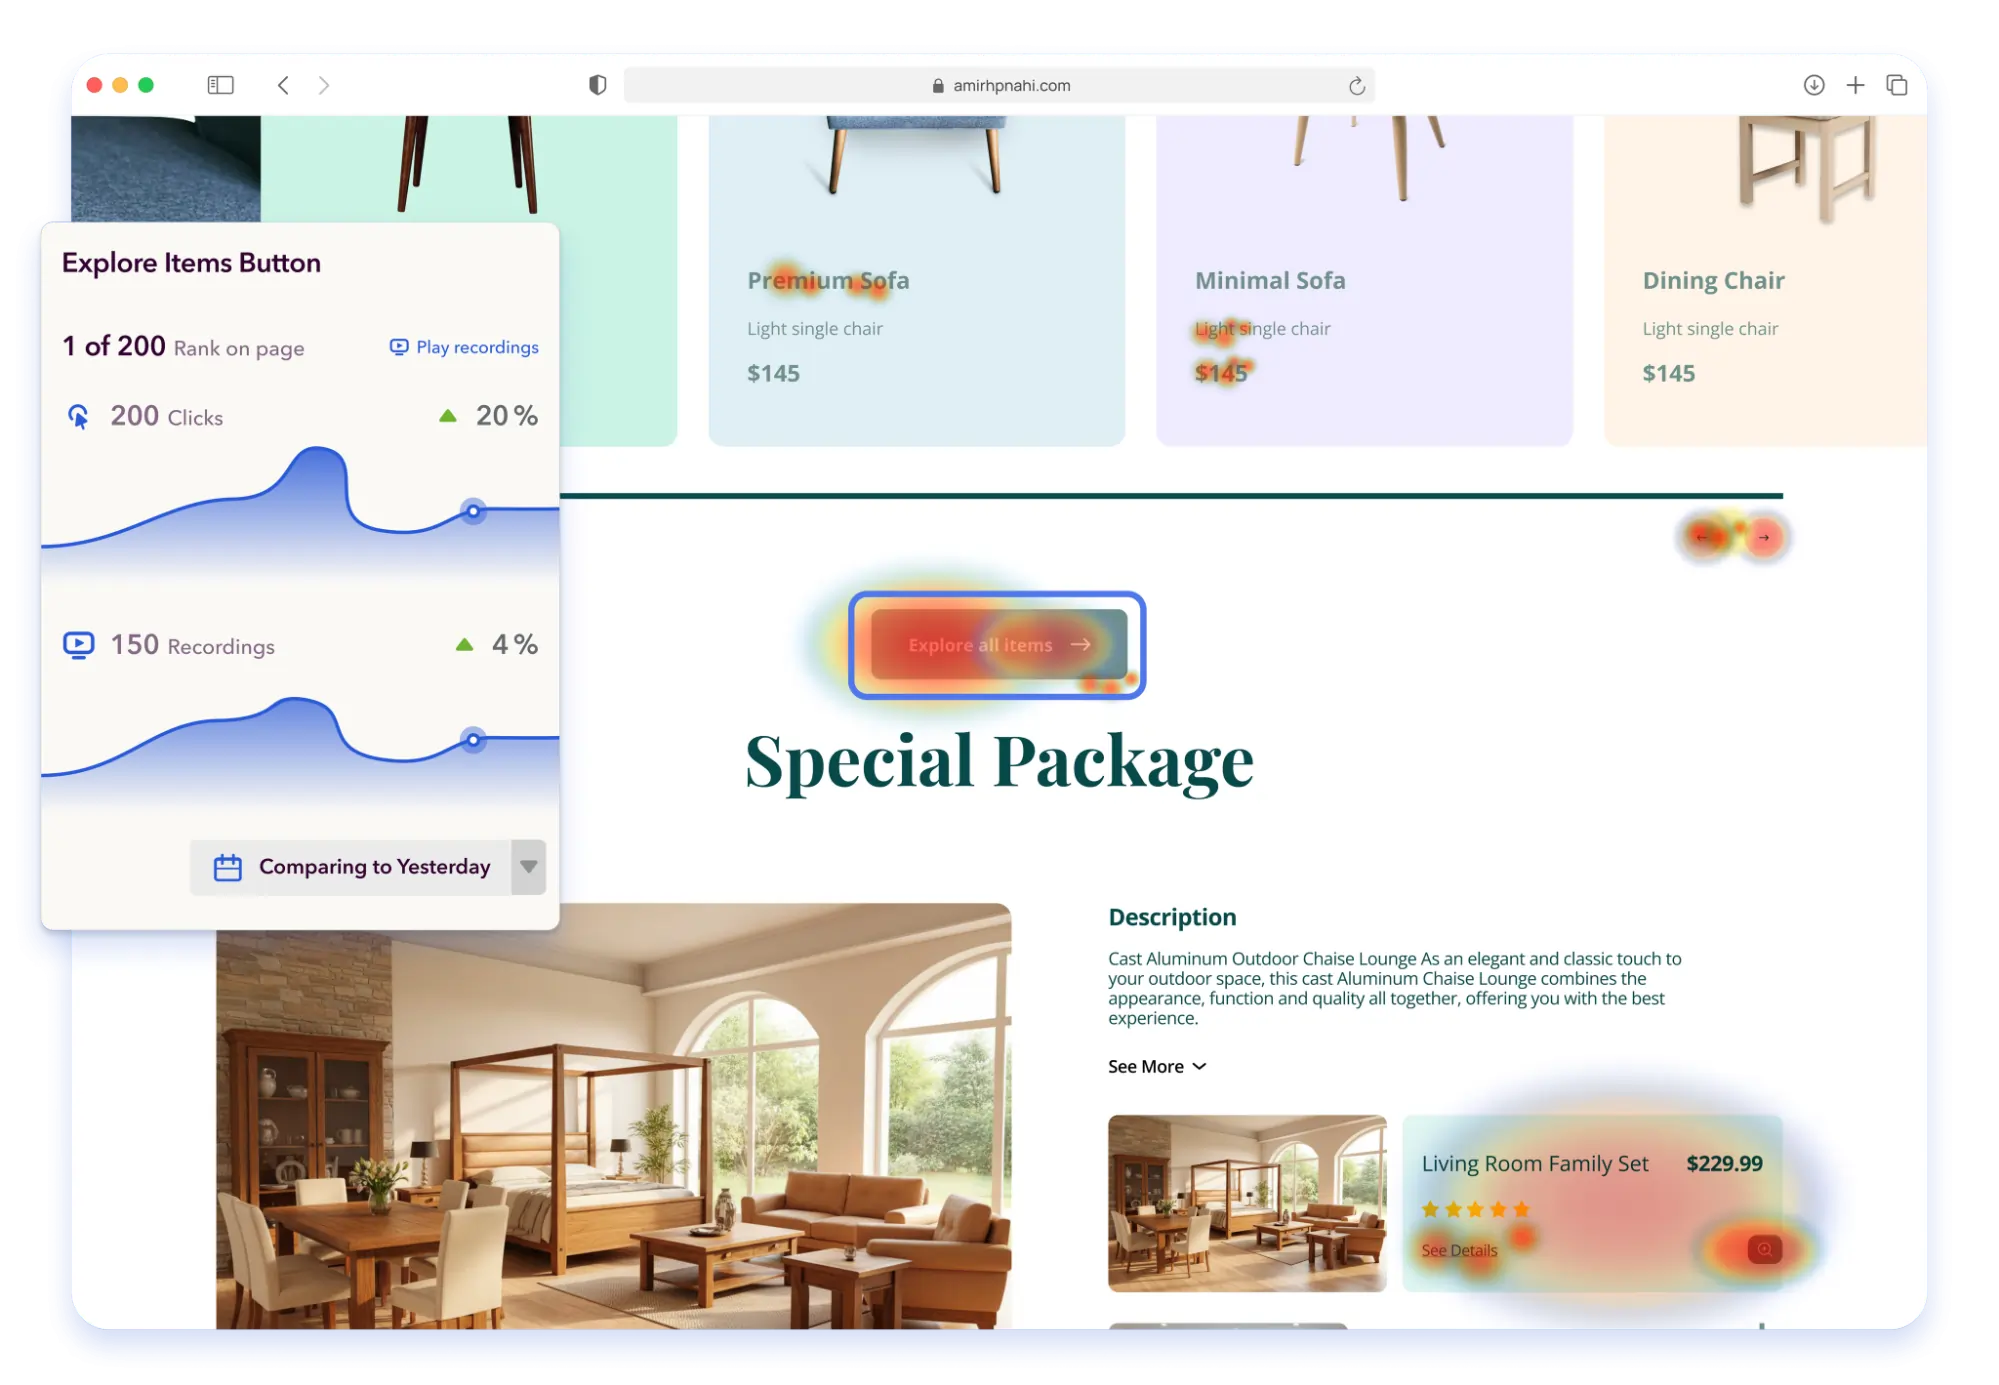
A notable development in the 2025 CRO space is the move toward revenue attribution within visual maps. Platforms like Heatmap.com have pioneered the concept of "Revenue Per Session" (RPS) heatmaps. Unlike traditional maps that show where users click most frequently, these tools overlay actual dollar values onto website elements. This allows marketers to distinguish between "curiosity clicks" (which may not lead to sales) and "high-intent clicks" (which drive revenue).
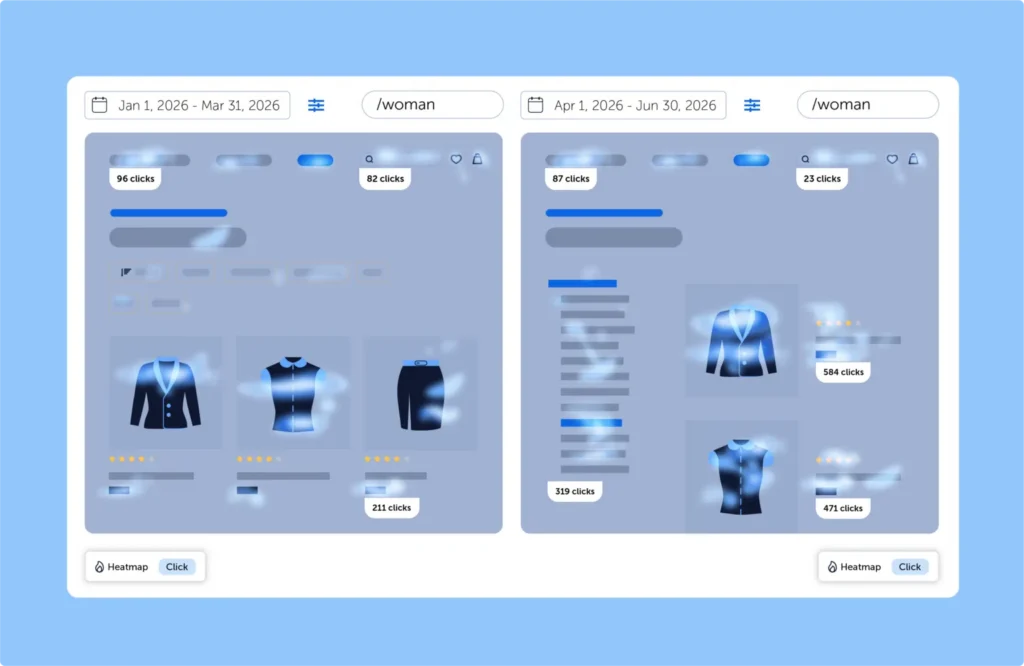
Industry analysts suggest that this shift is a response to the "noise" created by high-traffic, low-intent social media referrals. By filtering heatmaps to show only the behavior of high-value customers, brands can optimize their layouts for profitability rather than mere engagement.
Democratization of Data: The Impact of Microsoft Clarity
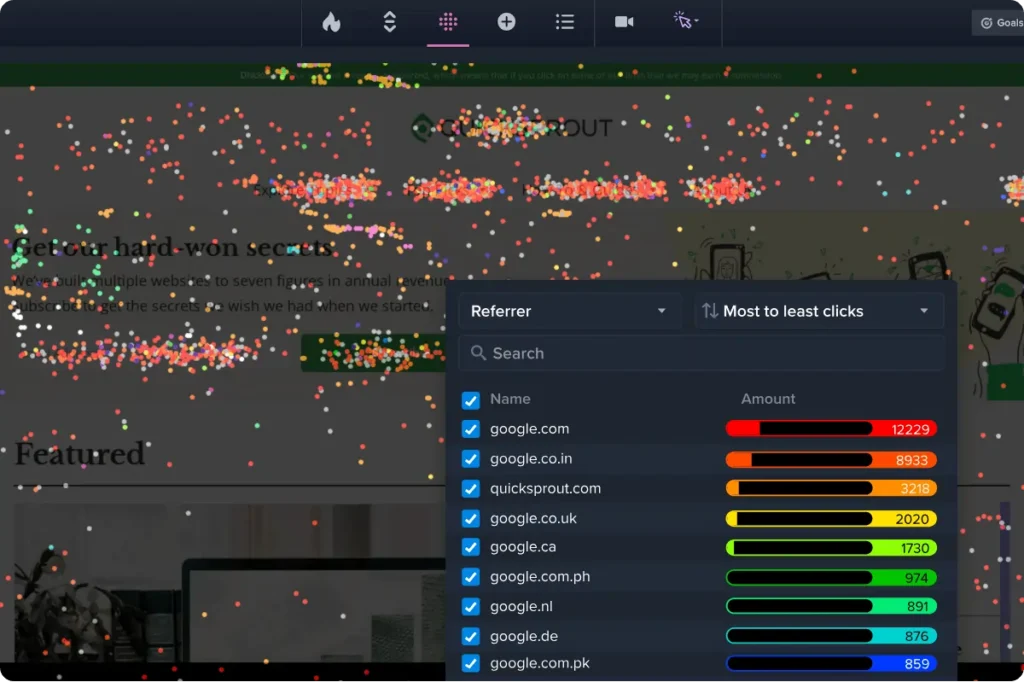
The entry of Microsoft Clarity into the market as a "free forever" tool has significantly disrupted the pricing models of established players. By offering unlimited heatmaps and session recordings at no cost, Microsoft has democratized behavioral data for small businesses and startups. This has forced premium competitors like Mouseflow, Lucky Orange, and Crazy Egg to pivot toward more specialized features, such as advanced form analytics, live chat integration, and multi-device funnel tracking to justify their subscription costs.
Clarity’s deep integration with Google Analytics 4 (GA4) has also made it a favorite for SEO and content marketing teams who need to understand why organic traffic is failing to convert on landing pages. Despite being free, Clarity maintains high standards for privacy and site performance, utilizing a lightweight script that minimizes impact on PageSpeed Insights—a critical factor for search rankings in 2025.
Supporting Data and Economic Implications
The financial justification for investing in heatmapping tools is supported by a growing body of empirical evidence. According to a 2024 study by the Baymard Institute, the average e-commerce site has a cart abandonment rate of nearly 70%. Behavioral data suggests that approximately 25% of these abandonments are due to "UI friction"—confusing navigation, broken links, or non-responsive buttons.
For a mid-market retailer generating $10 million in annual revenue, a 5% reduction in friction-related abandonment translates to an additional $500,000 in top-line growth. This high Return on Investment (ROI) is the primary driver behind the projected 12.4% Compound Annual Growth Rate (CAGR) of the global UX research software market through 2030.
Implementation and Methodology: Selecting the Right Tool
Choosing a heatmapping solution requires a strategic assessment of an organization’s specific needs. Market experts recommend evaluating tools based on three primary criteria:
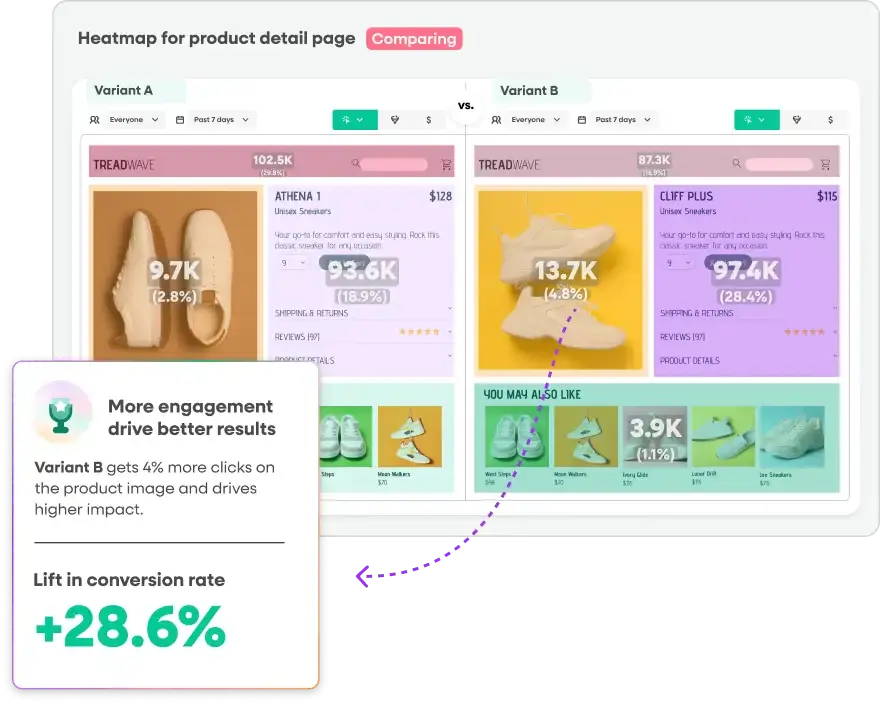
- Integration Depth: Does the tool sync with the current A/B testing platform? Tools like Convert Experiences offer an advantage by keeping all data within a single environment, reducing the risk of data discrepancies between disparate platforms.
- Data Retention and Sampling: Many lower-cost tools use "sampling," capturing only a fraction of total traffic. Enterprise-grade solutions like Glassbox capture 100% of sessions, which is vital for troubleshooting intermittent technical errors that only affect a small percentage of users.
- Privacy and Compliance: With the tightening of global data protection laws (GDPR, CCPA), tools must offer robust PII (Personally Identifiable Information) masking. The leading platforms now provide "server-side" tracking options and automated masking of sensitive form fields to ensure compliance without compromising data quality.
Official Responses and Industry Sentiment
While the technical capabilities of these tools are celebrated, industry leaders emphasize that software is only as effective as the strategy behind it. "Heatmaps are not a magic bullet; they are a diagnostic lens," stated one senior strategist at a leading CRO agency. "The real value comes when a researcher sees a ‘dead click’ on a heatmap and uses that insight to form a hypothesis for a controlled experiment."
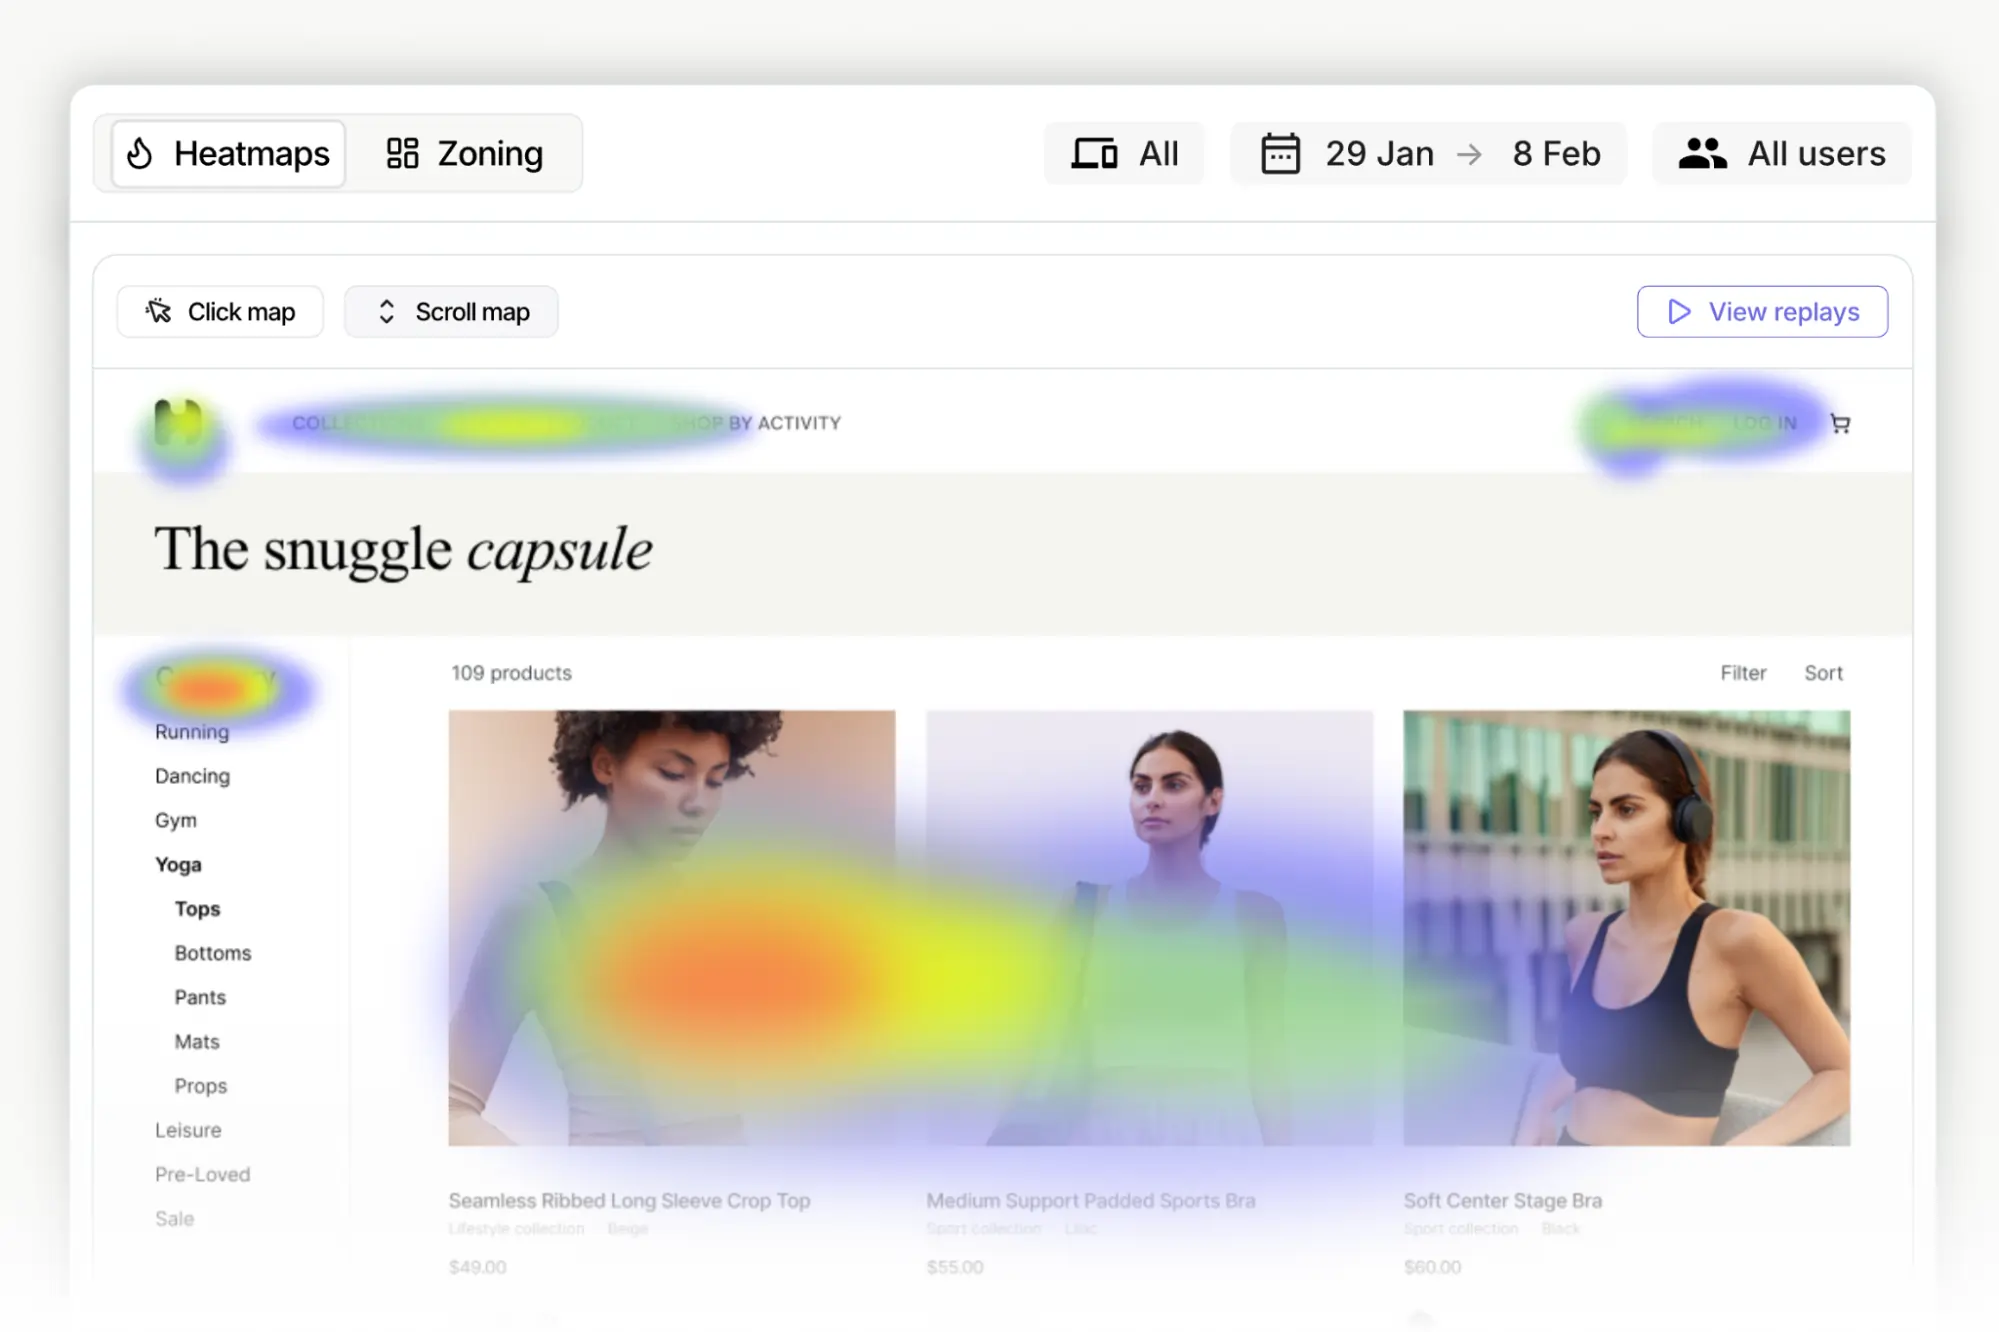
Software vendors have responded to this sentiment by building more collaborative features. Modern platforms now include "workspace" environments where UX designers, developers, and product managers can annotate heatmaps and share session recordings, fostering a "culture of experimentation" within the organization.

Future Outlook: The Role of AI and Predictive Mapping
Looking toward the end of the decade, the industry is moving toward "Predictive Heatmaps." By training AI models on billions of historical user sessions, companies like Instapage are beginning to offer tools that can predict how users will interact with a page before it even goes live. This "pre-click" optimization could theoretically reduce the need for lengthy A/B tests by eliminating obvious design flaws during the wireframing stage.

Furthermore, the integration of "Voice of the Customer" (VoC) data—where session recordings are paired with exit-intent surveys—is becoming the gold standard for understanding the "User Intent" layer of the conversion funnel.

In conclusion, the heatmapping market of 2025 is more robust, integrated, and data-rich than ever before. Whether an organization chooses a free tool like Microsoft Clarity for basic insights or an integrated experimentation suite like Convert Experiences for advanced testing, the ability to visualize user behavior has become an non-negotiable requirement for digital success. As AI continues to refine these tools, the gap between what users say they want and what they actually do will continue to close, leading to a more intuitive and frictionless internet for everyone.







