Global digital marketing benchmarks have shifted significantly as of mid-2024, revealing that the median conversion rate for landing pages across all major industries now stands at 6.6%. This figure, derived from an extensive analysis of over 57 million conversions and 464 million pageviews, serves as a critical baseline for marketers seeking to evaluate the efficacy of their lead generation and sales funnels. However, the data underscores a fundamental reality of modern performance marketing: "average" is no longer a sufficient target for competitive brands. Top-tier performers, representing the 75th percentile of the market, are currently achieving conversion rates between 11.4% and 40.8%, depending heavily on the specific sector and the complexity of the user’s intended action.

Statistical Methodology and the Primacy of Median Values
In analyzing the performance of 41,000 landing pages, researchers have pivoted away from traditional "average" (mean) calculations in favor of median values. This shift in reporting methodology is designed to provide a more accurate reflection of typical market performance by eliminating the distorting effects of "unicorn" pages—those rare outliers that convert at exceptionally high rates—as well as underperforming pages that skew toward zero.
The distinction is vital for strategic planning. While a mean average might be inflated by a handful of high-spending, hyper-optimized enterprise campaigns, the median provides a "middle-of-the-pack" reference point that is more attainable and realistic for the average business. By focusing on the median, marketers can better understand what is truly standard for their specific demographic and industry, allowing for more precise budget allocation and return-on-investment (ROI) forecasting.

Comparative Industry Analysis: E-commerce, SaaS, and Professional Services
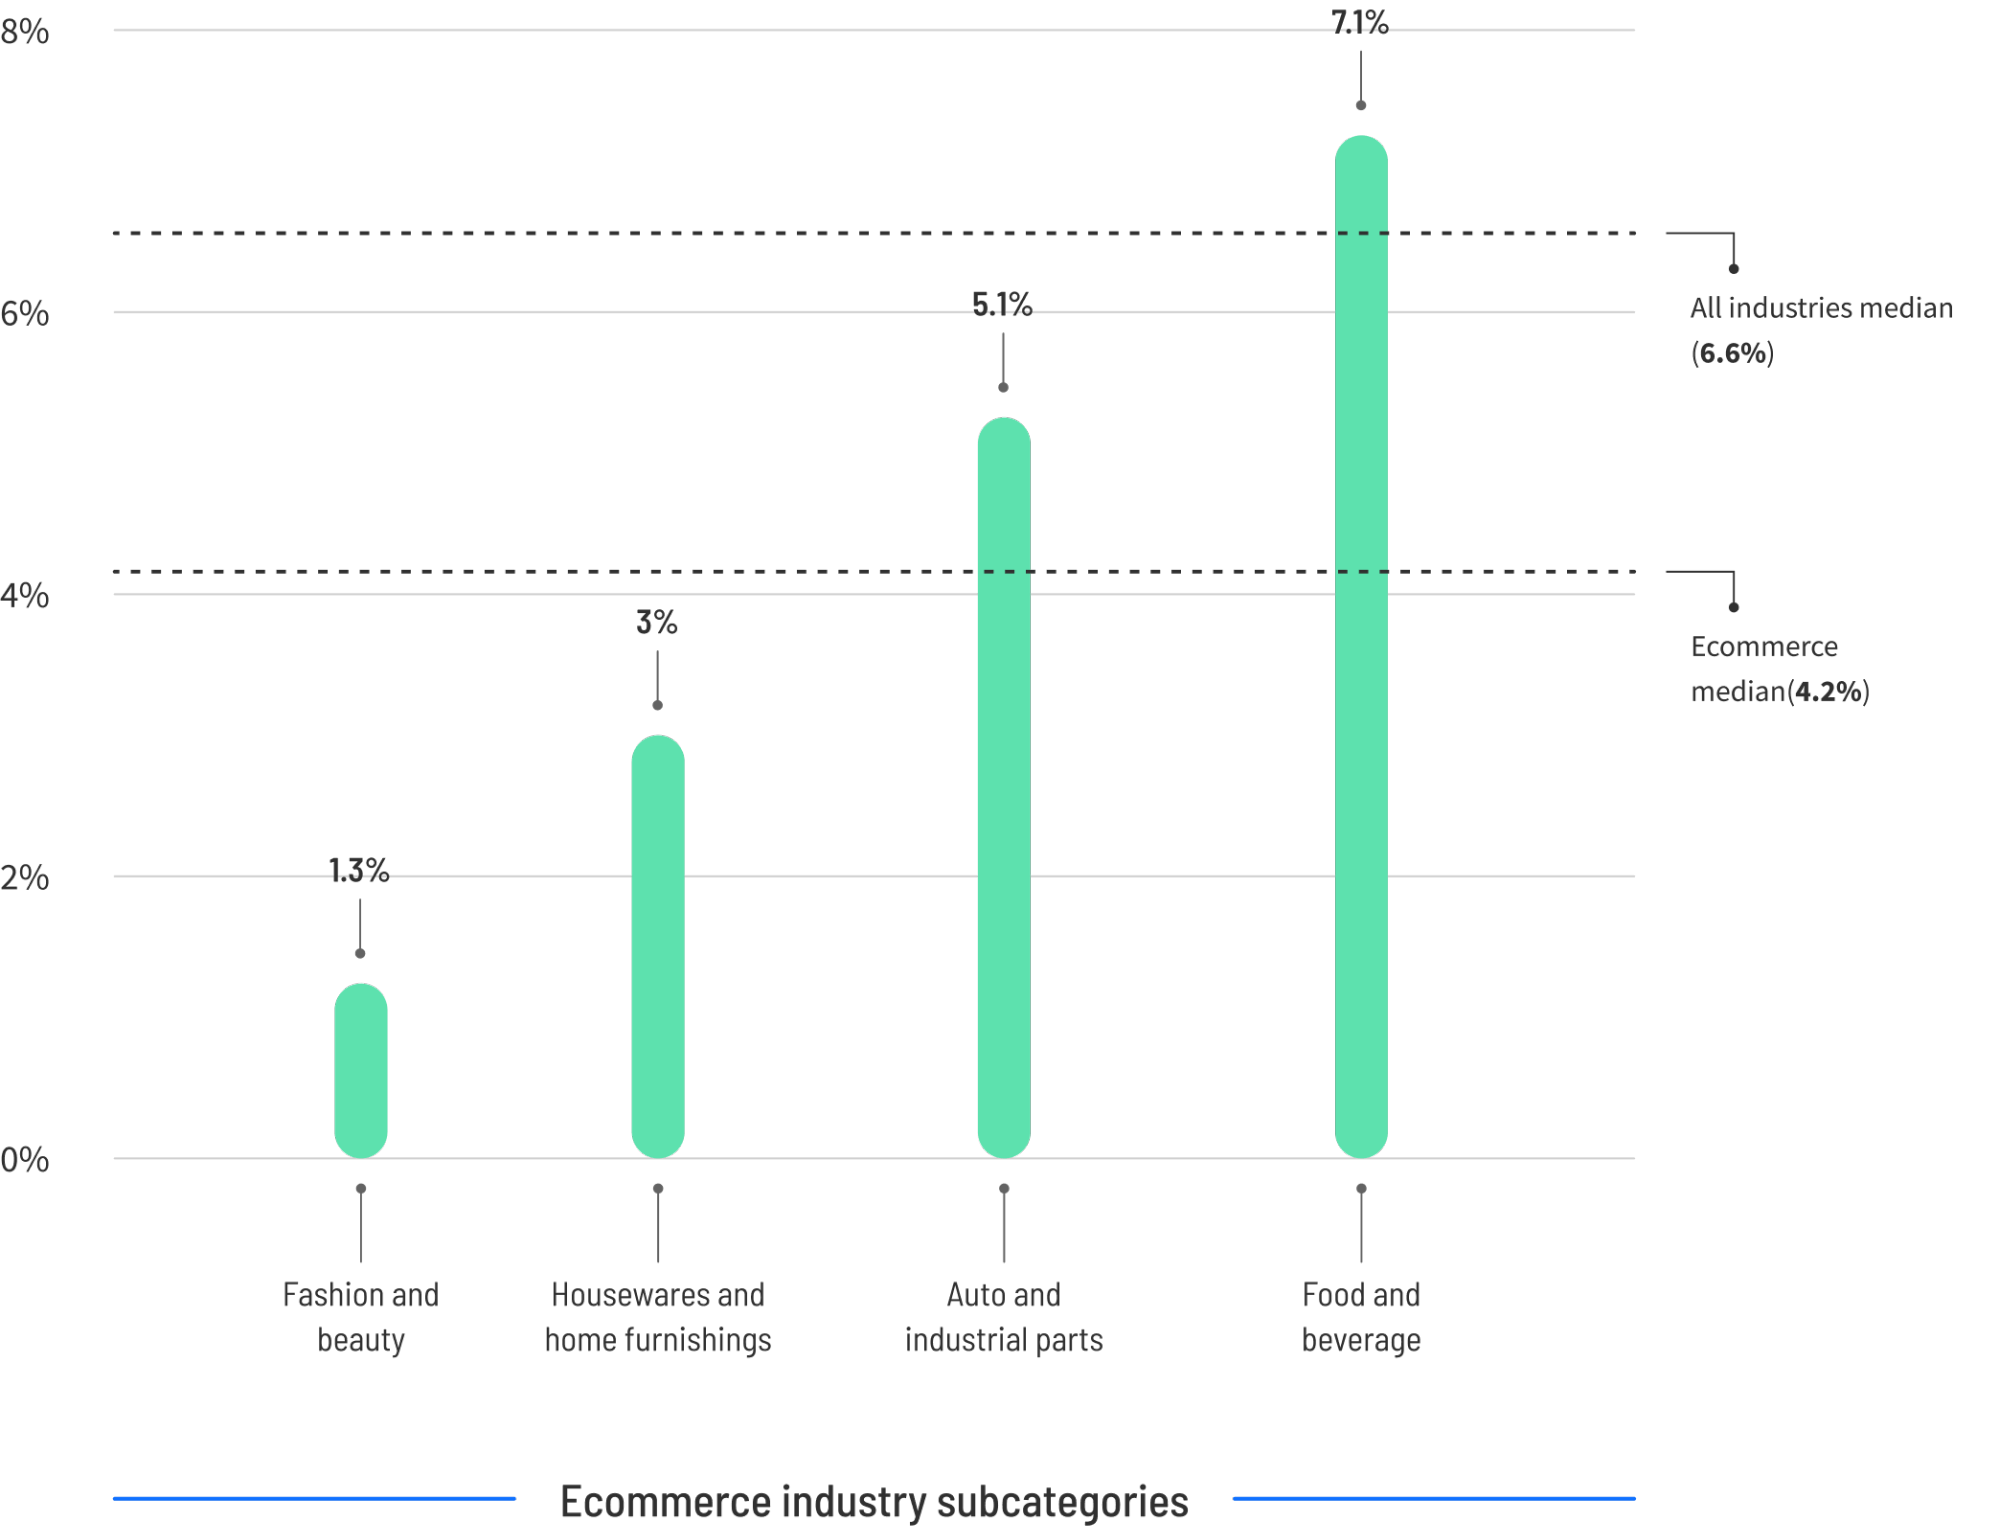
The 2024 data reveals a stark divergence in performance across different business models. E-commerce landing pages currently maintain a median conversion rate of 4.2%. Within this sector, performance is highly granular; food and beverage pages often see higher engagement at 7.1%, while fashion and beauty niches frequently struggle with lower rates, averaging around 1.3%. For e-commerce entities, moving from the median to the 75th percentile (11.4%) represents a transformative shift in revenue potential. For a store with 10,000 monthly visitors and an average order value of $75, this optimization can translate to an additional $54,000 in monthly revenue.
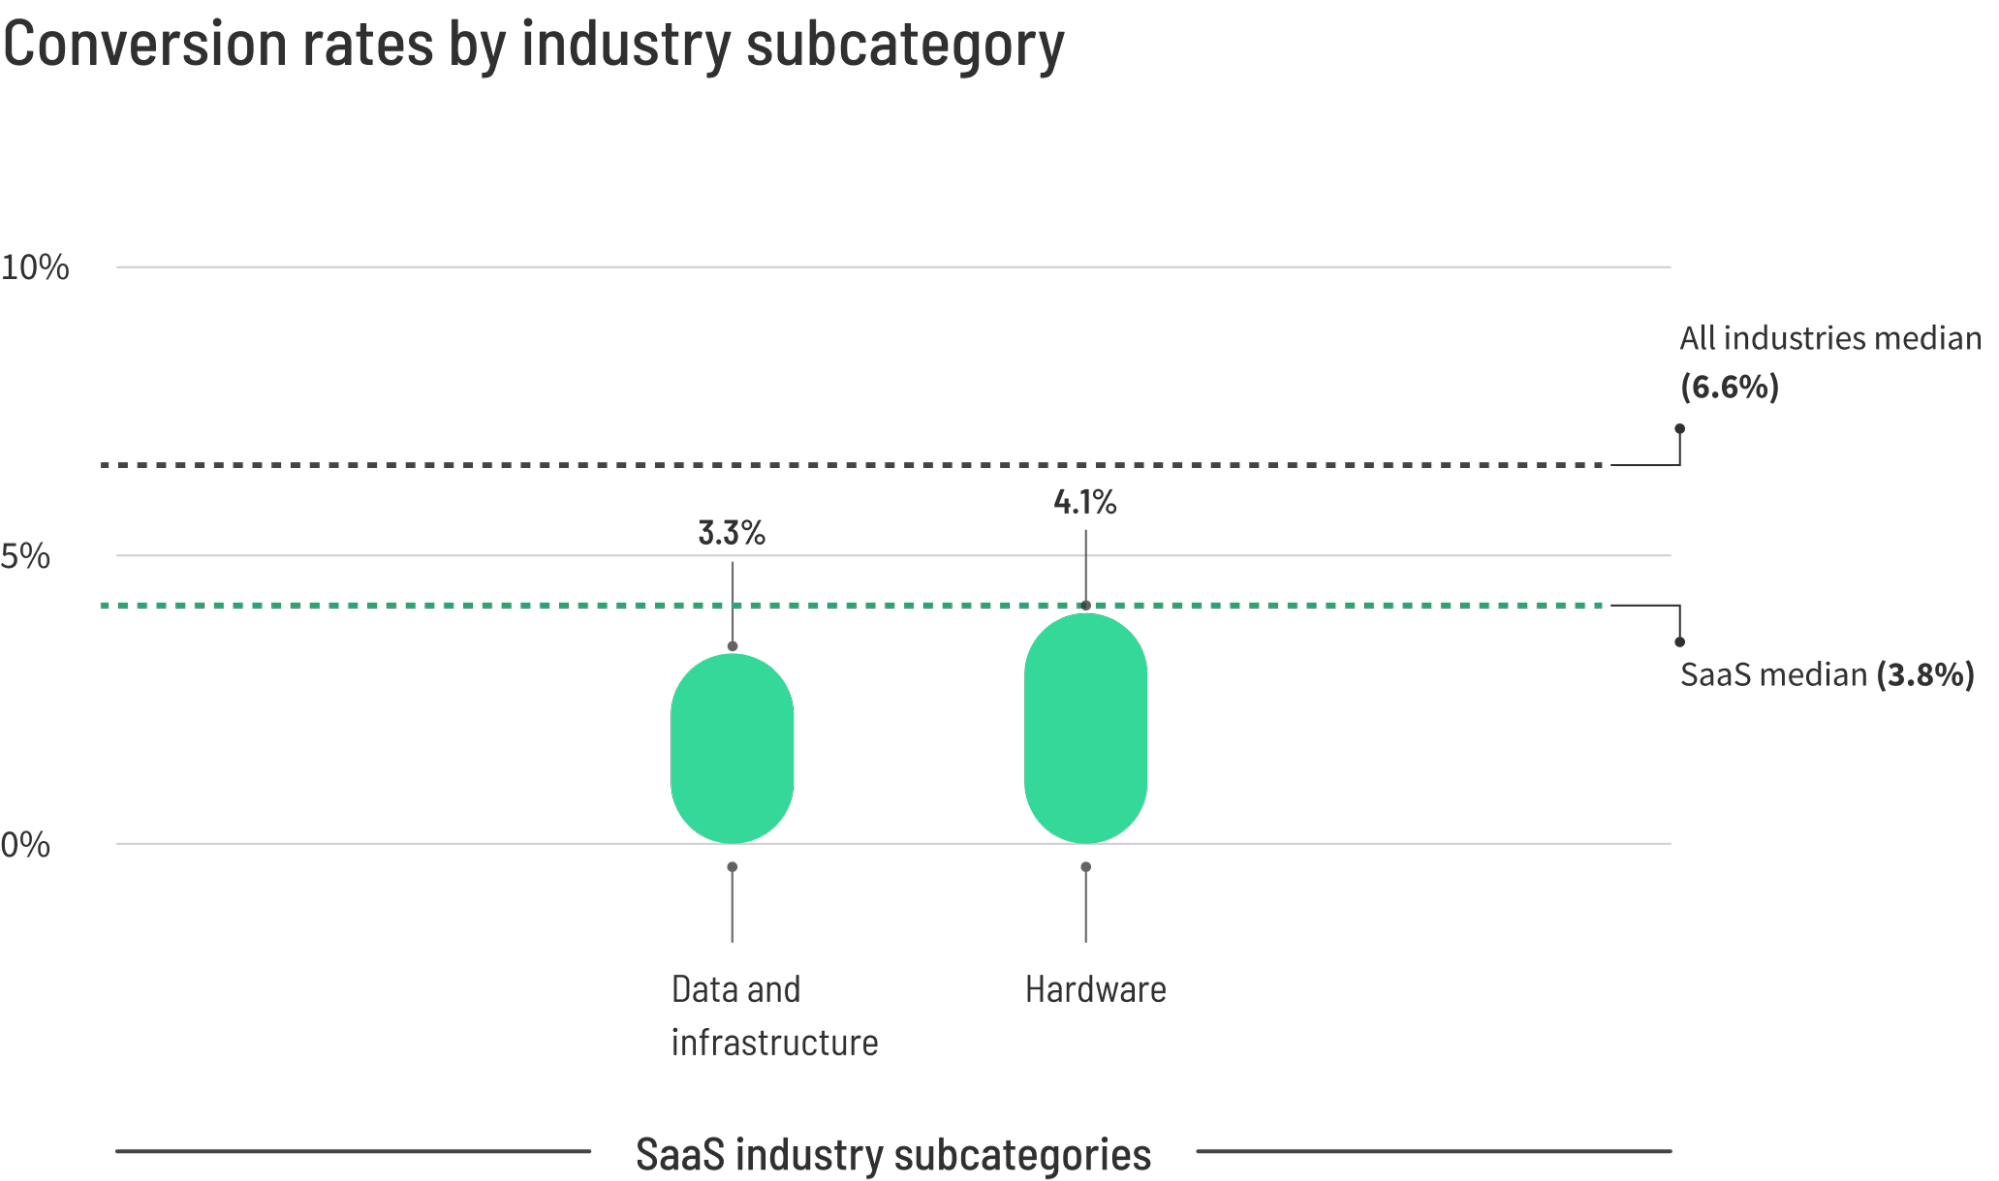
In contrast, the Software-as-a-Service (SaaS) industry faces a more challenging landscape, with a median conversion rate of 3.8%. This lower figure is attributed to the inherent complexity of SaaS products and the longer sales cycles associated with B2B software. Users typically require more information and multiple touchpoints before committing to a trial or demo. However, top-performing SaaS pages are still managing to break the 11.6% threshold by utilizing streamlined forms and messaging that directly addresses specific customer pain points.
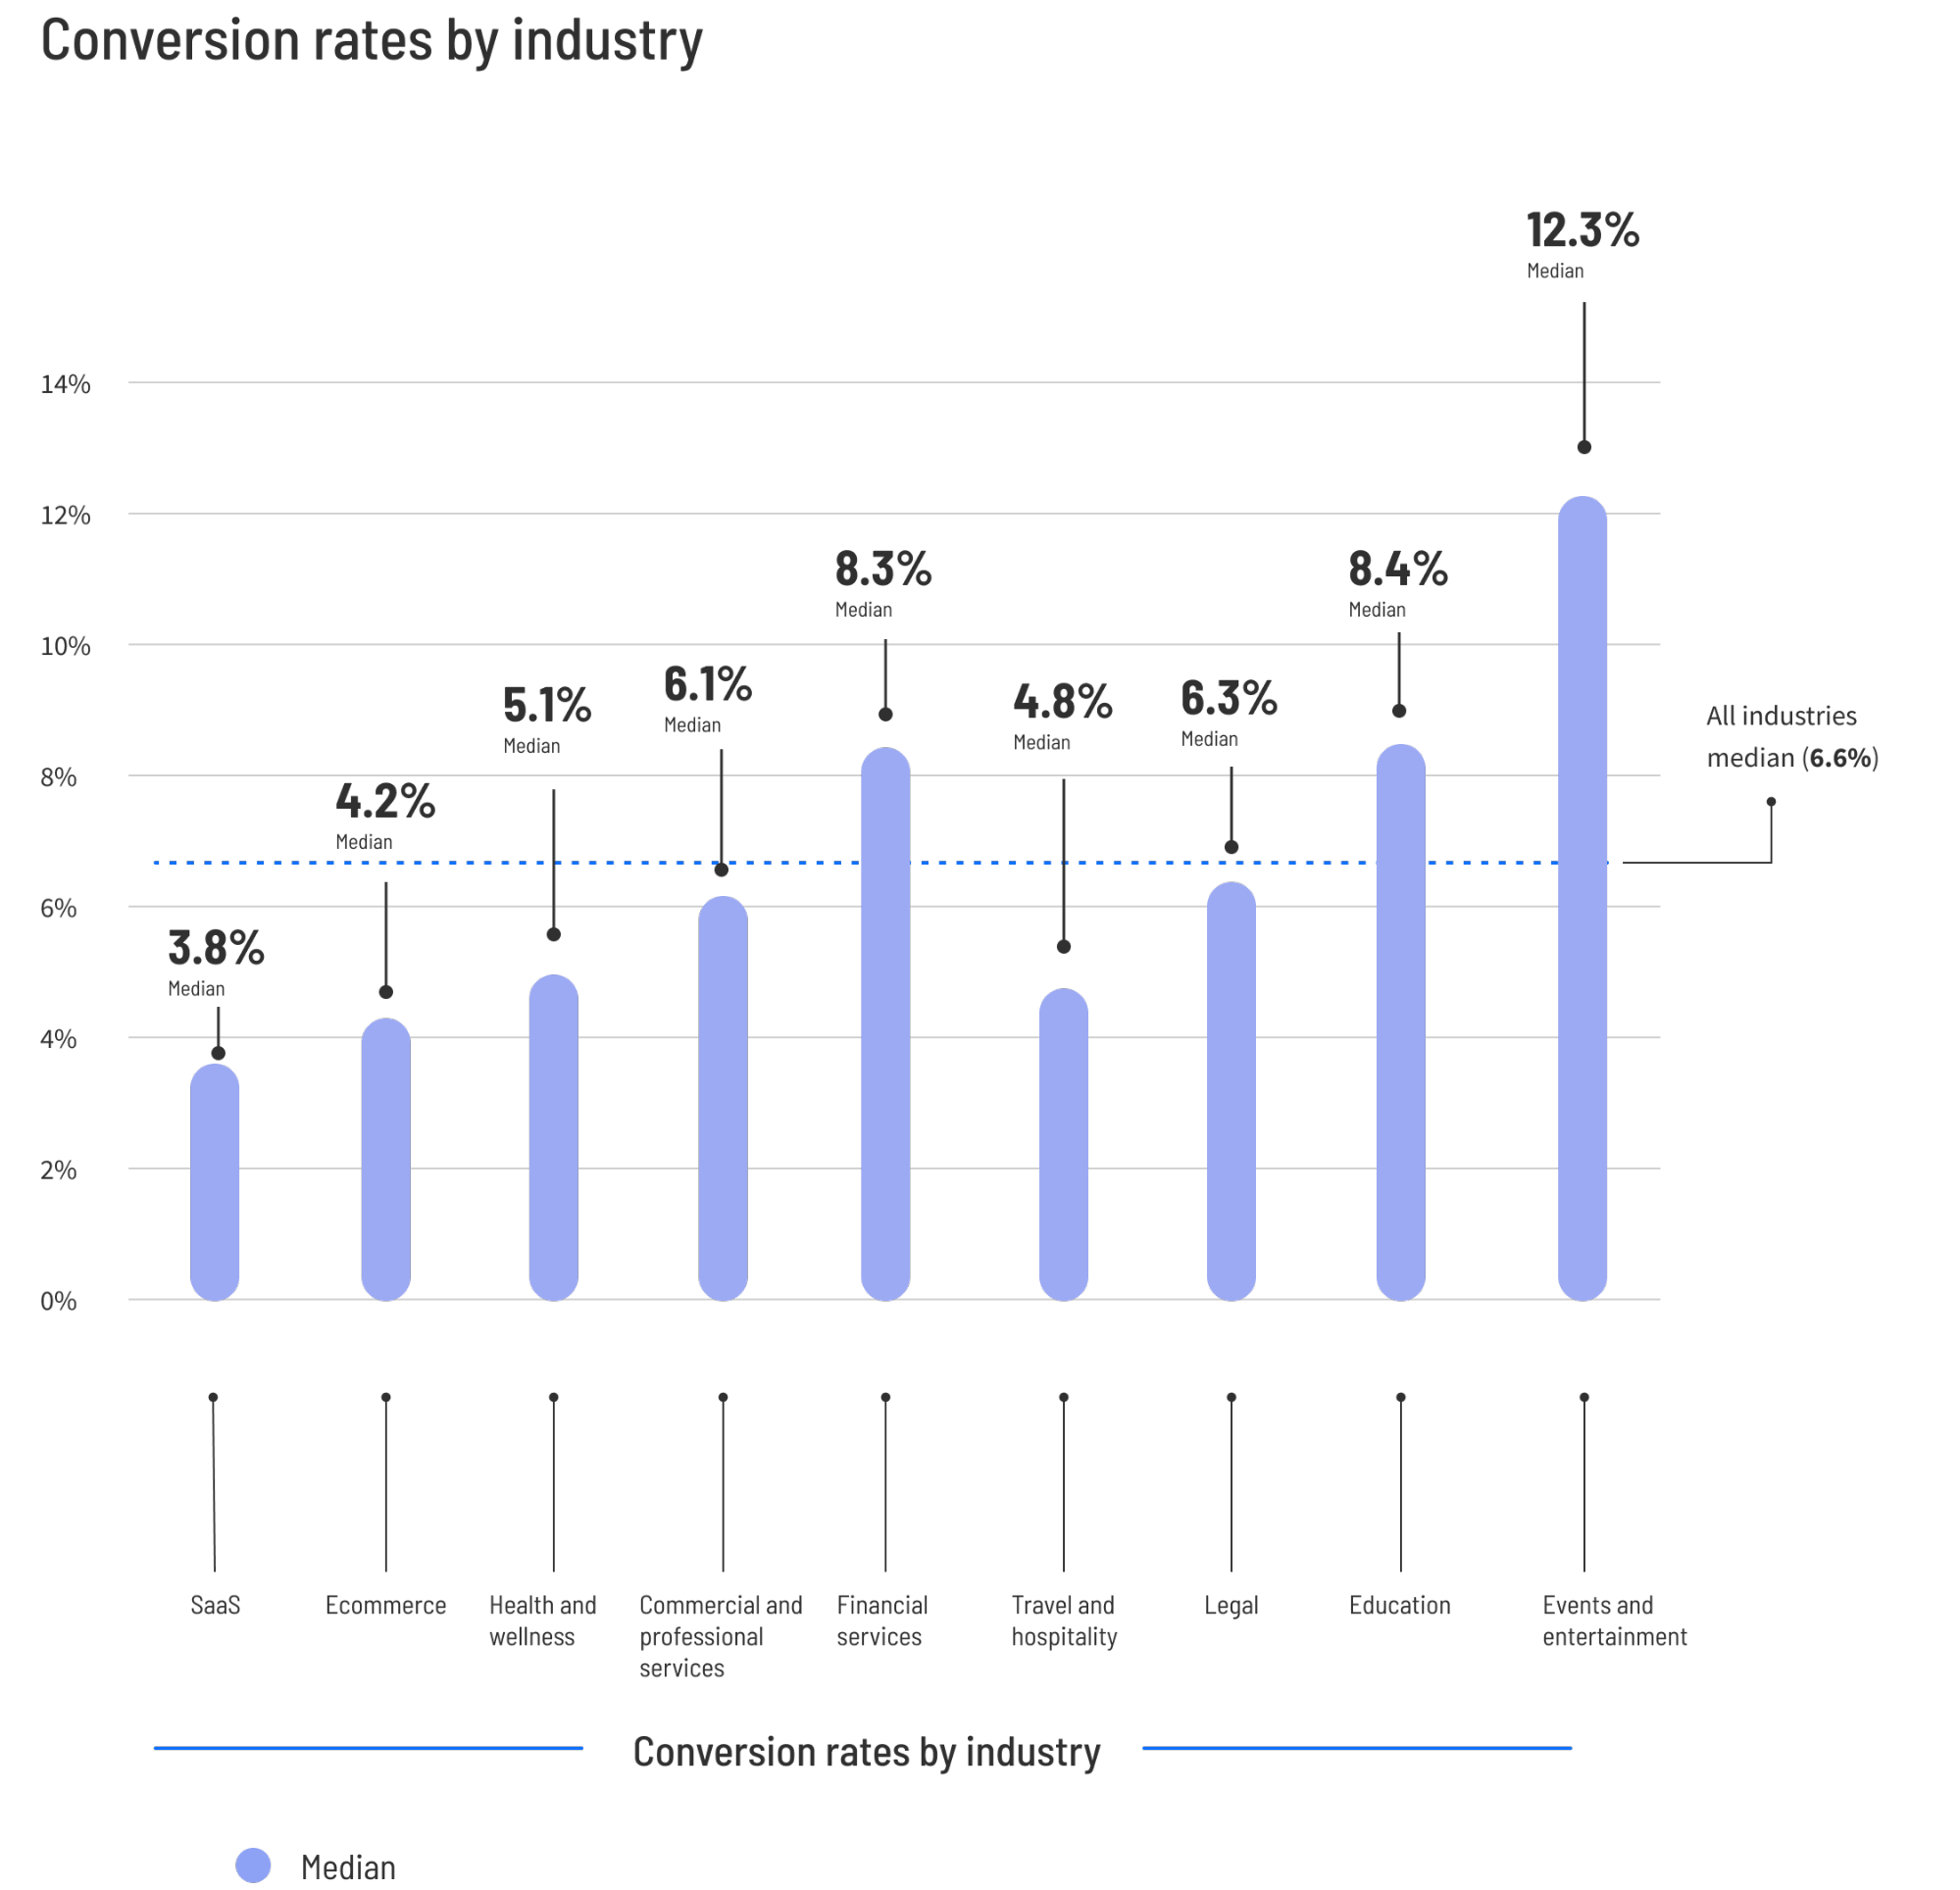
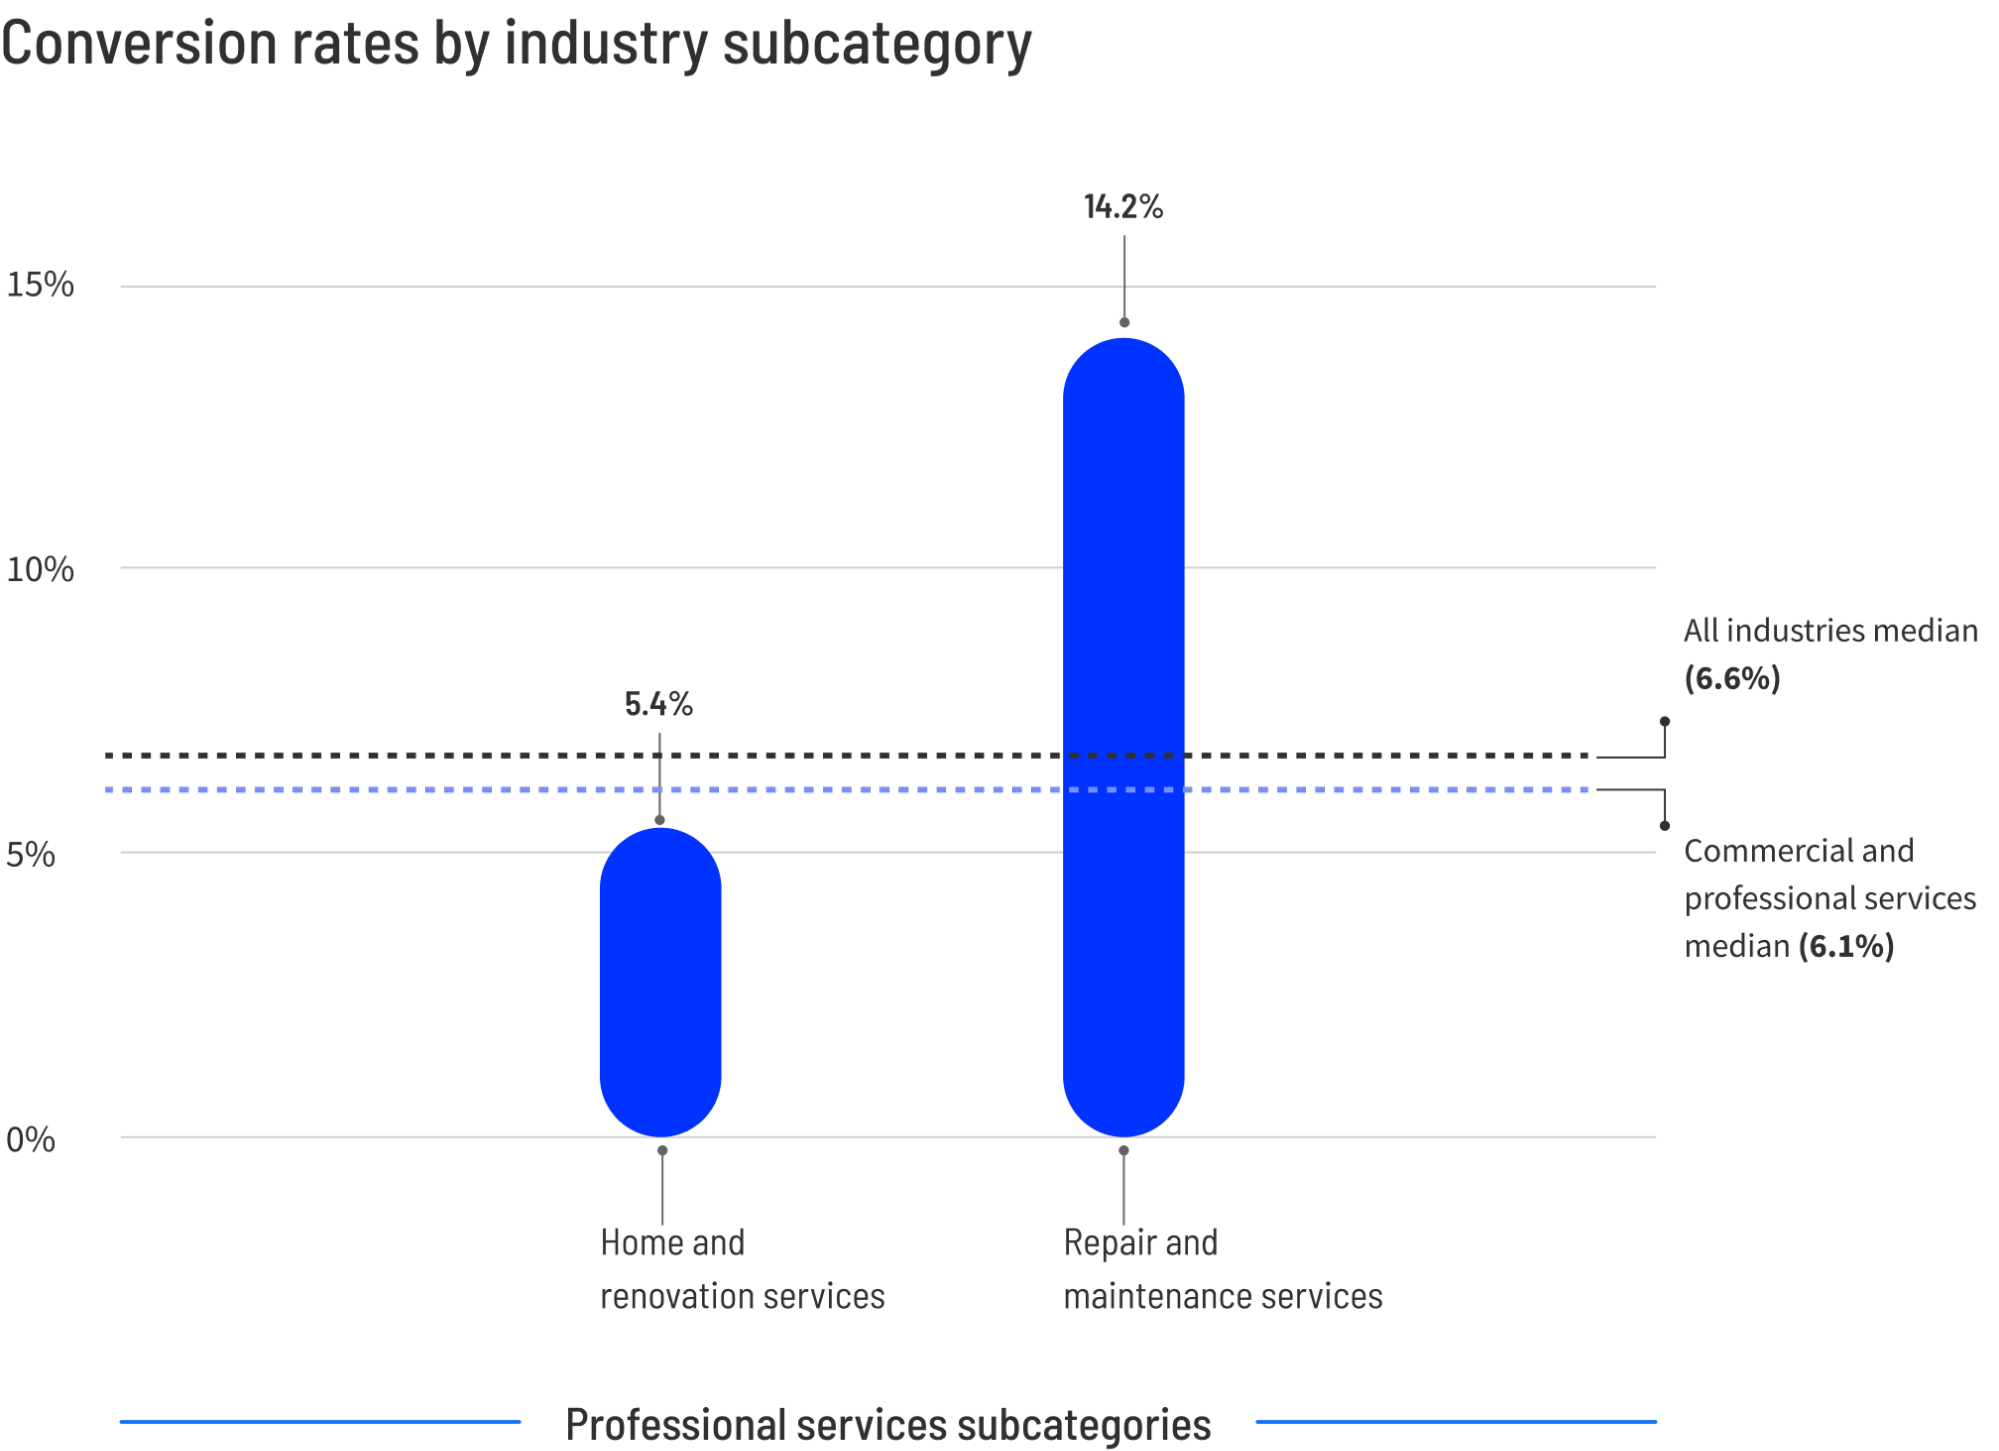
Professional services, including consulting, legal, and home repair, show a median conversion rate of 6.1%. This category highlights the impact of "urgency" on conversion data. For instance, repair and maintenance services convert nearly three times more effectively than home renovation services. This disparity is driven by consumer intent: a homeowner with a burst pipe (high urgency) is far more likely to convert immediately than one casually researching a kitchen remodel (low urgency).
High-Intent Sectors: Financial Services and Legal Performance
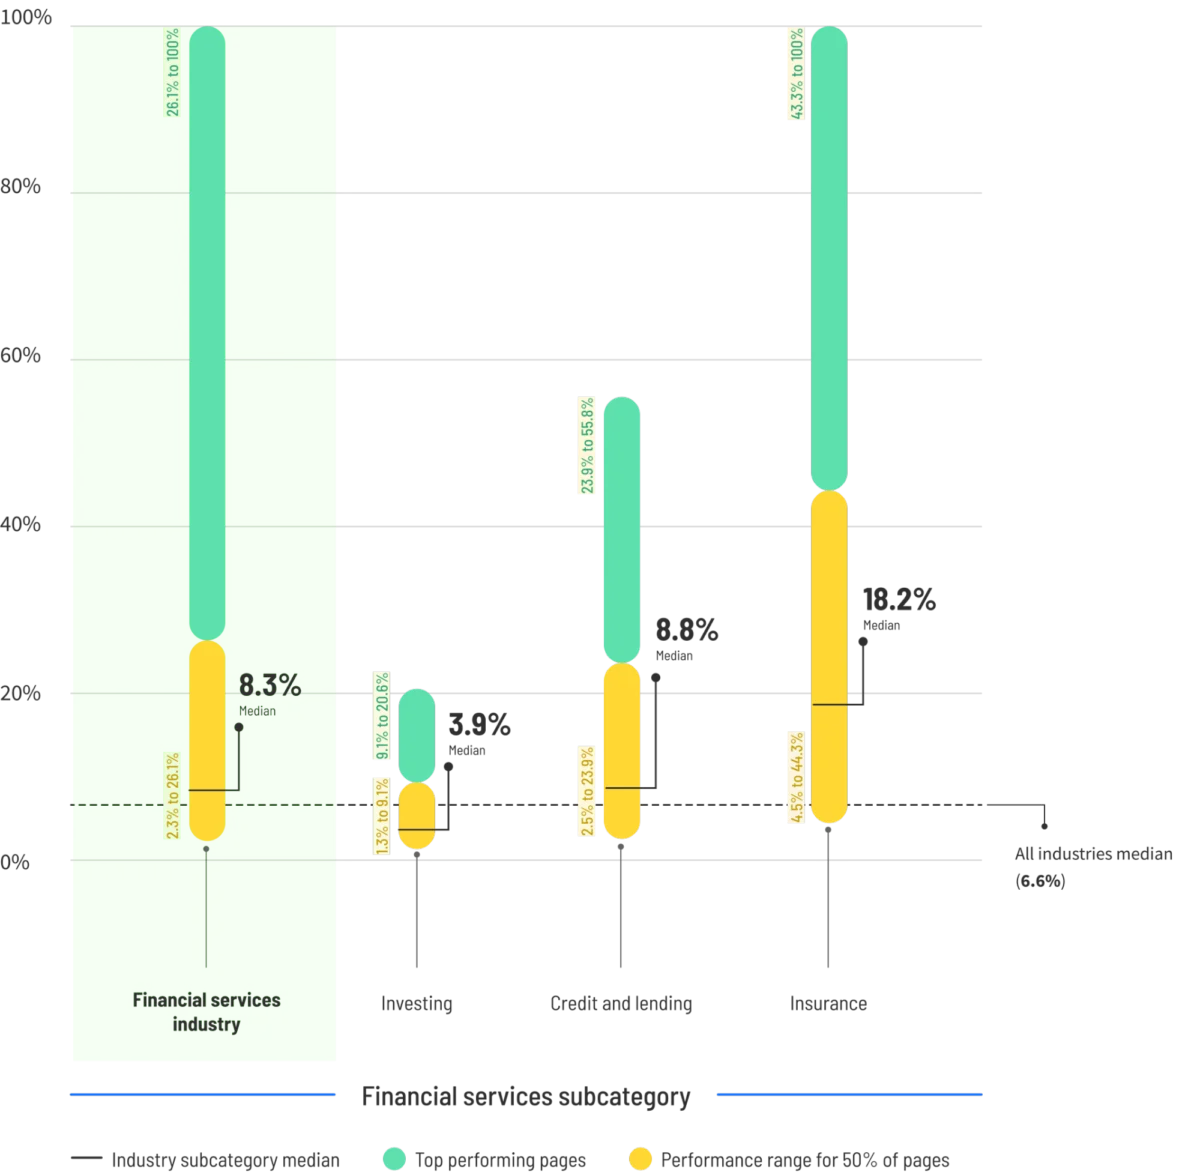
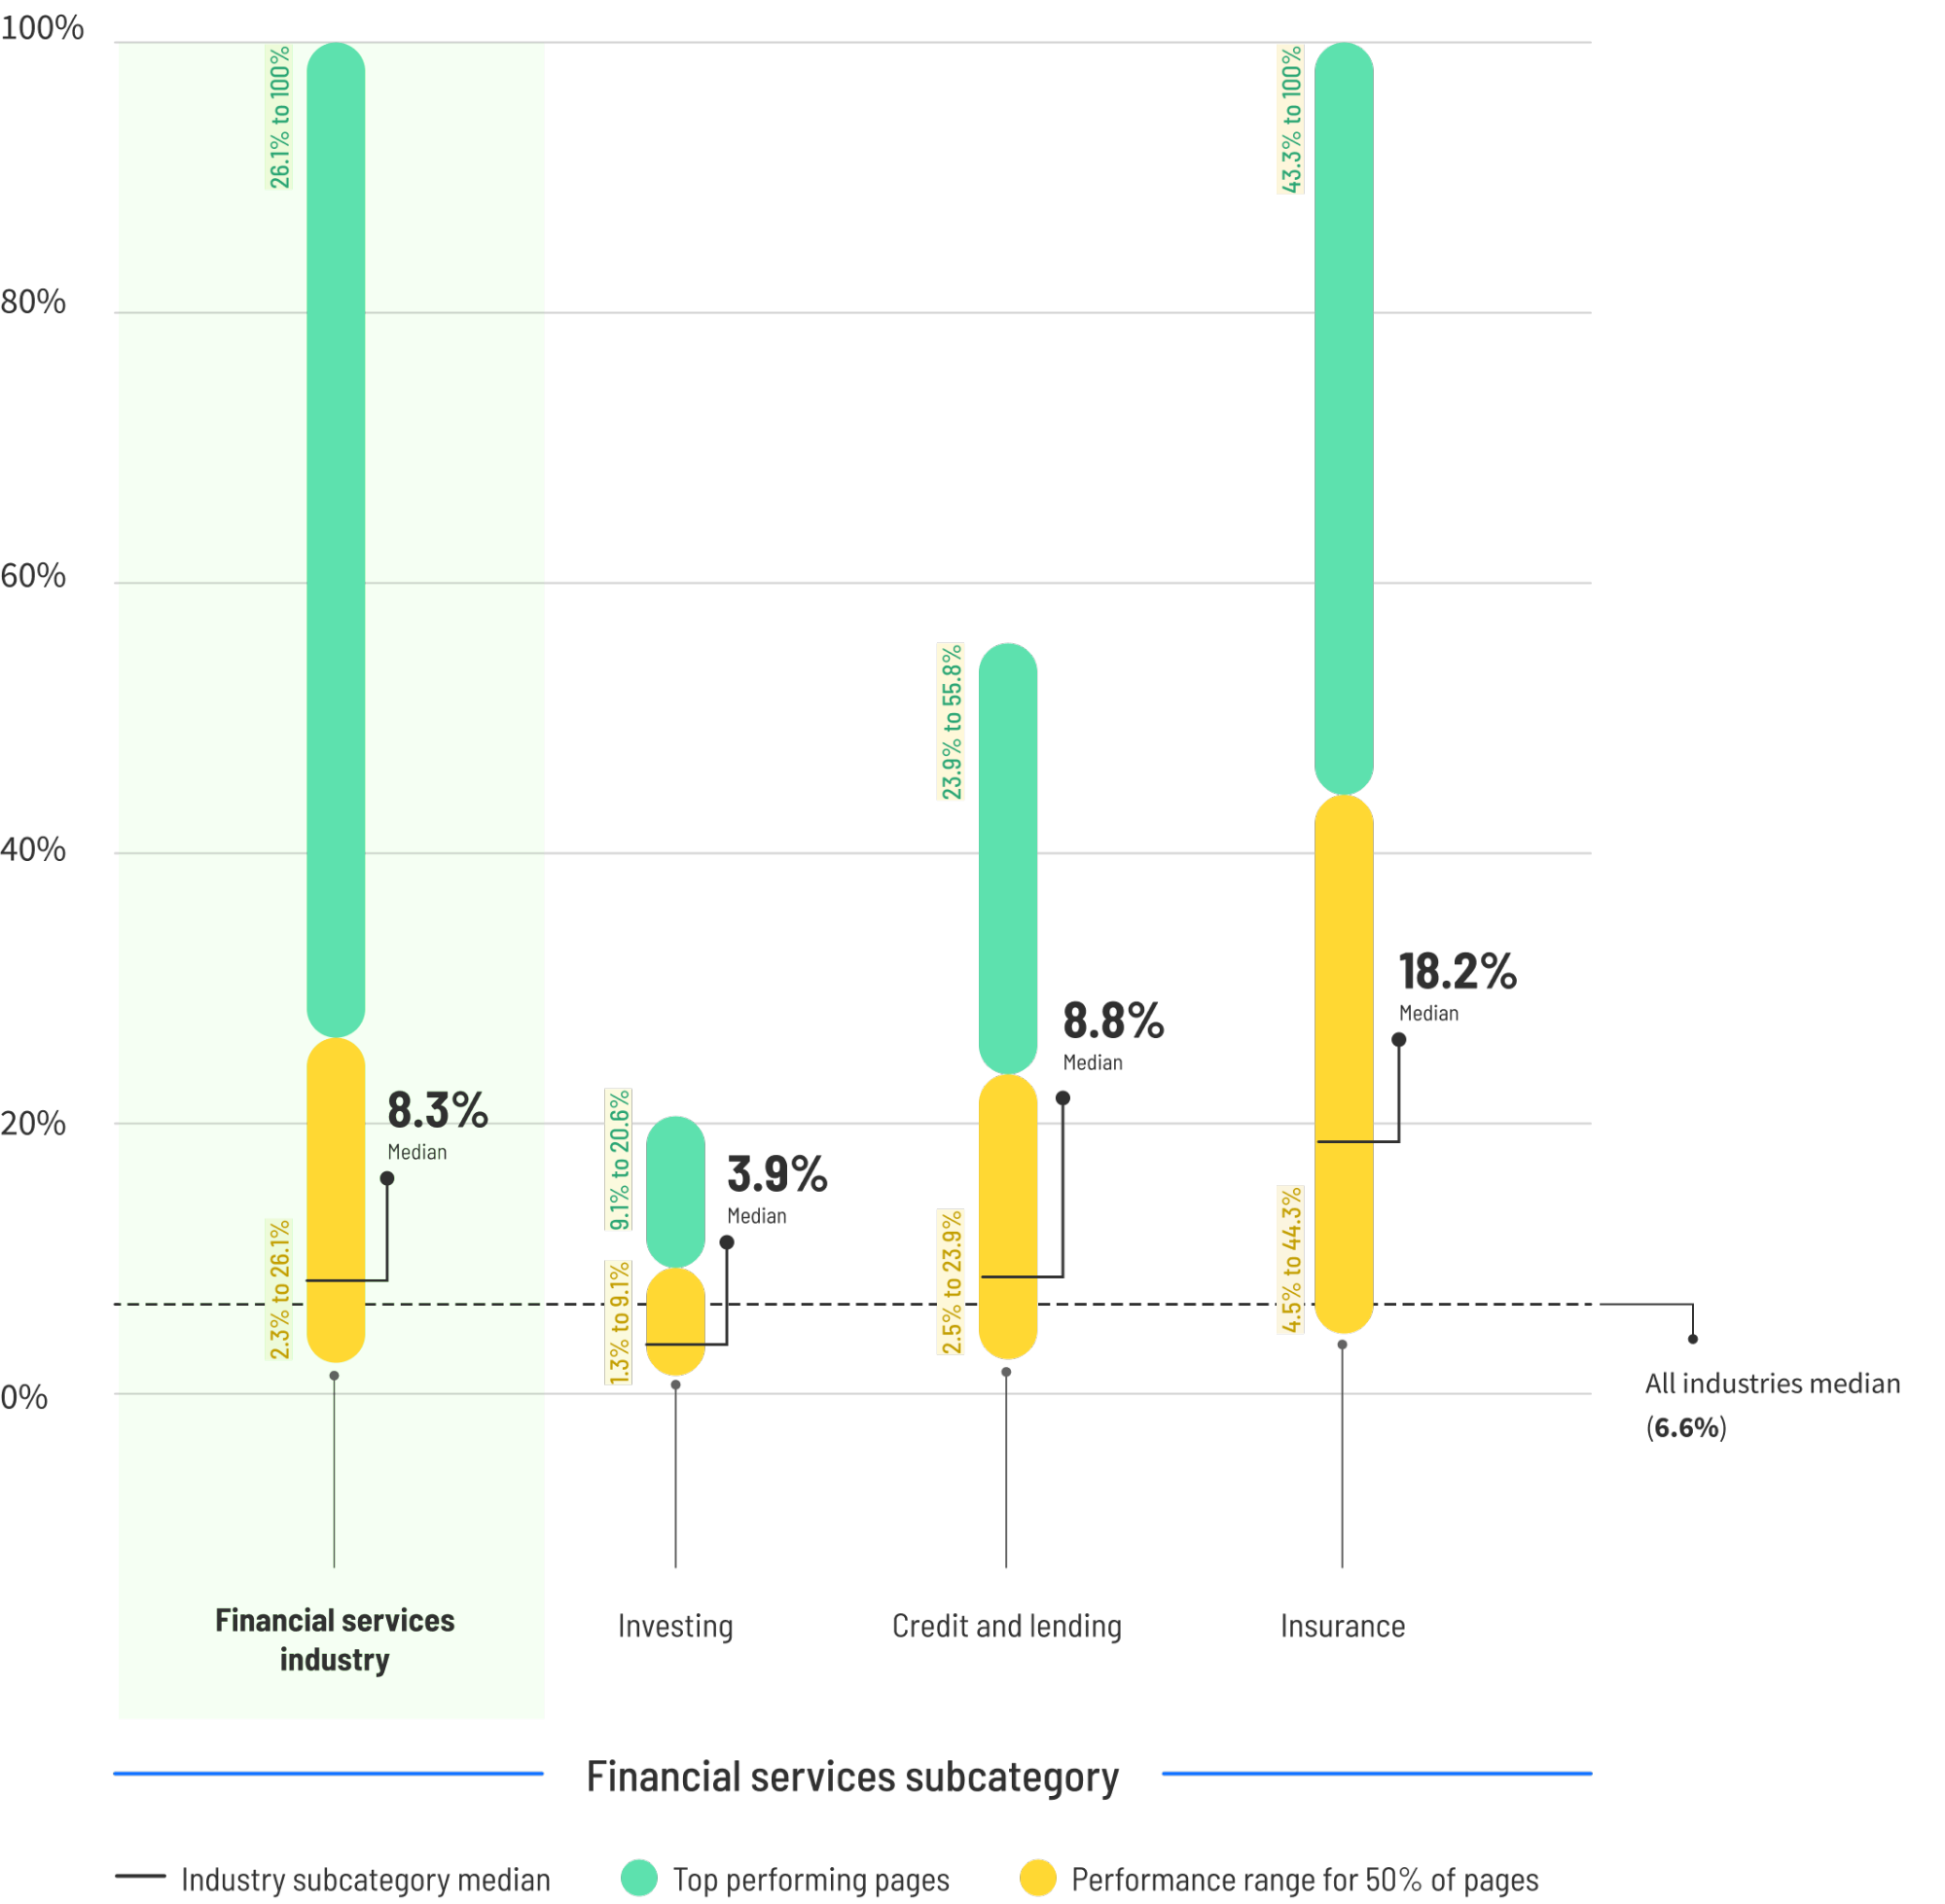
Financial services and legal sectors continue to outperform broader market averages due to the high-intent nature of their traffic. The median conversion rate for financial services is 8.3%, with insurance-specific pages reaching a notable 18.2%. Interestingly, the financial sector is one of the few areas where mobile traffic significantly outperforms desktop, converting 27.8% better on handheld devices.
The legal industry follows a similar pattern, with a median rate of 6.3% and a 75th-percentile floor of 13.1%. Legal services see a distinct "mobile surge," with conversion rates of 21% on mobile versus 15.9% on desktop. Market analysts suggest this is due to the "emergency" nature of legal needs; individuals involved in accidents or legal disputes often search for representation via smartphones immediately following an incident. Consequently, paid search traffic in the legal sector converts nearly twice as well as any other channel, as users click on the first reputable result they find during a crisis.
The Outliers: Education and Entertainment Benchmarks
Education and entertainment sectors represent the highest baseline conversion rates in the 2024 report. The education sector boasts a median conversion rate of 9.4%, driven largely by online courses, which see a median rate of 18.3%. These pages capitalize on the "solution-oriented" mindset of consumers looking to gain specific skills quickly. Top-quartile education pages are currently hitting conversion rates of 20% or higher.
The entertainment industry, however, holds the record for the highest individual subcategory performance. While the industry median is 12.1%, sweepstakes and contest landing pages are converting at a median of 47.5%. The most successful of these pages reach conversion rates as high as 79.8%. Experts note that these high figures are often the result of low-friction conversion actions, such as simple email signups, which require far less commitment than a financial transaction or a multi-field lead form.
Strategic Optimization and the Impact of Cognitive Load
A critical finding in the 2024 performance data is the direct correlation between reading ease and conversion success. Analysis indicates that landing pages written at a 5th-to-7th-grade reading level convert at 11.1%, which is 56% higher than pages written at an 8th-to-9th-grade level. When language becomes overly "professional" or jargon-heavy (10th-grade level and above), conversion rates drop by more than half.
This data suggests that reducing "cognitive load"—the mental effort required to process information—is a primary driver of conversion. By simplifying copy, shortening sentences, and removing industry-specific buzzwords, marketers can make their value propositions more accessible to a broader audience, thereby increasing the likelihood of a successful conversion.
Mobile Dominance and the UX Gap
As of 2024, mobile devices account for 83% of all landing page visits. Despite this overwhelming dominance in traffic volume, mobile conversion rates frequently lag behind desktop counterparts in several industries. This "UX Gap" represents a significant area of opportunity for optimization.
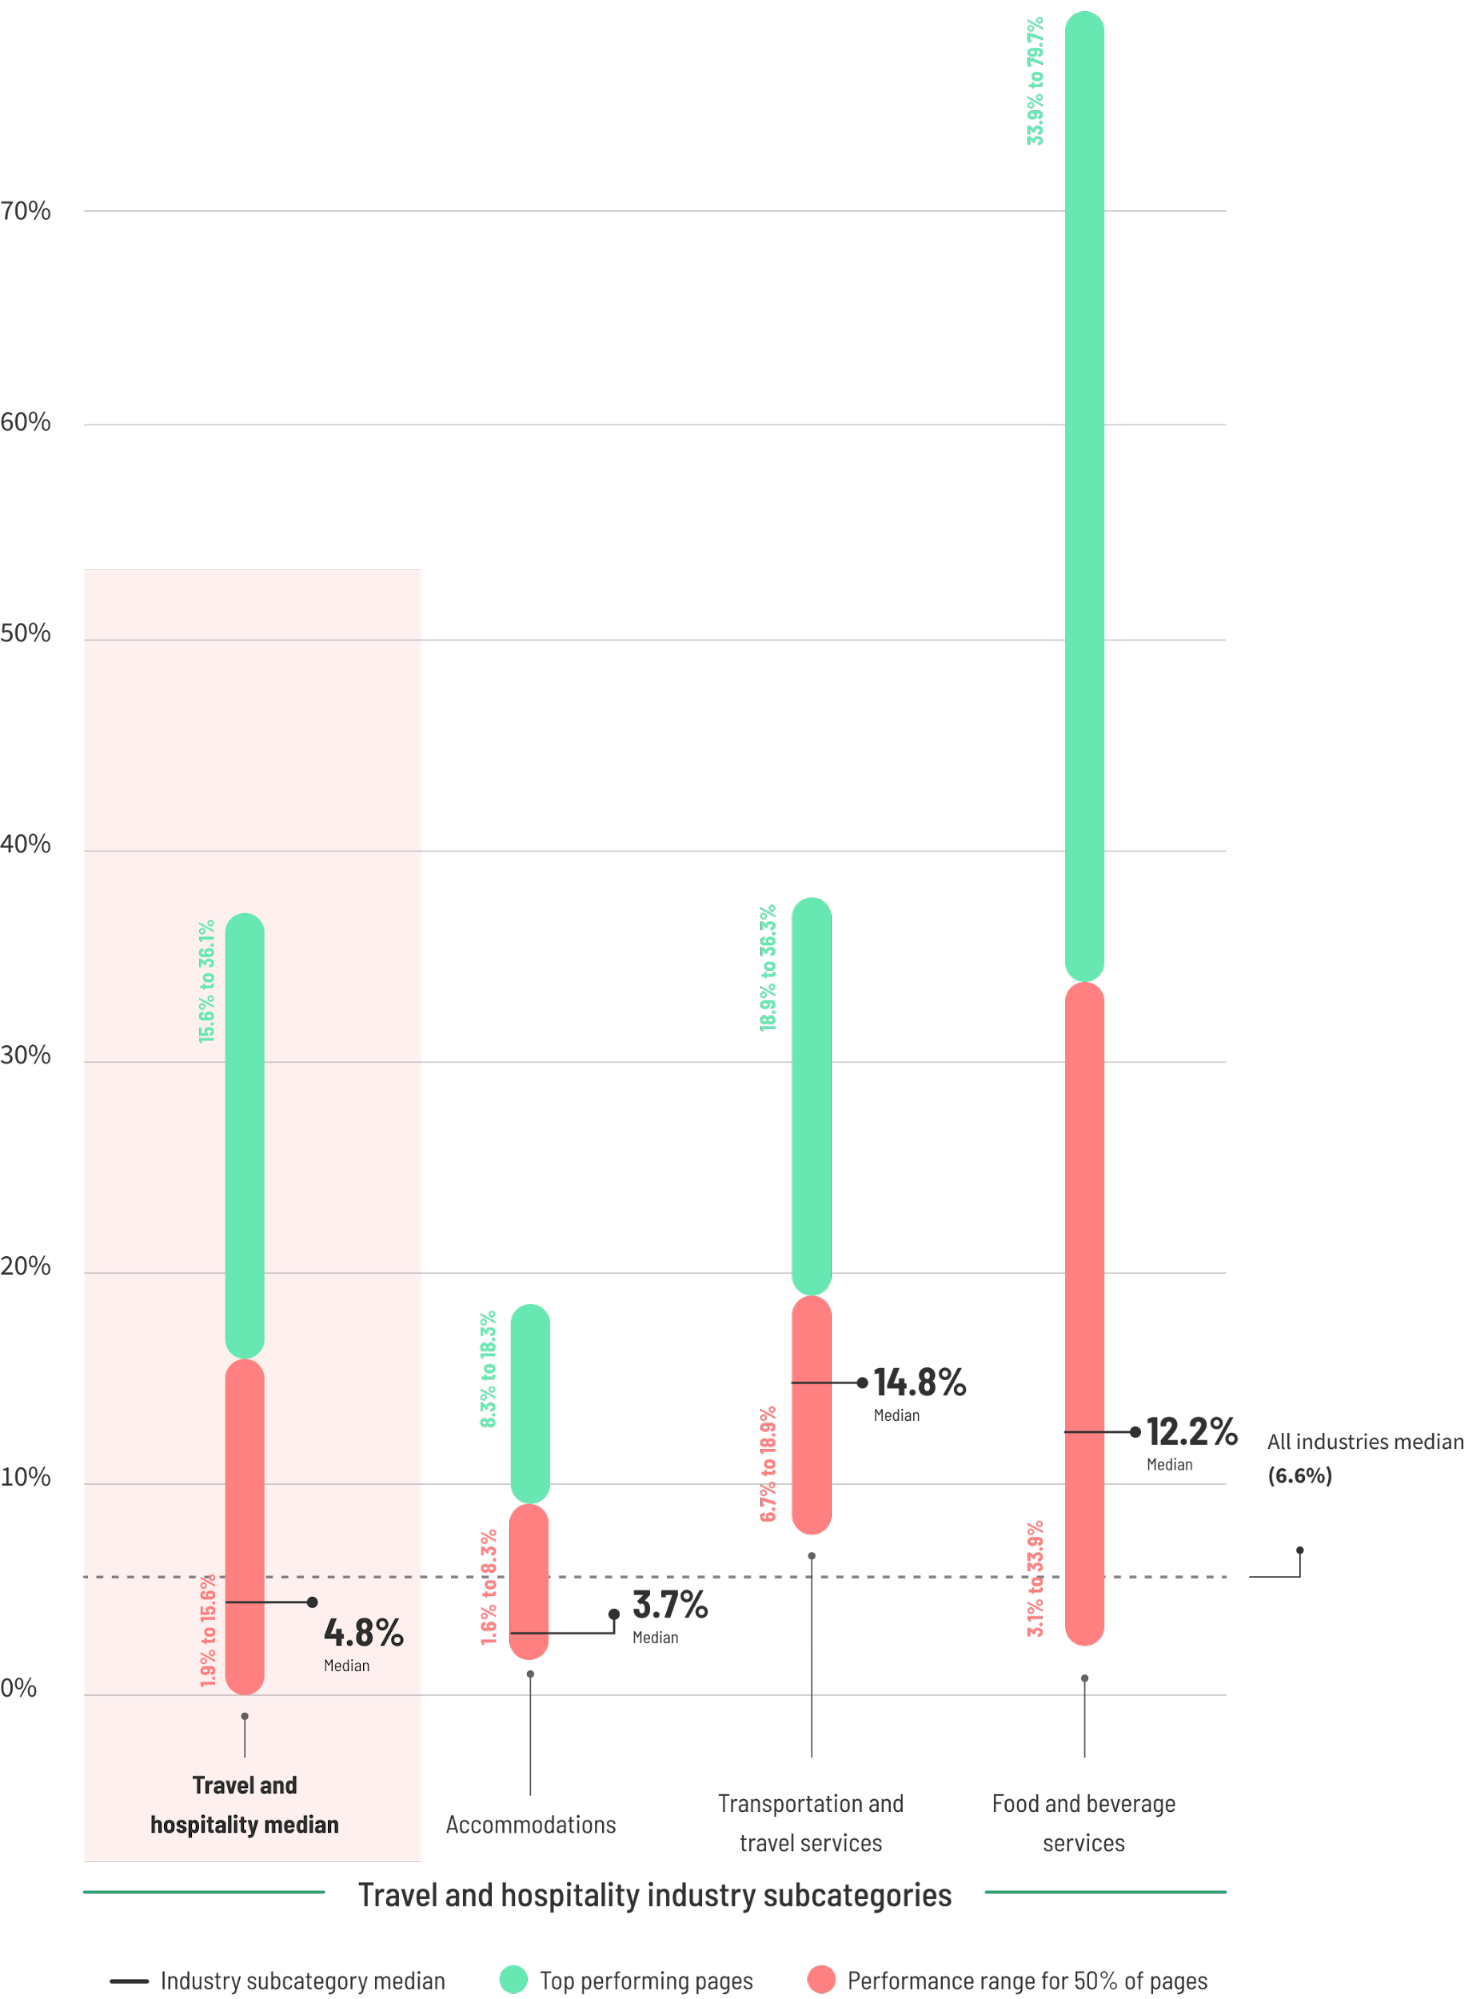
High-performing brands are increasingly adopting "mobile-first" design strategies, ensuring that pages are not just responsive, but specifically optimized for touch-based navigation and rapid loading. In sectors like travel and hospitality, where desktop still converts 10.4% better than mobile, the data suggests that while users perform initial research on their phones, they often return to a desktop to complete complex bookings. Bridging this gap through cross-device tracking and simplified mobile checkout processes is a key priority for the coming year.
Broader Implications and the Role of First-Party Data
The continued rise in conversion benchmarks coincides with a broader shift in the digital advertising ecosystem toward privacy-first marketing. With the deprecation of third-party cookies and increased regulation of data tracking, the landing page has become a vital tool for capturing first-party data.
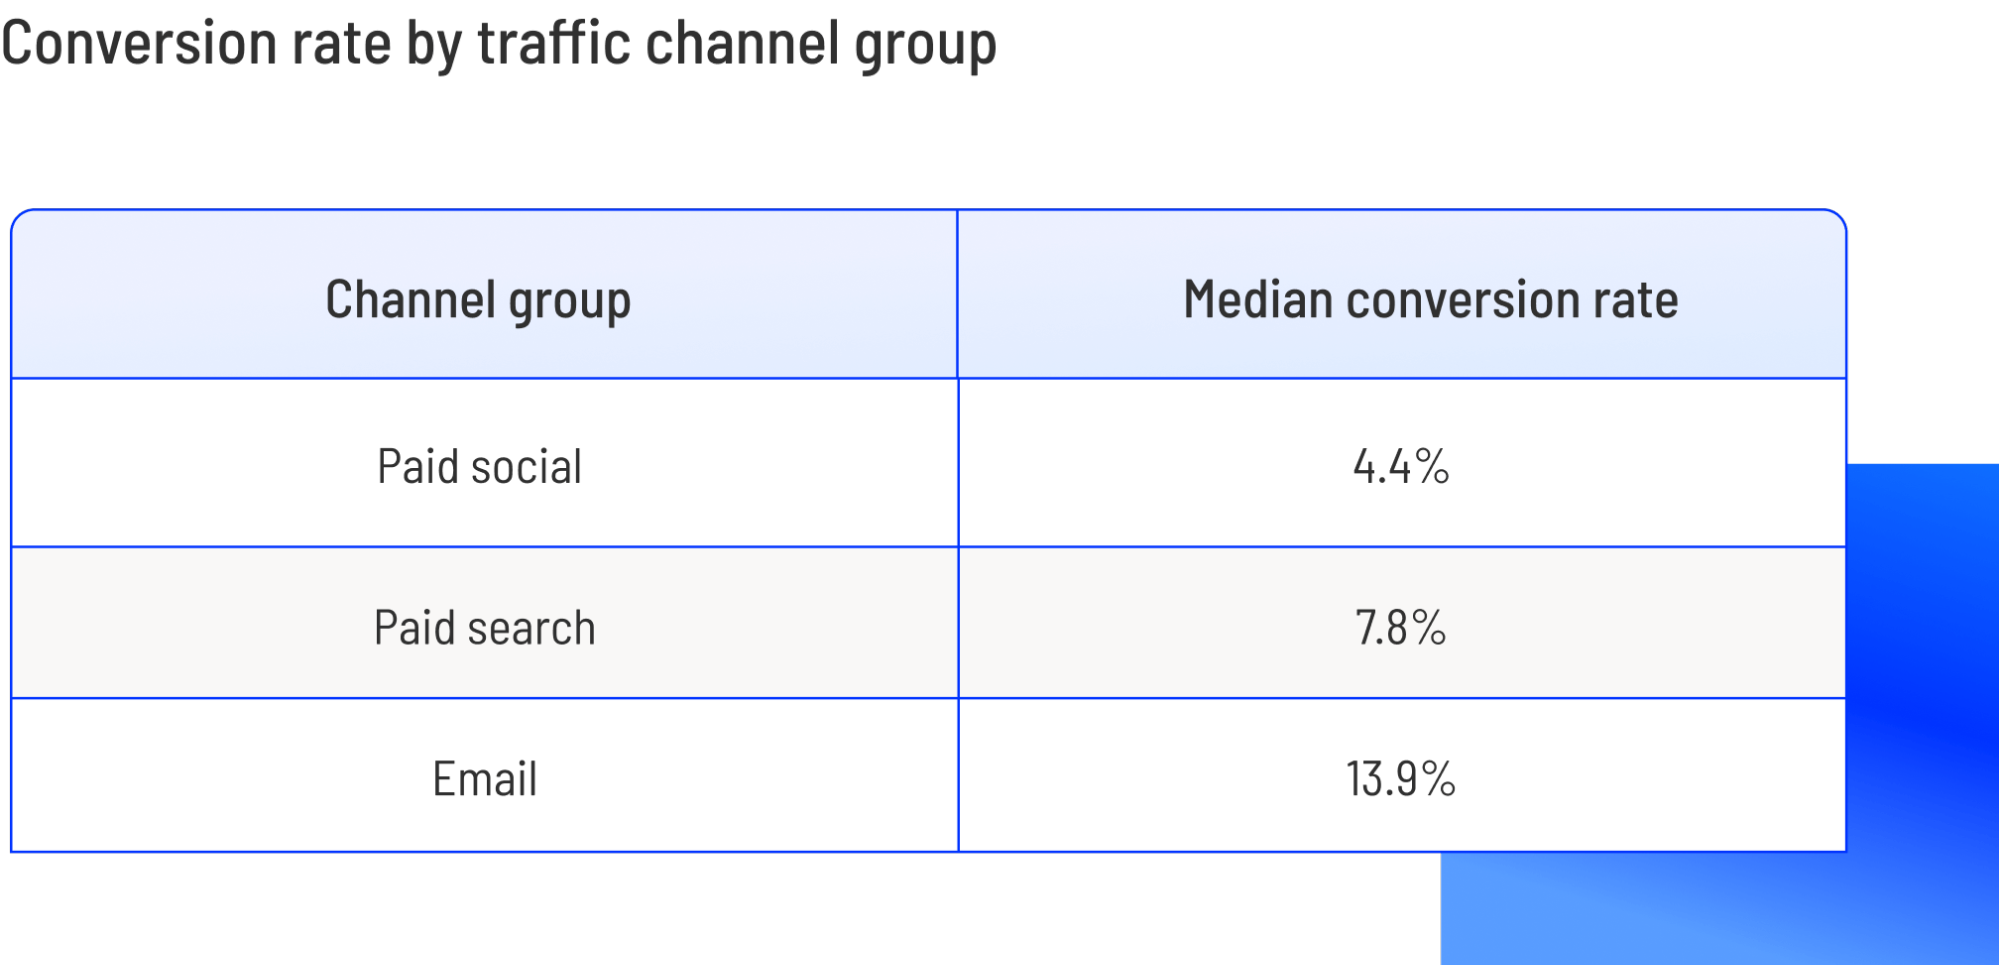
Email remains the highest-converting traffic source in several industries, including professional services (14%) and education (14.1%). This underscores the importance of a "nurture-first" strategy, where landing pages are used to build an owned audience rather than relying solely on expensive paid search or social channels. By capturing an email address through a high-converting landing page, businesses can bypass the rising costs of ad platforms and maintain a direct line of communication with their prospects.
Conclusion: The Path to Outperforming Benchmarks
The 2024 data demonstrates that while a 6.6% conversion rate is the current median, it is merely a starting point. The gap between average and excellent performance is wider than ever, representing a massive opportunity for businesses that approach conversion rate optimization (CRO) systematically.
Success in the 2025 marketing cycle will likely depend on four pillars:
- Messaging Clarity: Maintaining a 5th-to-7th-grade reading level to ensure universal accessibility.
- Technical Excellence: Optimizing for the 83% of users arriving via mobile devices.
- Trust Signals: Strategically placing social proof and testimonials near conversion points to mitigate user hesitation.
- Intent Matching: Aligning the offer complexity with the user’s specific traffic source and urgency level.
As digital competition intensifies and customer acquisition costs continue to rise, the ability to convert a higher percentage of existing traffic remains the most effective lever for sustainable business growth. Marketers who move beyond generic averages to embrace industry-specific, data-driven optimization will be best positioned to join the top 25% of performers in their respective fields.