The landscape of digital journalism and data analysis has undergone a significant transformation with the introduction of native embedding features in business intelligence tools, most notably within Google Data Studio. For years, data storytellers faced a persistent friction point: the inability to seamlessly integrate interactive visualizations into the narrative flow of an article. Traditionally, analysts were forced to choose between providing static screenshots, which lack depth, or directing readers away from the primary content via external links to interactive dashboards. This logistical hurdle often resulted in lower engagement rates and a disjointed user experience. However, the release of embedding capabilities has fundamentally altered this dynamic, allowing for the fusion of complex datasets with long-form editorial content. A prime example of this technological application is the ongoing comparative analysis of the Marvel Cinematic Universe (MCU) and the DC Extended Universe (DCEU), a rivalry that serves as a high-stakes case study for data-driven entertainment reporting.
The Integration of Interactivity in Modern Reporting
In the current media environment, the goal of a data story is to allow readers to interact with information quickly and effectively. Static images, while useful for highlighting specific points, fail to accommodate the diverse interests of a modern audience. One reader might be interested in the global box office revenue of a specific franchise, while another may wish to filter data by critical reception or release date. By leveraging Google Data Studio’s embedding feature, publishers can now provide a "choose-your-own-adventure" style of data consumption. This feature serves as an essential tool for data journalists and analysts, empowering them to share insights without requiring the audience to navigate away from the publication’s ecosystem.
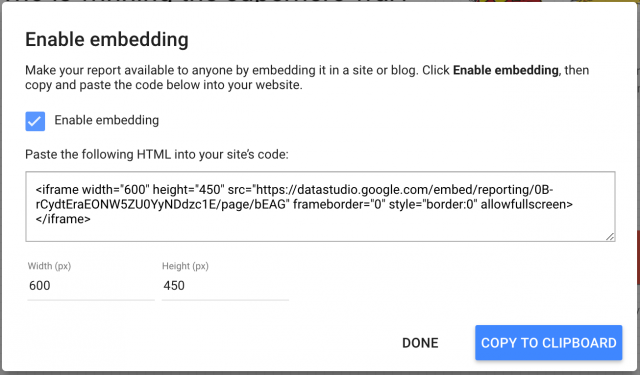
The technical process for enabling this integration involves a straightforward administrative workflow. Users must first enable the embedding functionality within the Data Studio interface, which generates an HTML iframe snippet. This snippet can be customized to fit the specific dimensions of a website’s content area. Furthermore, the tool provides options for "Fit to width" or "Actual size" display modes, which are critical for maintaining the integrity of the data across different device categories. As mobile traffic continues to dominate web consumption, the ability for an interactive chart to respond to screen size is no longer a luxury but a technical necessity.
Chronology of the Marvel vs. DC Cinematic Expansion
To understand the efficacy of interactive reporting, one must look at the data being visualized. The rivalry between Marvel and DC on the big screen has provided a wealth of data points over the last decade. A year-over-year comparison reveals a distinct divergence in strategy and results. When the initial "Marvel vs. DC" visualization was launched, the market was still processing the early phases of the DCEU. Fast forward twelve months, and the dataset has expanded to include five significant new entries: Doctor Strange, Guardians of the Galaxy Vol. 2, Spider-Man: Homecoming, Wonder Woman, and Justice League.
The inclusion of these films shifted the analytical needle. For instance, Wonder Woman (2017) represented a critical and commercial turning point for DC, proving that the franchise could achieve high critical acclaim (holding a 93% rating on Rotten Tomatoes) alongside massive box office success ($821 million worldwide). Conversely, Marvel’s Spider-Man: Homecoming demonstrated the power of brand collaboration, successfully integrating a legacy character into the MCU with a $880 million global haul. The chronology of these releases shows a rapid acceleration in production schedules, with both studios moving toward a multi-film per year release cycle, necessitating more robust data tools to track their relative performance.
Supporting Data: Quantitative Trends in Superhero Cinema
Data analysis of the two franchises reveals several key performance indicators (KPIs) that define their standing in the industry. As of the most recent updates to the comparative reports, the MCU has consistently outperformed the DCEU in terms of average critical score and box office stability.
- Critical Reception: The MCU maintains an average Rotten Tomatoes score of approximately 84%, whereas the DCEU has historically fluctuated more wildly, with scores ranging from 27% (Suicide Squad) to 93% (Wonder Woman).
- Box Office Multipliers: A crucial metric for analysts is the "multiplier"—the ratio of the total domestic box office to the opening weekend earnings. Marvel films often show higher multipliers, indicating "legs" or sustained interest driven by positive word-of-mouth.
- Production Efficiency: By visualizing the relationship between budget and global return, analysts can see that while both studios spend heavily (often upwards of $200 million per film), Marvel’s lower-tier characters (e.g., Ant-Man) often yield higher profit margins relative to their cost than DC’s flagship characters during the same period.
The ability to embed these specific charts directly into an article allows the reader to hover over data points and see the exact figures for Logan or Thor: Ragnarok, providing a level of transparency that static text cannot match.
Technical Implementation and Best Practices
For organizations looking to adopt this style of reporting, understanding the technical nuances of iframe embedding is vital. The content area of most professional news sites is typically between 600px and 800px wide. When a Data Studio report is embedded, the analyst must ensure that the "Display mode" is set to "Fit to width" within the page settings. This ensures that as a user switches from a desktop monitor to a smartphone, the visualization scales appropriately.
However, full reports can sometimes become overwhelming on smaller screens. A best practice in data journalism is to break down a comprehensive dashboard into "digestible insights." Instead of embedding a ten-page report, an analyst might embed three separate, single-page reports throughout the article. This allows the text to provide context for a specific chart before the reader moves on to the next data point. While current limitations in some tools require creating separate report files to embed individual pages, the effort is justified by the resulting increase in reader comprehension and retention.
Industry Reactions and the Shift in Data Accessibility
The move toward embedded interactivity has been met with positive reactions from both the tech community and editorial newsrooms. Industry analysts suggest that Google’s decision to open up embedding for Data Studio was a direct response to the growing demand for accessible business intelligence. Previously, high-end tools like Tableau offered similar features, but often at a price point or complexity level that was prohibitive for independent bloggers or smaller news outlets.
By democratizing these tools, Google has allowed for a more "refereed" approach to cultural debates. In the Marvel vs. DC conflict, the data serves as the ultimate impartial judge. Fans may argue over which film is better based on subjective taste, but the embedded visualizations provide an objective framework based on financial and critical metrics. This "data as a referee" concept is becoming a staple in sports journalism, political reporting, and financial news.
Broader Impact and Future Implications
The implications of embedded data storytelling extend far beyond the realm of comic book movies. This technology represents a shift in how information is synthesized and consumed in the digital age. As datasets become larger and more complex, the ability of the average reader to parse raw information decreases. Interactive visualizations act as a bridge, translating "big data" into relatable stories.
In the future, we can expect even deeper integration, such as real-time data streaming into embedded reports. Imagine a news article about an ongoing election or a live stock market event where the charts update automatically as new data points are recorded, all without the reader needing to refresh the page. For now, the ability to embed static-yet-interactive snapshots of historical data—like the performance of film franchises over a decade—is a significant step forward.
The transition from linking to data to embedding data marks the maturation of the digital article. It transforms the reader from a passive observer into an active participant. As tools like Google Data Studio continue to evolve, the barrier between complex analysis and public understanding will continue to thin, making for a more informed and engaged global audience. The "war" between Marvel and DC may continue for decades, but the tools we use to track that war have finally caught up to the scale of the spectacle.