Digital marketing has long positioned A/B testing as its most scientific frontier, leveraging randomized controlled trials to optimize user experiences and drive revenue. These experiments, which mirror the methodologies used in physics, genetics, and clinical medicine, are designed to eliminate confounding variables and establish clear causal relationships between a change in a digital asset and a shift in user behavior. However, a growing consensus among data scientists suggests that the common practices and statistical frameworks used by most marketing practitioners are lagging nearly half a century behind the modern approaches utilized in other scientific disciplines. The reliance on "classical" statistical significance tests without accounting for modern complexities has led to a crisis of reliability in the field of Conversion Rate Optimization (CRO).
The fundamental issue lies in the application of statistical models that were originally designed for environments like agriculture or physics, where data collection is often static and evaluations occur at a single, predetermined point in time. In the fast-paced world of digital commerce, these models are frequently misused, leading to three primary systemic failures: the misuse of significance tests through "data peeking," a pervasive lack of consideration for statistical power, and a general inefficiency that wastes both time and financial resources.
The Pitfalls of "Data Peeking" and Optional Stopping
In most A/B testing literature, the concept of "statistical significance" is treated as a gold standard. Generally, this refers to an estimation of the probability of observing a result as extreme as the one recorded, assuming there is no true difference between the variants—a concept known as the p-value. However, classical tests, such as the Student’s T-test, come with a rigid constraint: the sample size must be fixed in advance.
The reality of the marketing department stands in stark contrast to this requirement. Tests often run for weeks, and stakeholders—driven by the pressure to maximize ROI or minimize losses—monitor results daily. When a variant shows an early lead or a sharp decline, there is an almost irresistible urge to "stop the test early" to either implement the winner or cut losses. This practice, known as data-driven optional stopping or "data peeking," invalidates the error guarantees of classical significance tests.
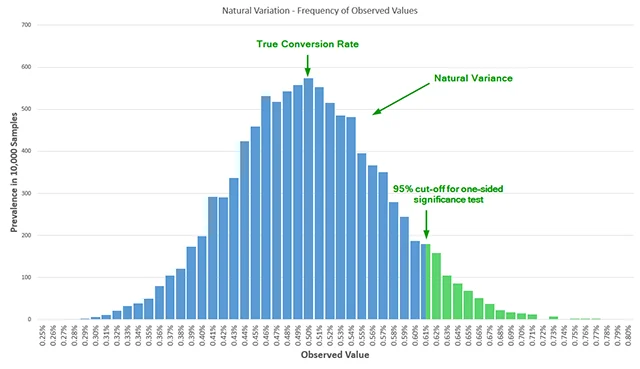
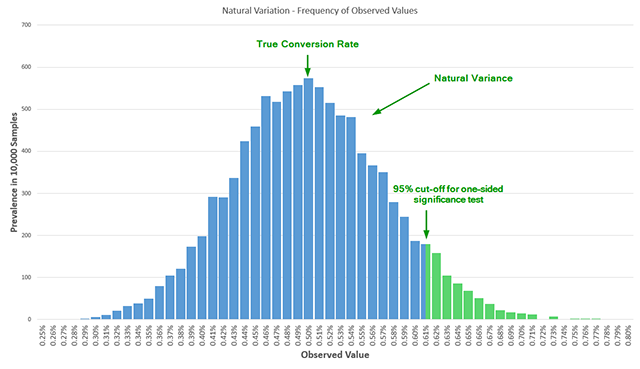
Statisticians have known since at least 1969 that multiple looks at accruing data significantly inflate the false positive rate. For instance, if a practitioner peeks at the data just twice before the scheduled end of a test, the actual error rate is more than double the reported nominal error. Peeking five times increases the error rate by 3.2 times, and ten peeks can result in an error rate five times higher than what the software reports. Without adjusting the statistical model to account for these multiple analyses, the result is "Garbage In, Garbage Out," where "winners" are declared based on random variance rather than true lift.
The Invisible Pillar: Understanding Statistical Power
While significance focuses on avoiding false positives (Type I errors), statistical power is concerned with avoiding false negatives (Type II errors). Power, often referred to as "test sensitivity," is the probability that a test will detect a true effect of a certain size. Despite its importance, a 2014 review of seven influential books on A/B testing found that only one mentioned statistical power in a proper context, and even then, the coverage was superficial.
Running an under-powered test is essentially an exercise in resource waste. If a test lacks the sensitivity to detect a 5% lift, a variant that actually provides that lift might be discarded as a failure. This leads to a "true negative" being misinterpreted as a "false negative," potentially barring a company from pursuing a strategic direction that would have yielded significant gains.
Power is inextricably linked to sample size. To design a rigorous test, a practitioner must pre-define four parameters: the historical baseline conversion rate, the desired significance threshold (usually 95%), the desired power (often 80% or 90%), and the Minimum Detectable Effect (MDE). Many free online calculators operate at a default power of 50%—essentially a coin toss—which is insufficient for business-critical decisions. When practitioners begin to use proper power calculations, they often find that the required sample sizes are much larger than anticipated, forcing a difficult compromise between the duration of the test and the certainty of the results.
The Evolution of Experimental Design: From Agriculture to Medicine
The inefficiency of classical statistical tests in A/B testing scenarios stems from their origins. Early 20th-century statistics, championed by figures like Ronald Fisher, were largely focused on agricultural experiments where one would plant seeds, wait for the harvest, and analyze the results once. There was no "interim monitoring" of how the wheat was growing to decide whether to stop the experiment.
In contrast, the medical field evolved to require more flexible, "agile" models. In clinical trials, it is often unethical to continue a test if a new drug is clearly saving lives or, conversely, causing harm. This necessity led to the development of sequential analysis and group sequential designs, which allow for interim data monitoring while maintaining strict control over error rates.
Digital marketing mirrors the medical field more than the agricultural one. The financial stakes of a failing checkout page are an "ethical" emergency for a business, just as a failing drug is for a patient. Yet, the tools used by many marketers remain stuck in the "agricultural" phase of fixed-sample testing, leading to tests that run too long when a result is already clear, or tests that are stopped too early without the mathematical justification to do so.
Introducing the AGILE Statistical Method
To resolve the tension between statistical rigor and the practical needs of business, a new framework has been proposed: the AGILE statistical approach. This method, inspired by clinical randomized controlled trials, provides a step-by-step process for designing and executing experiments that allow for the flexibility practitioners crave without sacrificing scientific integrity.
The AGILE method addresses the "peeking" problem through the application of error-spending functions. This mathematical adjustment allows for interim analyses by "spending" a portion of the allowed error rate at each look. This ensures that the cumulative probability of a false positive remains within the specified threshold (e.g., 5%), regardless of how many times the data is reviewed.
Key features of the AGILE approach include:
- Interim Analysis for Efficacy: If a variant is performing exceptionally well, the AGILE method allows the test to be stopped early for efficacy with full statistical confidence. This allows businesses to realize revenue gains weeks earlier than a fixed-sample test would allow.
- Futility Stopping Rules: One of the most significant additions is the ability to "fail fast." If the data indicates that a variant has almost no chance of reaching significance, the test can be abandoned early. This prevents the "sunk cost fallacy" where teams wait for a test to finish even when the outcome is clearly destined for a null result.
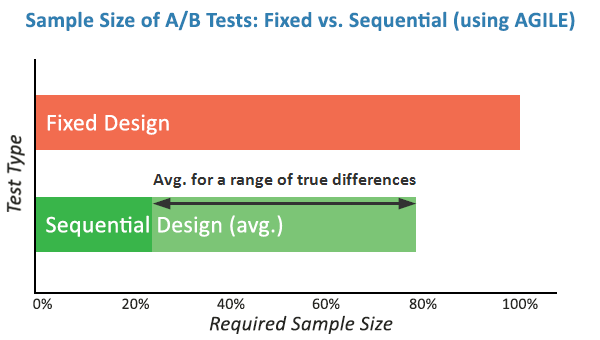
- Efficiency Gains: Simulations have shown that the AGILE method can offer efficiency gains ranging from 20% to 80% compared to classical fixed-sample tests. While some tests may occasionally require more users than a classical test, the average time-to-decision is significantly lower.
Chronology of Statistical Development in Testing
- 1920s-1930s: Ronald Fisher develops the foundations of classical frequentist statistics and experimental design, primarily for agricultural research.
- 1950s-1960s: Medical researchers begin to realize the ethical limitations of fixed-sample trials, leading to the early development of sequential analysis.
- 1969: A landmark study published in journals like JSTOR highlights the "bane" of repeated significance testing, proving that frequent peeking at data inflates error rates.
- 1970s-1980s: Group Sequential Designs and error-spending functions (such as Lan-DeMets) are formalized in biostatistics.
- 2000s: The rise of digital A/B testing platforms brings experimentation to the masses, but often utilizes simplified "Fisherian" models.
- 2014-2017: Critics in the CRO industry begin to highlight the "replication crisis" in marketing, leading to the proposal of the AGILE method and similar "Always Valid Inference" models.
Industry Implications and the Path Forward
The adoption of more sophisticated statistical methods like AGILE represents a maturing of the digital marketing industry. As companies move away from "hunches" and toward data-driven cultures, the quality of that data becomes paramount.
For the practitioner, the AGILE method offers a release from the rigid constraints of classical testing. It acknowledges the reality of stakeholder pressure and the need for speed, but it provides a "safety rail" of mathematical rigor. For the business, it means a more efficient allocation of resources. By stopping losing tests early and implementing winners faster, companies can increase the velocity of their experimentation programs—a key metric for long-term growth.
Ultimately, the shift toward AGILE testing is about aligning the tools of the trade with the reality of the environment. In a landscape where user behavior is volatile and competition is fierce, the ability to make fast, accurate, and scientifically sound decisions is no longer a luxury—it is a necessity for survival in the digital age. The transition from "Garbage In, Garbage Out" to a rigorous, flexible framework marks the next evolution of digital marketing as a true scientific discipline.