

Digital optimization has become a cornerstone of modern business strategy, yet the tools used to measure success often provide an incomplete picture of performance. While standard A/B testing platforms can identify which variation outperformed another during a specific window, they frequently fail to determine if those results are statistically robust enough to inform future product roadmaps or marketing spend. The reliability of an experiment does not rest solely on the data collected, but on the rigor with which that data is analyzed. This guide examines the methodologies, tools, and statistical frameworks necessary to achieve accurate A/B test results using free resources.
The Fundamental Framework of A/B Testing Analysis
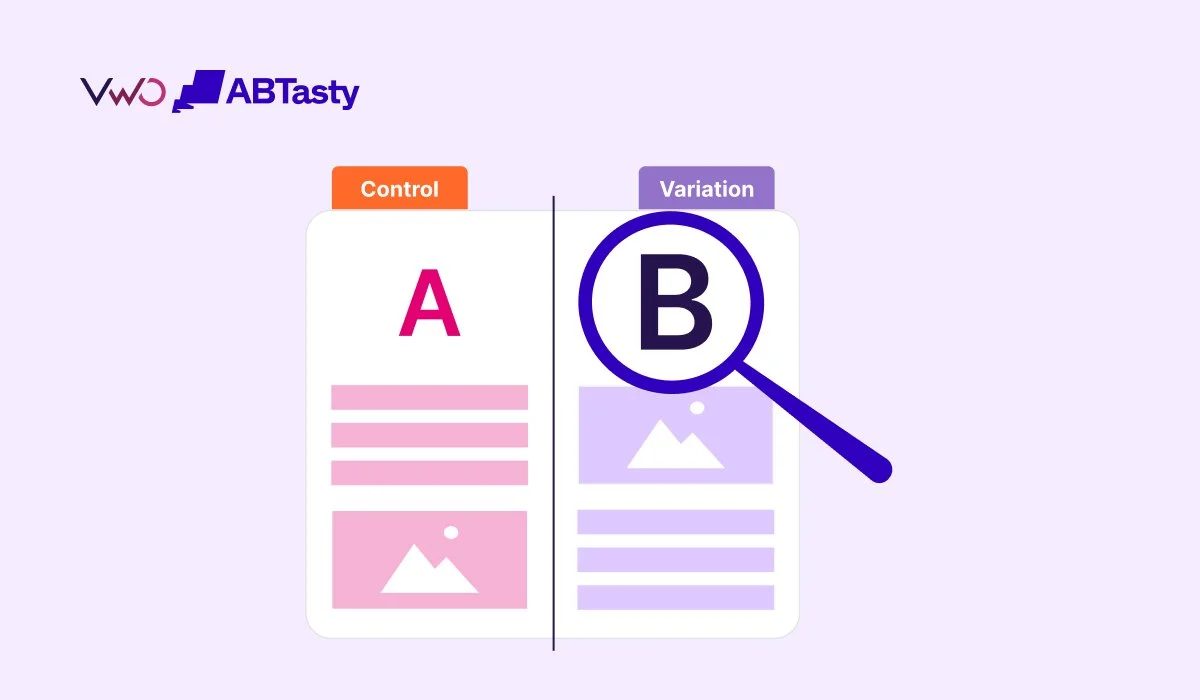
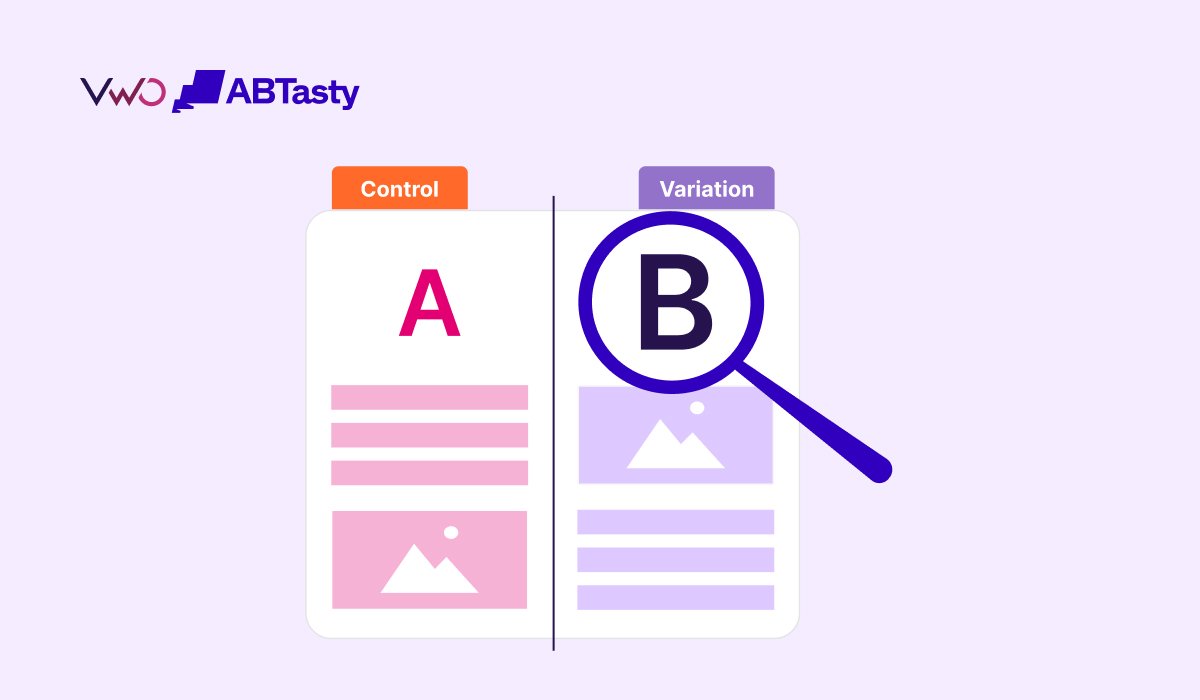
A/B testing, or split testing, is an experimental process where users are randomly assigned to one of two versions of a digital asset: the "Control" (the original version) or the "Variant" (the modified version). The primary objective is to identify which version drives a higher rate of a specific desired action, known as the conversion rate. However, a common pitfall for many growth teams is the "false win"—a scenario where a variant appears to perform better due to random noise or insufficient sample size, only for the gains to vanish once the change is implemented permanently.
To mitigate these risks, the analysis must go beyond simple arithmetic. It involves a multi-layered verification process that includes assessing primary and guardrail metrics, calculating statistical confidence, and monitoring for data quality issues like Sample Ratio Mismatch (SRM). Experts in the field, including Jared Brown, emphasize that the goal of testing is not merely short-term metric inflation but the gathering of insights that drive long-term innovation.
A Chronological Workflow for Accurate Experimentation
The path to a reliable A/B test result begins before the first visitor even lands on the site. Following a structured chronology ensures that the data remains untainted by cognitive biases or procedural errors.
Phase 1: Pre-Test Metric Calibration
The most critical step in any experiment is the pre-test definition of metrics. Analysts must lock in their primary, secondary, and guardrail metrics before reviewing any data. The primary metric is the ultimate measure of success, such as "completed purchases." Secondary metrics provide context, such as "add-to-cart rate," while guardrail metrics ensure that the experiment does not inadvertently damage other areas of the business, such as "customer support tickets" or "page load speed." Changing the primary metric after seeing the results is a practice known as "post-hoc metric switching," a leading cause of false positives in digital experimentation.
Phase 2: Verifying Sample Size and Runtime
Before interpreting conversion data, it is essential to confirm that the experiment has reached its required power. Utilizing tools like Evan Miller’s sample size calculator allows teams to determine the minimum number of visitors needed to detect a specific effect. A general industry standard is to run tests for at least one full business cycle—typically seven to 14 days. This accounts for the natural variance in user behavior between weekdays and weekends. Ending a test prematurely, often referred to as "peeking," significantly inflates the probability of a Type I error (a false positive).
Phase 3: Data Quality and Sample Ratio Mismatch (SRM)
Integrity checks are vital. Analysts must verify that the traffic split between the Control and Variant matches the intended allocation (e.g., 50/50). If the actual traffic distribution deviates significantly from the planned split, it indicates a Sample Ratio Mismatch. SRM is often a symptom of underlying technical issues, such as a tracking script failing on certain browsers or a bot filter affecting one variant more than the other. Any experiment showing SRM must be discarded, as the results are mathematically compromised.
The Statistical Engine: Frequentist vs. Bayesian Models
The methodology used to calculate significance is a point of frequent debate among data scientists. Traditional "Frequentist" models were designed for fixed-sample studies where the data is analyzed only once at the conclusion of the test. However, modern digital marketing often demands real-time monitoring.
The "peeking problem" is the primary weakness of the Frequentist approach in a business setting. If a team checks a 95% confidence result every day and stops as soon as it hits the threshold, the actual reliability may drop as low as 70%.
In response, many advanced platforms and calculators have shifted toward Bayesian sequential testing. Unlike the Frequentist p-value, which measures the probability of seeing the results if there were no real difference, the Bayesian approach calculates the "probability of being better." This model updates continuously as new data arrives, making it more suitable for the iterative nature of A/B testing. Platforms like VWO utilize "SmartStats," a Bayesian engine that includes a Region of Practical Equivalence (ROPE) to determine if a result is not just statistically significant, but commercially meaningful.
Essential Metrics for In-Depth Analysis
A comprehensive analysis requires a dashboard of diverse metrics to tell the full story of user behavior.
- Conversion Rate (CR): The fundamental metric, calculated by dividing unique conversions by unique visitors.
- Click-Through Rate (CTR): A measure of engagement with specific elements like Call-to-Action (CTA) buttons.
- Revenue Per Visitor (RPV): Particularly vital for e-commerce, RPV ensures that a variant increasing conversions isn’t simultaneously lowering the average order value (AOV).
- Funnel Drop-off Rate: This identifies the specific step in a multi-stage process (like a checkout flow) where friction occurs.
- Bounce Rate: A guardrail metric that monitors if a new design is driving users away immediately.
- Time on Page: A proxy for engagement, though it must be analyzed carefully to distinguish between "active interest" and "user confusion."
The Free Tool Ecosystem
For teams operating on limited budgets, a combination of free tools can replicate much of the functionality of expensive enterprise platforms.
- Google Analytics 4 (GA4): While GA4 does not natively conduct A/B tests, it is the premier free tool for data extraction and segmentation. By using custom dimensions to track which variant a user saw, analysts can break down performance by device type, acquisition channel, or geography.
- Evan Miller’s Calculator: A staple for Frequentist sample size planning and post-test significance verification.
- AB Testguide and VWO Significance Calculators: Browser-based tools that allow for quick input of visitor and conversion data to determine percentage lift and confidence levels.
- Google Sheets and Excel: These remain essential for documentation and longitudinal tracking. Manually logging every test result creates an "institutional knowledge" base that prevents future teams from repeating failed hypotheses.
Expert Perspectives and Industry Implications
The move toward more rigorous analysis is a reaction to the "optimization plateau" many companies face. Industry experts argue that the low-hanging fruit of digital optimization—changing button colors or headlines—has largely been picked. Future gains will come from deeper psychological triggers and structural changes, which require more precise measurement.
Haley Carpenter, a noted experimentation strategist, has highlighted that mature teams focus as much on "why" a test failed as they do on "why" it won. A well-documented null result (no significant difference) is valuable because it prevents the company from wasting resources on a change that would not have moved the needle.
The broader impact of accurate analysis is financial. In an era of rising Customer Acquisition Costs (CAC), the ability to incrementally improve conversion rates through reliable testing can be the difference between a profitable and an unprofitable digital channel. Conversely, basing a multi-million dollar product launch on a "false win" from a poorly analyzed A/B test can lead to catastrophic waste.
Best Practices for Sustainable Experimentation
To maintain high standards of analysis, organizations should adopt several key habits:
- Segment Before Declaring Winners: A variant might win overall but fail spectacularly on mobile devices. Always segment results by key demographics and technology.
- Document Everything: Record the hypothesis, the variant description, the confidence levels, and the final decision. This creates a roadmap for future testers.
- Prioritize UX Audits: Use tools like VWO’s free Website UX Audit tool to identify friction points before designing tests. Testing without a research-backed hypothesis is essentially gambling.
- Acknowledge Limitations: Free tools are excellent for starting, but they often lack automated SRM detection and integrated behavioral context (like heatmaps). As testing volume grows, the manual overhead of stitching these tools together may eventually justify an integrated platform.
As digital landscapes become more competitive, the margin for error in A/B testing narrows. By adhering to strict statistical protocols, utilizing the right mix of free tools, and fostering a culture of rigorous analysis, businesses can ensure that their optimization efforts are built on a foundation of fact rather than a facade of noise.







