
 Muslim
The landscape of Software as a Service (SaaS) and mobile subscription applications has undergone a significant shift as the era of "growth at all costs" gives way to a focus on sustainable unit economics and retention. In this climate, pricing has emerged as the most potent lever for revenue growth, yet it remains one of the most misunderstood and poorly executed strategies in the digital economy. Industry data suggests that while a 1% improvement in volume or costs can lead to modest gains, a 1% improvement in pricing can result in an operating profit increase of over 10%. Despite this, a majority of growth teams approach pricing experiments in a reverse-engineered fashion, focusing on superficial tactics while ignoring the structural foundations of their business models.
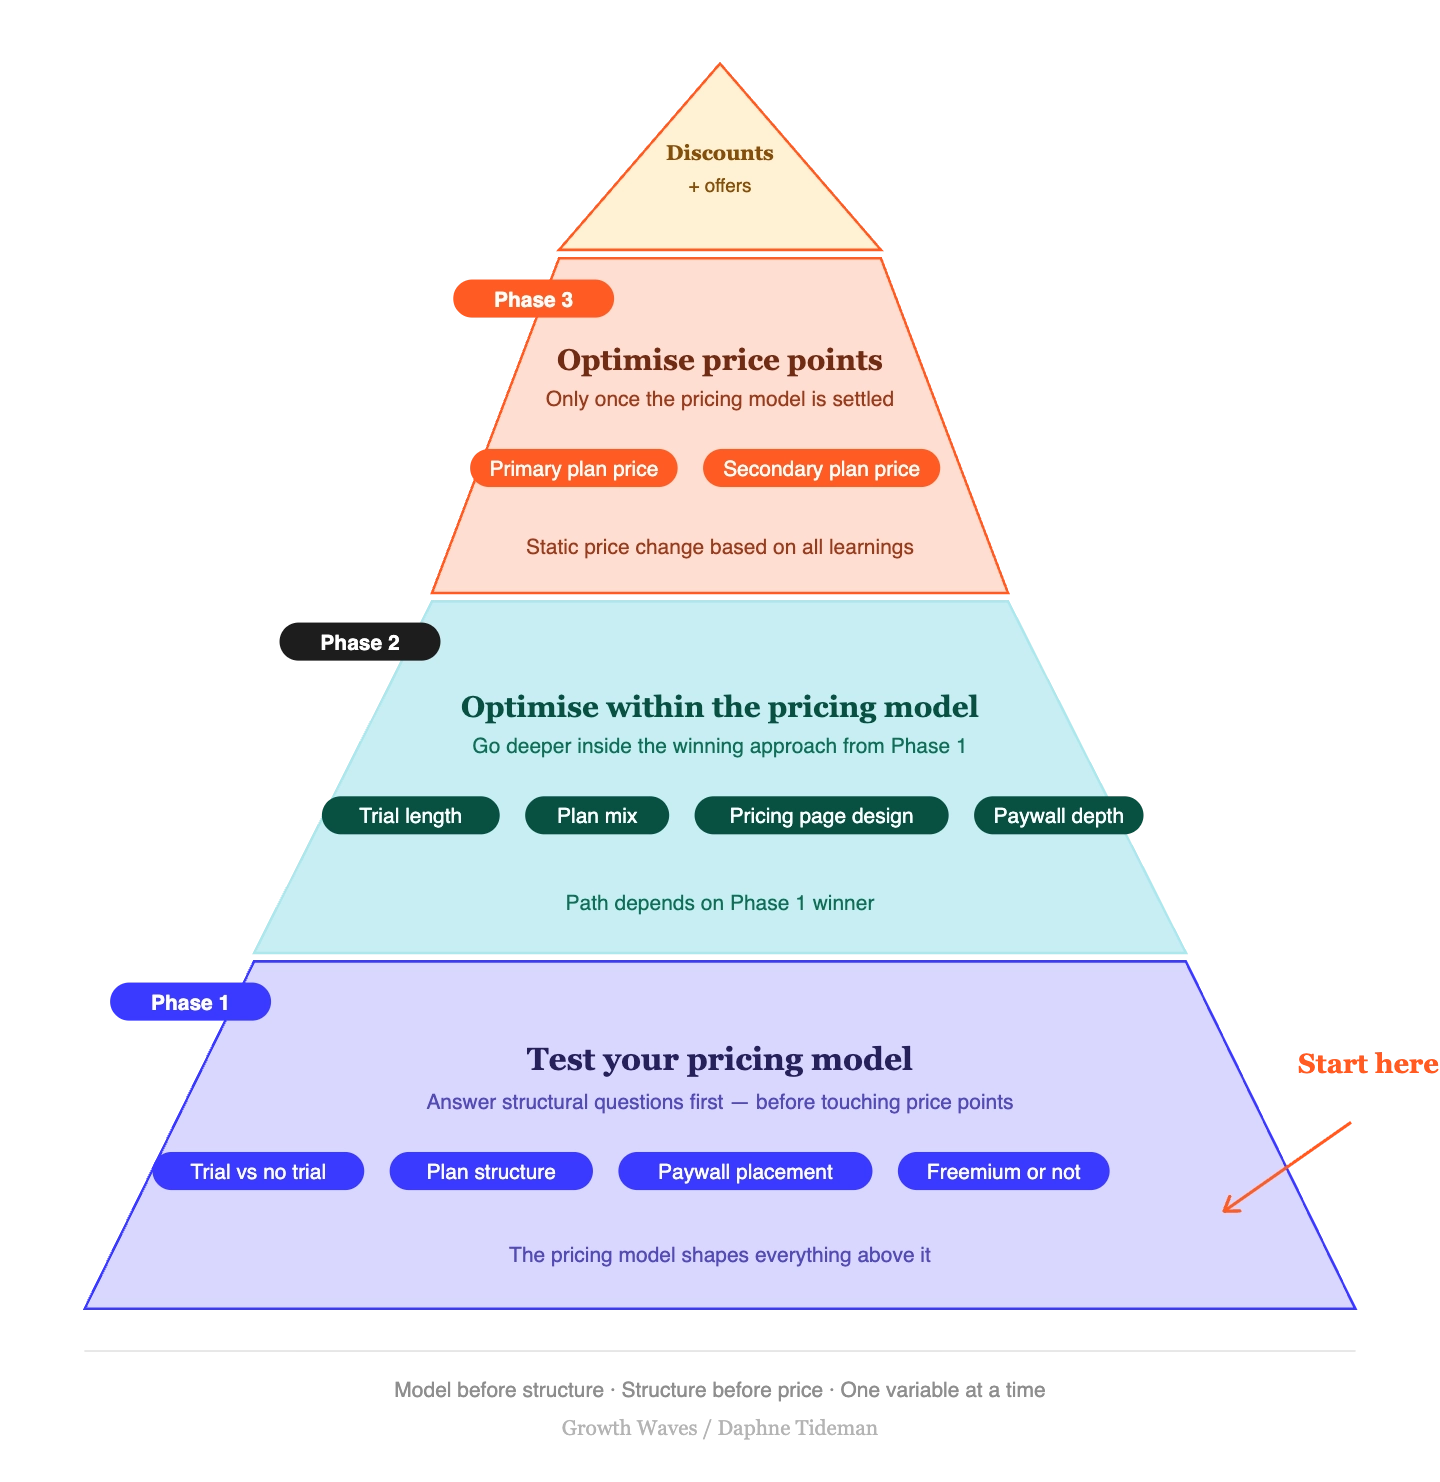
Growth expert Daphne Tideman has introduced a strategic mental model known as the "Pricing Pyramid" to address these systemic failures. This framework posits that pricing decisions must be stacked in a specific hierarchical order: the value metric, packaging, the price point, and finally, tactical optimization. By working from the bottom up, companies can ensure that their monetization strategy aligns with user value, thereby preventing the common pitfall of "flat" A/B tests that lead teams to incorrectly conclude that pricing is not a growth driver.

The Structural Failure of Top-Down Testing
In many subscription-based organizations, the default reaction to stagnating revenue is to adjust price points or offer aggressive discounts. Teams often jump straight to testing a $9.99 versus a $12.99 monthly fee or experimenting with the duration of a free trial. However, when these tests return inconclusive results, the underlying issue is rarely the number itself. Instead, the failure often lies in a "broken foundation"—a misalignment between what the customer values and what the company is charging for.
The diagnostic sequence of the Pricing Pyramid suggests that if a foundational layer is unstable, any optimization performed at the higher levels will yield diminishing returns or misleading data. For instance, if a company changes its price point without first establishing a fair value metric, it may see a short-term lift in revenue followed by a catastrophic spike in churn. This occurs because the price change did not address the fundamental friction in how the product is packaged or sold.
Layer 1: Establishing the Value Metric as the Foundation
The base of the pyramid is the value metric—the specific unit of consumption that determines the price. Common examples include the number of "seats" in a B2B SaaS environment, the amount of data storage used in cloud services, or the number of messages sent in a communication tool. This is the most critical decision in the pricing journey because it dictates the perceived fairness of the transaction.

A growing trend in the industry, driven largely by the rising compute costs of Artificial Intelligence (AI), is the shift toward usage-based pricing. While this model appears logical from a cost-recovery perspective, it can often backfire if it punishes users for engaging with the product. Qualitative research frequently reveals that users who hit usage caps feel "nickeled and dimed," leading them to develop workarounds to avoid hitting limits. This creates a perverse incentive where the product’s success (increased usage) leads directly to customer frustration.
To build a solid foundation, companies must test whether their value metric scales in tandem with the value the customer receives. An effective value metric should feel "fair" to the user; as they derive more utility from the software, they should be willing to pay more. If the metric instead triggers a payment request at the exact moment of highest user friction, it becomes a primary driver of churn that no amount of price-point testing can resolve.
Layer 2: Packaging and the Reduction of Cognitive Load
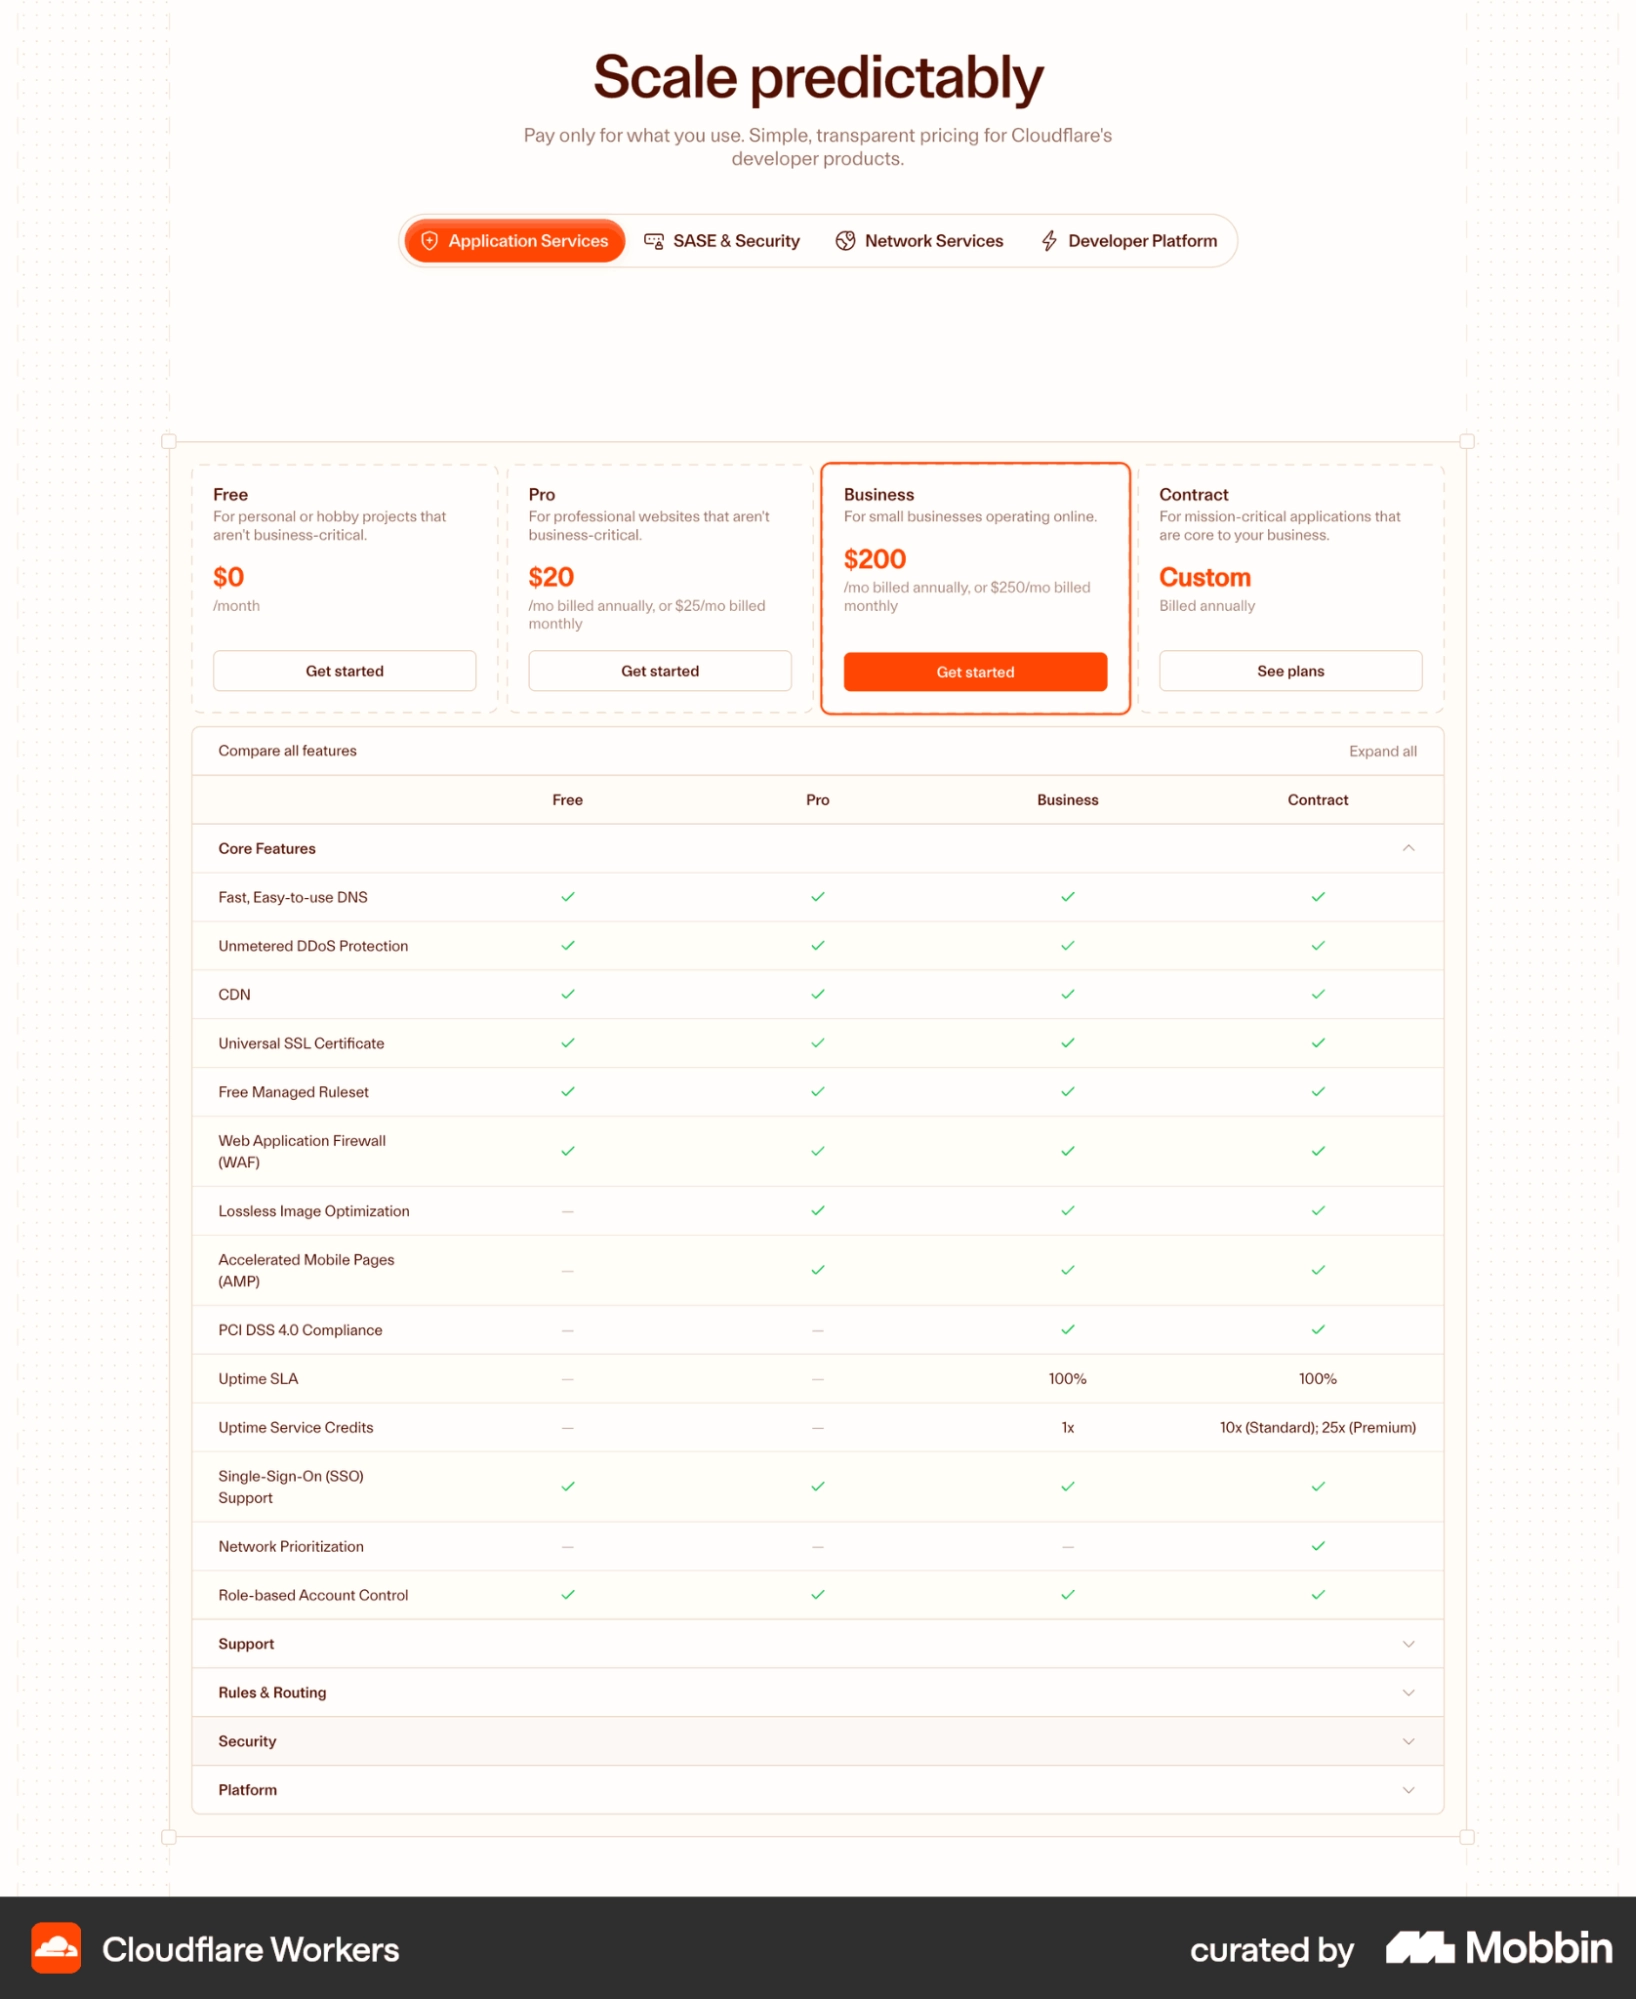
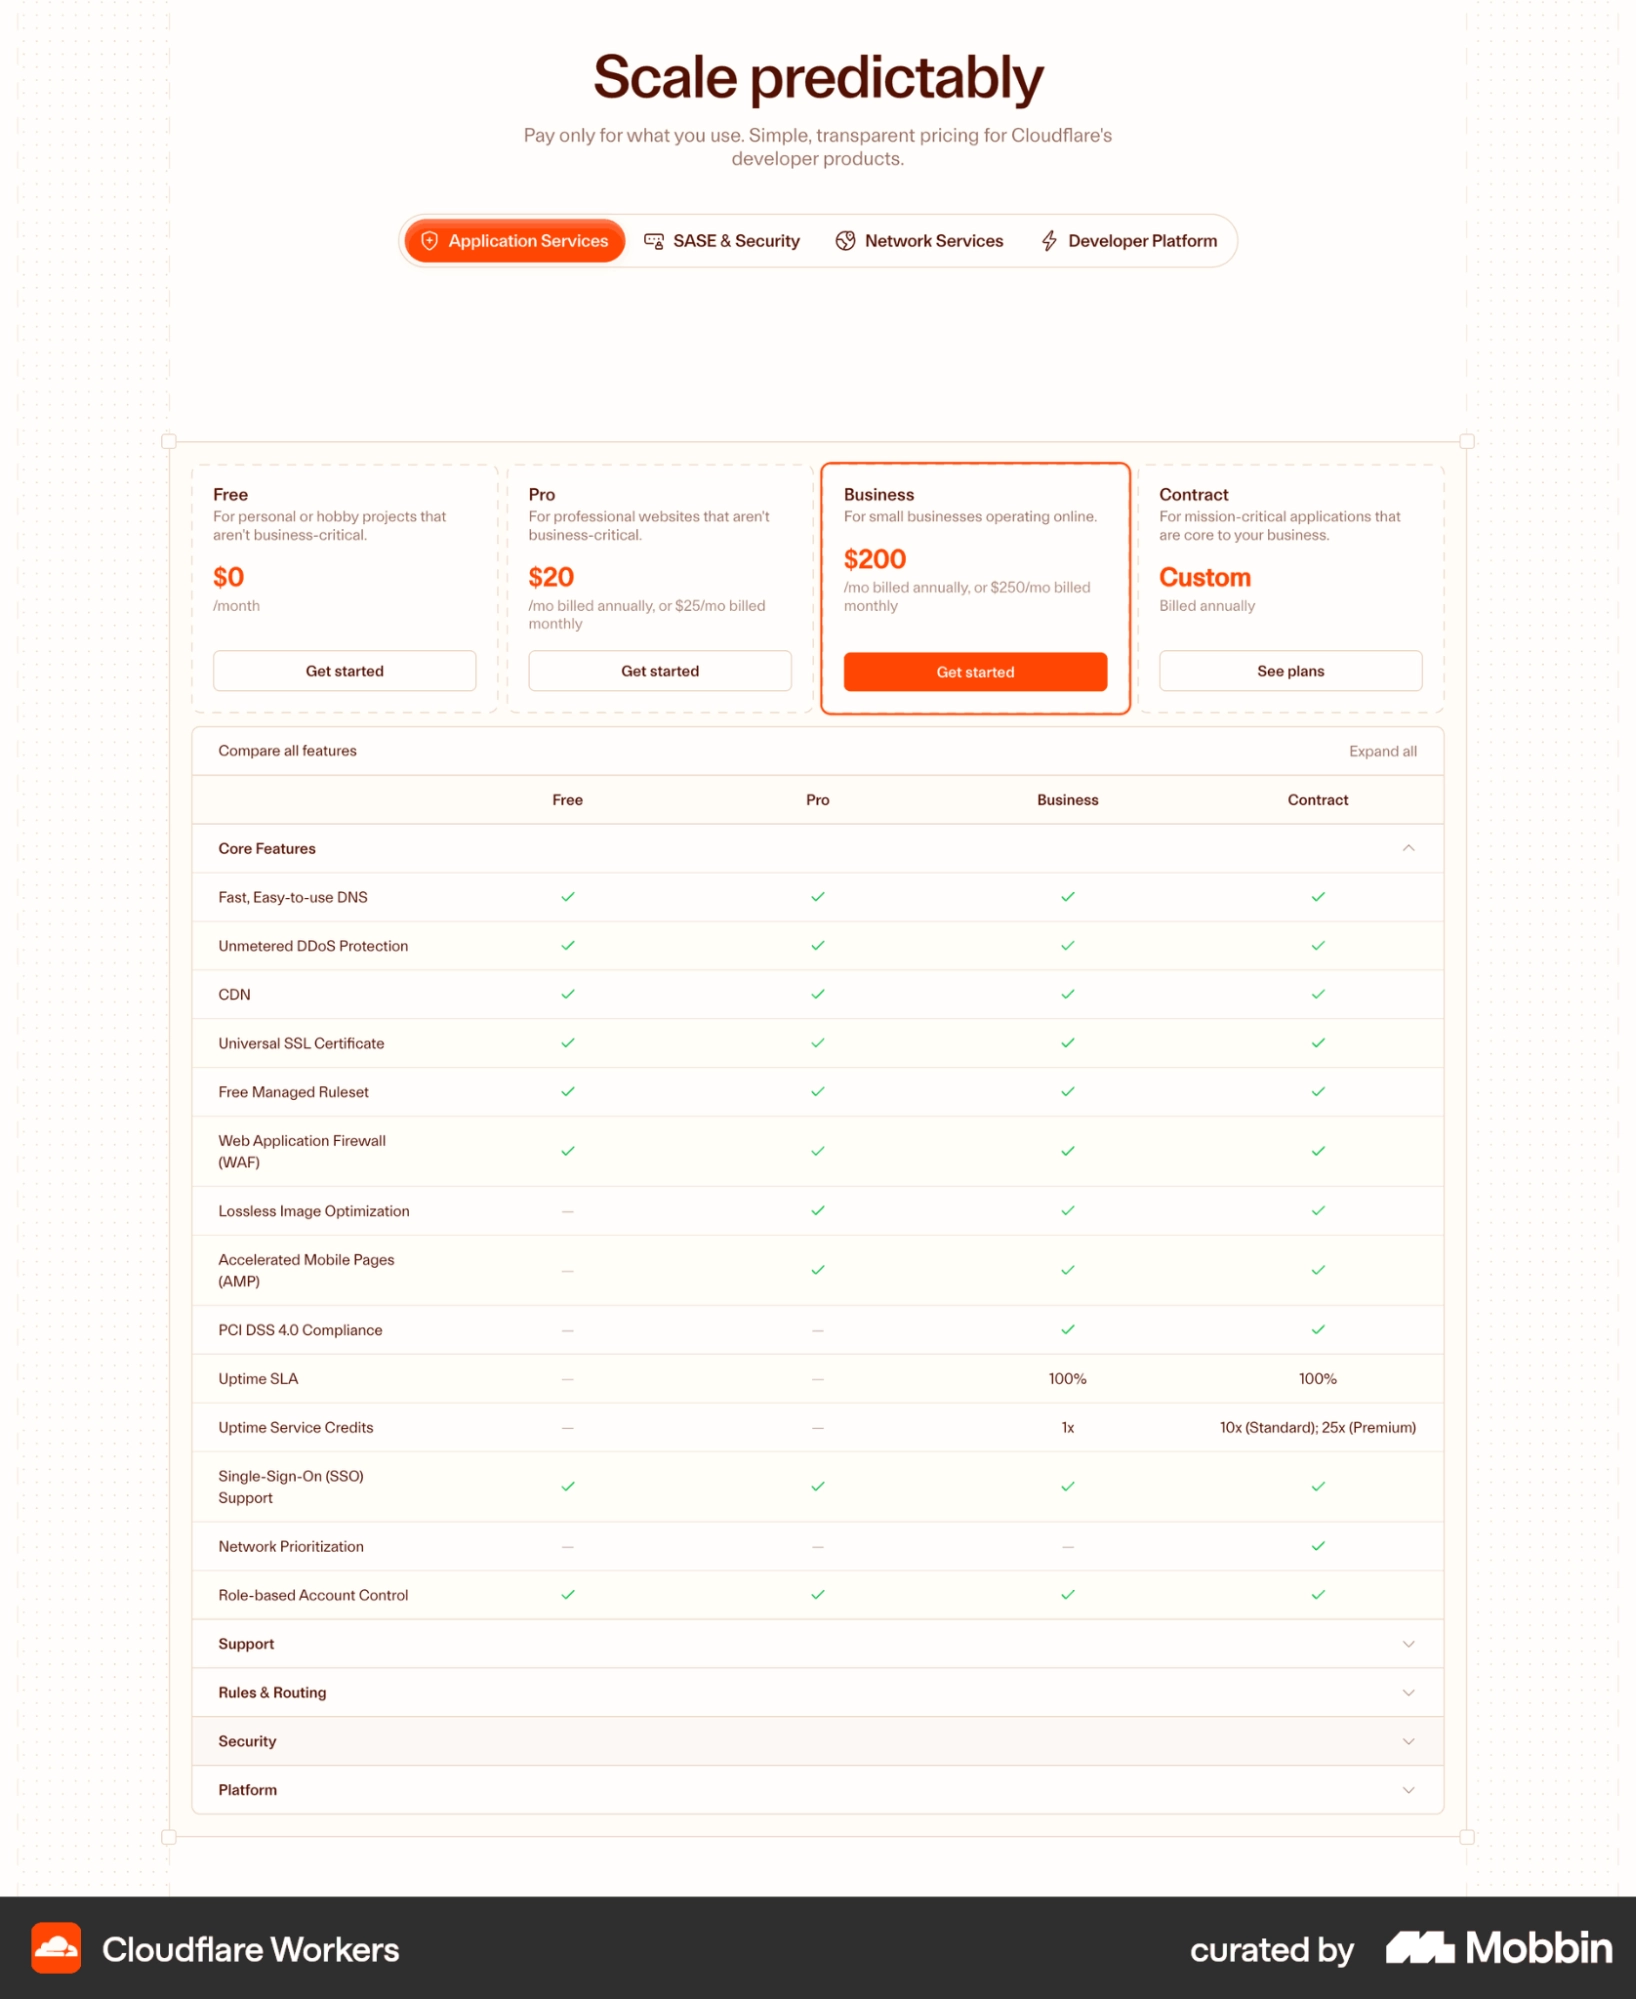
Once the value metric is established, the focus shifts to packaging—the way features and limits are grouped into tiers. This layer is where complexity often becomes a silent killer of conversion. In an effort to cater to every possible user persona, many companies create overly complex pricing grids with numerous toggles, tiers, and feature lists.
Psychological research into consumer behavior, specifically Hicks’s Law, indicates that increasing the number of choices increases the time and effort required to make a decision. When a potential subscriber is presented with eight different options (e.g., four tiers across monthly and annual plans), the cognitive load can lead to "analysis paralysis," causing the user to abandon the purchase altogether.
The structural goal of packaging should be to guide the user toward the plan that best fits their needs with minimal effort. If a user is forced to predict their future usage patterns just to select a plan, the company has effectively shifted the burden of the purchase decision onto the customer. Testing at this level should focus on the number of tiers, the "gating" of specific high-value features, and the clarity of the distinction between plans.
Layer 3: Scientific Price Point Selection and Willingness to Pay
Only after the value metric and packaging are solidified should a company address the actual numerical price point. At this stage, many teams rely on competitive benchmarking or internal guesswork, which often fails to capture the true "willingness to pay" (WTP) of their specific audience.
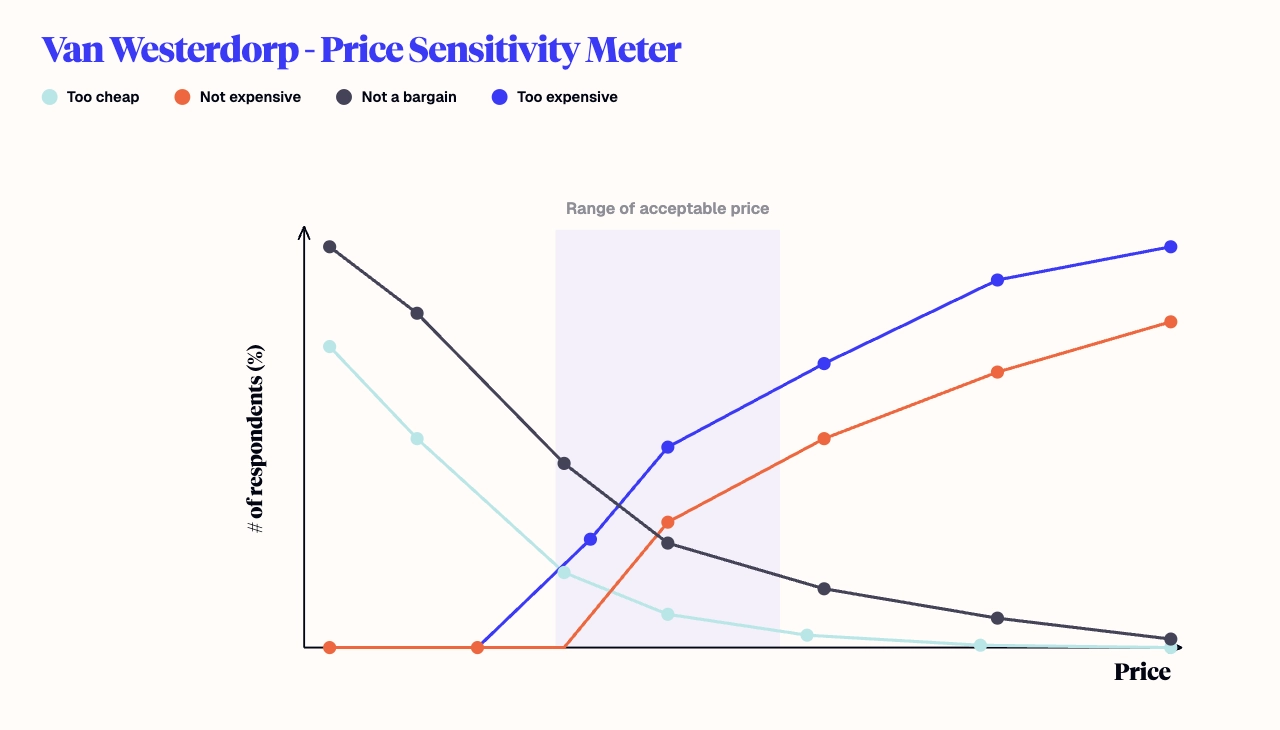
Professional pricing research utilizes established methodologies to determine the optimal price range. Two of the most prominent methods are:
- Van Westendorp Price Sensitivity Meter: This involves asking potential customers four specific questions to identify the point at which they consider a product too expensive, a bargain, getting expensive, or so cheap that the quality is questioned. This data produces a range of acceptable prices rather than a single number.
- MaxDiff Analysis: This method requires participants to choose the "best" and "worst" options from a set of features or price points, providing a clear ranking of preferences and perceived value.
By conducting this research before running A/B tests, companies can narrow their experimental variables. This prevents "p-hacking" and ensures that tests are clean. A common mistake in price testing is the "combination test," where a team changes both the price point and the trial duration simultaneously. If the test succeeds, the team cannot identify which variable drove the result, making it impossible to build a repeatable strategy.
Layer 4: Tactical Optimization and Psychological Triggers
The apex of the pyramid is optimization. This includes paywall tactics, price anchoring, urgency triggers, and discount framing. While these are the most common types of tests run by growth teams, they are refinements rather than fundamental shifts.
Tactics such as "anchoring"—placing a high-priced plan next to a medium-priced plan to make the latter seem like a better deal—can certainly provide incremental lifts. Similarly, testing the design of a paywall or the phrasing of a "limited time offer" can improve conversion rates at the margin. However, these tactics will never compensate for a broken value metric or a confusing package structure. The Pricing Pyramid model emphasizes that while these top-layer tactics are legitimate levers, the most significant revenue breakthroughs are found in the lower, more structural levels of the pyramid.
Chronology of a Pricing Strategy Overhaul
For a company looking to implement this model, the timeline for execution typically spans several months to ensure data integrity and minimize market disruption.
- Month 1-2: Foundation Audit. Conduct deep qualitative research to understand user frustration points. Analyze churn data to see if users are leaving after hitting specific usage caps or if they feel the value metric is unfair.
- Month 3: Value Metric Testing. Experiment with the unit of charge. For an AI tool, this might mean moving from "price per prompt" to "price per successful output."
- Month 4-5: Structural Refinement. Simplify the pricing page. Test a three-tier model against a four-tier model. Remove low-value features from the pricing grid to reduce cognitive load.
- Month 6: WTP Research and Price Point Testing. Use Van Westendorp surveys to identify the optimal price range for each tier. Run clean A/B tests on the price points identified.
- Month 7 and Beyond: Continuous Optimization. Once the foundation is solid, begin iterative testing on paywall design, anchoring, and promotional offers.
Broader Implications for the SaaS Industry
The move toward a hierarchical approach to pricing reflects a broader maturation of the digital economy. As acquisition costs on platforms like Meta and Google continue to rise, companies can no longer afford to be inefficient with their monetization strategies.

Industry analysts suggest that the "Pricing Pyramid" approach also improves long-term brand equity. When pricing is transparent and aligned with value, it builds trust. Conversely, aggressive tactical optimization on top of a flawed model can lead to a "churn-and-burn" cycle that damages a company’s reputation.
Furthermore, the integration of AI into software products is forcing a total re-evaluation of the "per seat" model. As AI agents begin to perform the work of multiple human users, charging per seat becomes obsolete. Companies that have mastered the bottom layers of the Pricing Pyramid—specifically the value metric—will be better positioned to navigate this technological shift than those that are merely tweaking their monthly subscription fees.
In summary, the Pricing Pyramid provides a diagnostic sequence that allows teams to identify exactly where their revenue leakage is occurring. By shifting the focus from "what is the number?" to "what is the value?", organizations can move away from inconclusive testing and toward a robust, scalable monetization strategy. The order of operations matters more than the tactics themselves; an upside-down pyramid is inherently unstable, and in the competitive world of subscriptions, stability is the prerequisite for growth.


 Raul Delapena Setiawan
 Laily UPN