


The practice of predicting how digital experiments will influence future financial performance has emerged as a central point of contention within the conversion rate optimization (CRO) industry. While executive leadership frequently demands precise fiscal projections to justify marketing spend, practitioners often resist these mandates, citing the inherent volatility of digital ecosystems. The core of the debate lies in the "translation gap"—the uncertainty of whether a statistically significant 10% lift observed during a controlled two-week experiment will actually manifest as a 10% increase in total monthly revenue once the winning variant is permanently deployed.

The Conflict Between Statistical Rigor and Business Management
In the modern corporate environment, the drive for data-driven decision-making has placed CRO teams under increased pressure to prove their value in hard currency. However, the transition from experimental data to a revenue forecast is fraught with variables. Even when an experiment yields a valid result, the real-world application of that change is subject to an almost infinite number of external influencers.
This complexity is the primary reason why randomized controlled A/B testing has superseded the older "pre/post" comparison method. In a pre/post model, a business might implement a change and observe a 5% drop in sales, concluding the change was a failure. In reality, a broader market downturn might have caused a 15% drop, meaning the change actually mitigated a larger loss. A/B testing isolates the variable by running the control and the variant simultaneously, yet it still cannot account for every future market shift. Factors such as sudden ad budget reallocations, shifts in search engine optimization (SEO) rankings, macroeconomic fluctuations, or even seasonal holidays can obscure the long-term impact of a website modification.

Establishing Causality Through Robust Statistical Methods
To build a revenue forecast that survives executive scrutiny, organizations must first ensure that the underlying experimental data is beyond reproach. The digital marketing industry has increasingly looked toward the medical and pharmaceutical sectors for guidance, adopting the randomized controlled trial as the "gold standard" for proving causality.
For a forecast to be considered reliable, the individual experiments must meet specific statistical criteria:
- Statistical Power: The test must have a large enough sample size to detect the effect it claims to have found.
- Significance Levels: Results must be vetted against a high threshold (typically 95%) to ensure the observed lift is not the result of random chance.
- Minimum Detectable Effect (MDE): Teams must pre-define the smallest change in conversion rate that would be worth the cost of implementation.
When these parameters are met, the resulting data provides a realistic view of the potential effect. However, the quality of any revenue projection is strictly limited by the quality of the experimental inputs. If an experiment is underpowered or suffers from "p-hacking" (the practice of manipulating data to find patterns), any subsequent revenue forecast becomes a work of fiction.
The Necessity of Conservative Modeling: The "Haircut" Approach
A common pitfall in digital forecasting is the "million-dollar case study" fallacy. This occurs when a practitioner takes a 10% lift from a test and applies it directly to the company’s $20 million annual revenue, claiming a $2 million gain. Industry veterans argue that this approach is fundamentally flawed for three primary reasons:
- Selection Bias and Localized Impact: Most tests are conducted on specific segments or pages. A lift on a "Checkout" page does not apply to the 60% of users who never reach that stage of the funnel.
- The Novelty Effect: Users often respond positively to a change simply because it is new. Over time, this "lift" tends to regress toward the mean as the novelty wears off.
- Implementation Decay: Technical debt, browser updates, and changing user behaviors can slowly erode the effectiveness of a previously winning variant.
To counter these issues, sophisticated models now employ a "haircut"—a deliberate reduction of the observed lift to account for uncertainty. For example, a 10% observed lift might be reduced by 10% immediately to account for statistical noise. Furthermore, the model may only project the full impact for a limited window (such as four months) before applying a monthly "decay rate" (e.g., 20%) to represent the diminishing returns of the optimization.
A Chronological Framework for Calculating Revenue Impact
To move from raw data to a structured forecast, analysts generally follow a specific chronology of calculation. This process ensures that the timing of implementation is accounted for, as a "winning" test does not generate revenue until the code is actually pushed to the live environment.
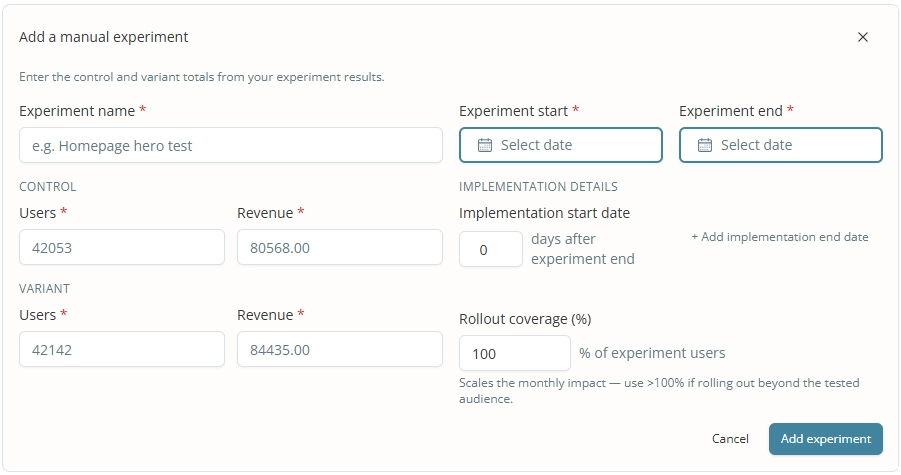
- Calculate Revenue Per User (RPU): The first step is determining the RPU for both the control and the variant groups during the test period.
- Determine the Lift per User: By subtracting the control RPU from the variant RPU, analysts find the specific dollar-value increase attributed to each individual exposed to the change.
- Define Rollout Coverage: This involves identifying what percentage of the total site traffic will actually see the change. If a test was run on mobile users only, the rollout coverage for a site-wide forecast would be limited to the mobile percentage of total traffic.
- Project Over Time: The lift per user is multiplied by the expected number of users over a specific timeframe, adjusted by the aforementioned "haircut" and decay rates.
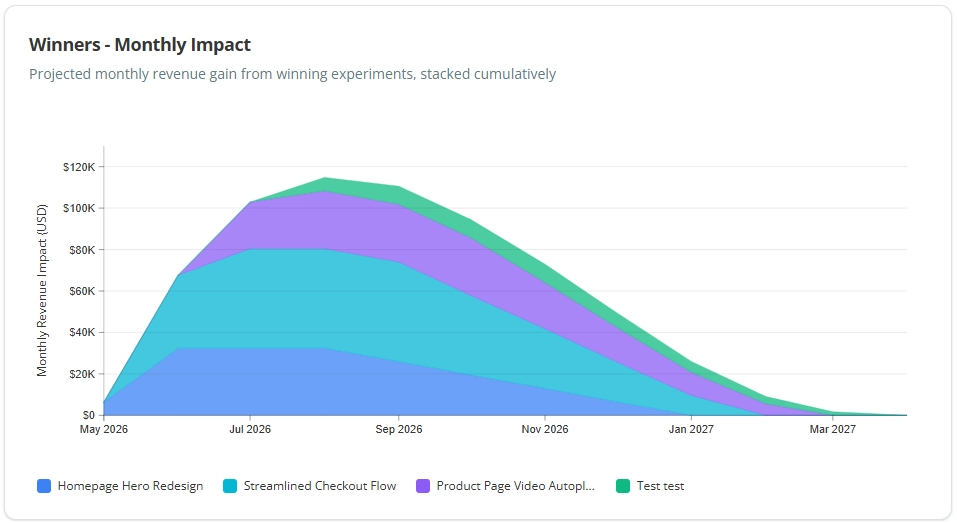
This stacking method allows businesses to see how multiple winning experiments contribute cumulatively to the bottom line. When visualized, this often appears as a series of overlapping growth curves, where the total revenue gain is the sum of all active, non-decayed improvements.
The Role of Specialized Analytics Tools
The complexity of manual revenue tracking has led to the rise of specialized experimentation analytics platforms, such as Katsed. These tools are designed to automate the transition from test results to financial reports. By integrating directly with testing platforms, they allow teams to enter start and end dates, revenue per variant, and implementation delays.

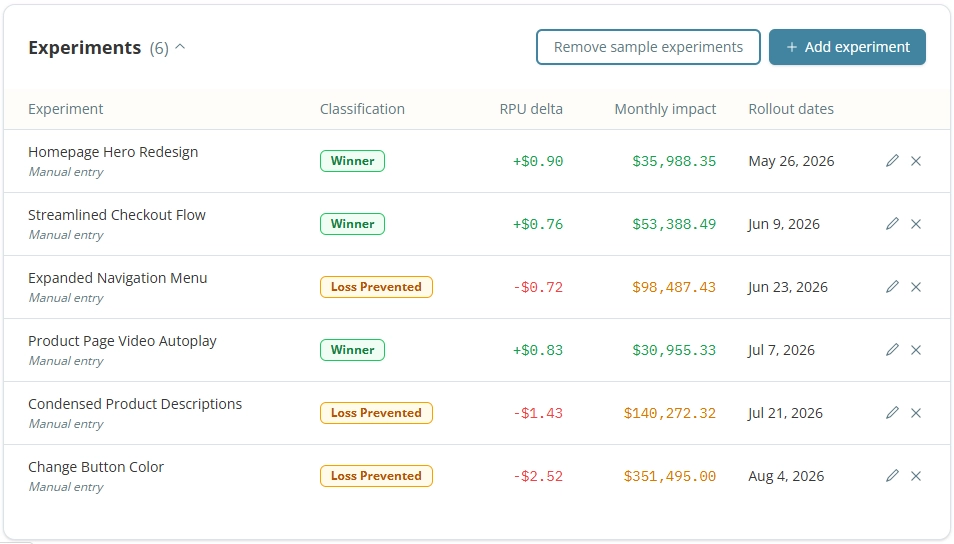
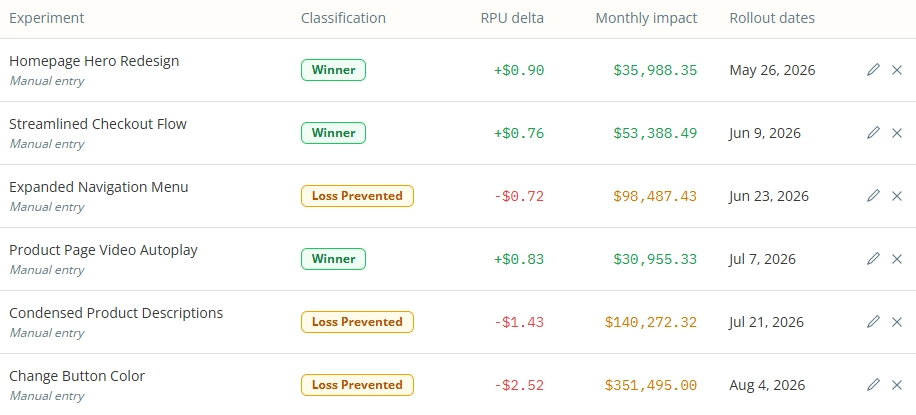
These platforms provide a standardized way to classify results into categories such as "Winners" (experiments that increased RPU) and "Loss Prevented" (experiments where the variant outperformed a proposed change that would have decreased revenue). For stakeholders, these tools provide a visual representation of how experiments stack on top of each other, providing a clearer picture of the cumulative impact on the fiscal year.
Proving Return on Investment (ROI)
Revenue forecasting is only one side of the financial equation. To provide a full picture to the C-suite, the projected gains must be measured against the cost of the experimentation program. This "investment" side of the ledger typically includes:
- Tooling Costs: Subscriptions for A/B testing platforms, heatmapping tools, and analytics software.
- Human Capital: The salaries of CRO specialists, data analysts, and designers.
- Engineering Opportunity Cost: The percentage of the development team’s time diverted from building new features to implementing experiment variants.
By comparing the cumulative projected revenue gain against these operational costs, organizations can calculate a formal ROI for their testing program. This shift from "conversion rates" to "return on investment" is often what elevates CRO from a tactical marketing function to a strategic business pillar.
Broader Implications for Corporate Strategy
The transition toward formal revenue forecasting in CRO reflects a broader maturation of the digital industry. It signals a move away from "growth hacking" and toward a disciplined, scientific approach to business expansion. While it is acknowledged that these forecasts are models—and therefore inherently imperfect—they serve as vital communication tools between technical teams and financial stakeholders.
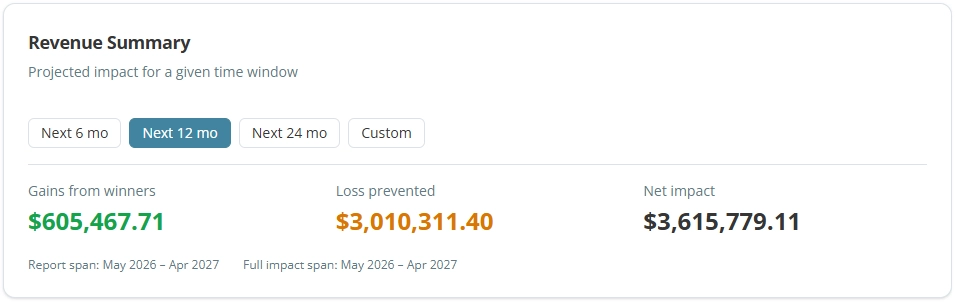
At the executive level, estimates and projections are standard operating procedures. By providing a conservative, transparently calculated revenue forecast, CRO practitioners can speak the language of the boardroom. This transparency builds trust, as it acknowledges the limits of the data while still providing a roadmap for expected growth.
Ultimately, forecasting revenue from experiments is not about having a "crystal ball." It is about creating a logical, evidence-based framework that translates the incremental successes of a testing program into the broader context of a company’s financial health. As long as the assumptions are explicit and the statistical methods remain robust, these forecasts provide the most accurate possible glimpse into the future value of a brand’s digital evolution.







