
The pervasive reliance on academic statistical standards within corporate experimentation programs has reached a critical juncture, as organizations increasingly find their growth initiatives paralyzed by a cycle of inconclusive A/B test results. For years, the gold standard for digital experimentation has been the 95% confidence interval, a metric inherited from the world of scientific publishing. However, new data and simulations suggest that applying this rigid threshold to the fast-paced environment of e-commerce and software development may be counterproductive, leading to an 85% failure rate in certifying meaningful improvements. As stakeholders question the return on investment for experimentation platforms, a shift is occurring toward more flexible decision policies that prioritize business velocity and risk management over absolute mathematical certainty.
The Crisis of Inconclusive Experimentation
The typical lifecycle of a modern digital experiment often follows a discouraging pattern. A product team identifies a potential optimization, designs a variation, and launches a test. Traffic flows into the experiment for a standard four-week duration, only for the testing platform to return a result of "inconclusive." When the experiment is repeated, the result remains the same. Over time, this pattern erodes the creative confidence of design teams and the strategic foresight of product managers. Analysts find themselves authoring reports that offer no actionable insights, and stakeholders begin to view experimentation not as a growth engine, but as a bureaucratic hurdle.

Industry data suggests that this stagnation is rarely the fault of the creative or analytical teams. Instead, it is the result of a "decision policy mismatch." Many organizations utilize home-grown or third-party A/B testing tools that default to a 95% confidence threshold. While this provides a high degree of protection against false positives, it is often misaligned with the reality of business traffic and the subtle nature of conversion rate lifts. In many scenarios, a true underlying improvement of 3% or 4%—which could represent millions of dollars in annual revenue—is statistically invisible under standard academic rigor within a standard monthly reporting window.
A Chronology of a Stalled Experimentation Program
To understand how these statistical standards impact daily operations, it is necessary to examine the typical timeline of an experimentation cycle within a medium-sized enterprise.
- Phase 1: Ideation and Launch (Weeks 1-2): A bold hypothesis is formed based on user behavior data. The variation is built and deployed.
- Phase 2: Data Collection (Weeks 3-6): The experiment runs. Initial data shows a positive trend, but the "confidence" metric hovers around 80-85%.
- Phase 3: The "Inconclusive" Verdict (Week 7): At the conclusion of the test, the statistical engine fails to cross the 95% threshold. Under current policy, the variation is rejected.
- Phase 4: Program Erosion (Months 3-6): After several "failed" cycles, bold ideas are replaced by incremental, safe tweaks. The experimentation program loses its mandate to drive innovation.
This chronology highlights a fundamental tension between "validity" and "velocity." While the statistical purist demands validity, the business requires velocity to stay competitive.

Quantifying the Cost of Rigor: The Stochastic Path Simulation
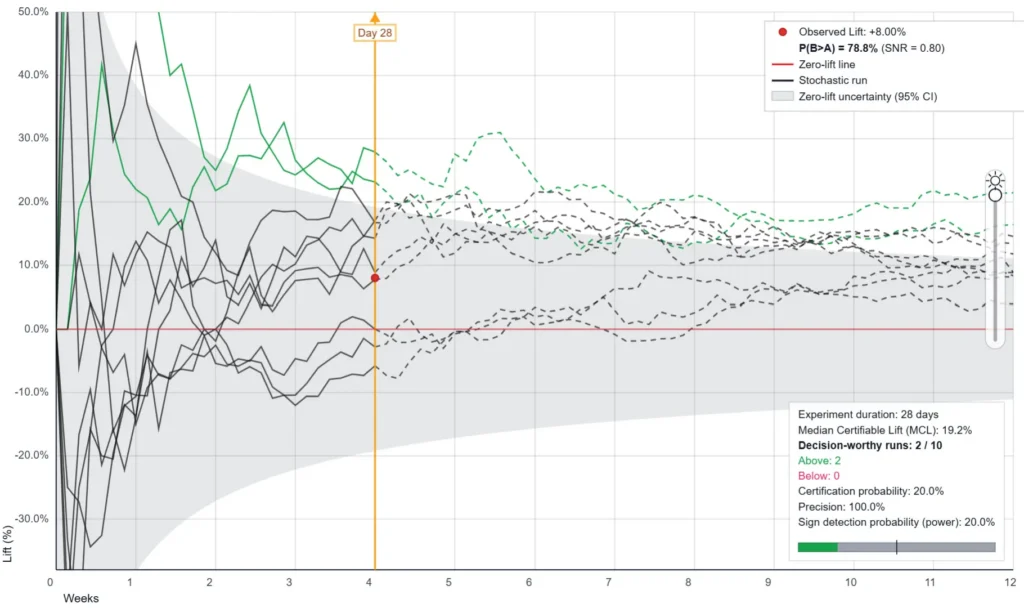
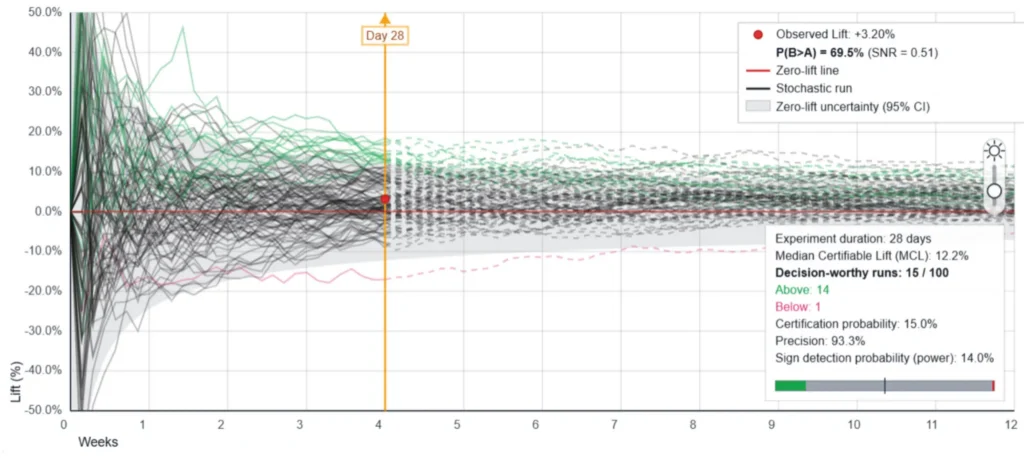
Recent simulations using stochastic path models have shed light on why the 95% confidence standard is so difficult for most businesses to meet. In a simulation involving a control version with 500 conversions over four weeks and a true underlying lift of +3.2%, the results were telling. When the experiment was run 100 times under identical conditions—varying only the random "noise" inherent in human behavior—the standard two-sided 95% confidence interval policy only reached a "winner" certification 15 times out of 100.
This means that in 85% of cases, a real, profitable improvement was discarded as "inconclusive." This high rate of "missed winners" is a predictable mathematical consequence of using a decision policy calibrated for a different set of problems. In academic research, a false positive can lead an entire field of study astray for years; in business, the cost of a missed 3% lift is often far greater than the cost of implementing a change that might only be a 1% lift or even neutral.
The Statistical Double Standard in Corporate Decision-Making
There exists a significant "double standard" in how organizations treat data from A/B tests compared to other business investments. A Chief Marketing Officer (CMO) may approve a $100,000 ad campaign based on creative intuition and targeting data that suggests a 60% or 70% probability of success. Similarly, a product team might ship a new onboarding flow based on qualitative customer interviews and positive mockup testing, where the "confidence" in the decision is far below any formal statistical threshold.
In these contexts, the business accepts "decent evidence" and "manageable downside" as sufficient criteria for action. However, the moment the same organization runs an A/B test, the bar is raised to a 95% confidence interval. Mathematically, a two-sided 95% confidence interval is equivalent to a 97.5% one-sided confidence that the variation is better than the control. This means the organization is holding its digital experiments to a standard nearly 30 percentage points higher than its million-dollar marketing campaigns or major product launches.
Alternative Frameworks: Signal-to-Noise Ratio and Continuous Monitoring
To address this imbalance, data strategists are proposing a move toward policies based on the Signal-to-Noise Ratio (SNR). SNR is the ratio between the observed difference in conversion rates (the signal) and the uncertainty of that difference (the noise).
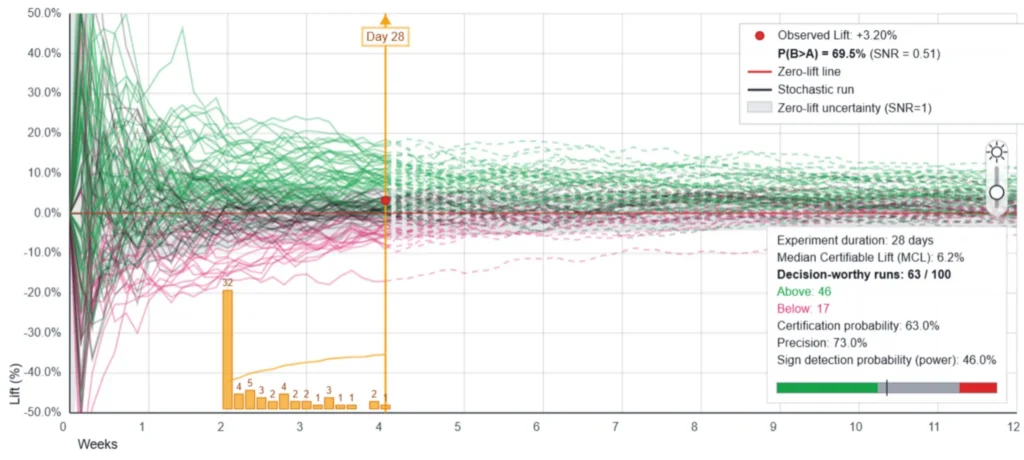
An SNR = 1 policy suggests that a decision can be made the moment the observed signal is equal to the noise. In mathematical terms, this corresponds to approximately an 84% one-sided posterior probability that the variation is superior to the control. When this policy is combined with continuous monitoring—evaluating the data daily after a minimum observation period—the "sign detection" (the ability to identify a true winner) increases dramatically.
In the same simulation of a 3.2% true lift, switching from a 95% confidence threshold to an SNR = 1 policy with daily monitoring improved the success rate from 15% to 46%. While this does increase the risk of false positives (precision drops from roughly 93% to 73%), the net benefit to the business is often superior. Instead of identifying one winner out of every seven tests, the program identifies a winner in nearly half of its attempts.
The Concept of Median Certifiable Lift (MCL)
A critical tool for planning this new breed of experimentation is the Median Certifiable Lift (MCL). Unlike the Minimum Detectable Effect (MDE), which requires teams to guess an expected lift before a test begins, MCL is a policy output. It represents the true lift at which a specific decision policy has a 50% chance of certifying a winner, based on actual traffic, baseline conversion rates, and monitoring cadence.
For many small-to-medium businesses, the MCL under a 95% confidence policy is often as high as 12% or 15%. If the team’s actual improvements usually fall in the 3% to 5% range, the program is mathematically designed to fail before it even launches. By calculating the MCL upfront, teams can adjust their thresholds to a level that makes "winning" a statistical possibility.
Risk Management Based on Decision Reversibility
The most sophisticated experimentation programs are now moving away from a "one-size-fits-all" threshold and instead matching their statistical rigor to the "reversibility" of the decision.
- Low-Stakes/High-Reversibility Decisions: For changes such as headline tweaks, button colors, or promotional banners, the cost of being wrong is low and the change can be reverted in minutes. For these, a lower confidence threshold (e.g., SNR = 1 or 80% confidence) is appropriate to maintain high velocity.
- High-Stakes/Low-Reversibility Decisions: For structural changes like pricing model overhauls, backend architectural shifts, or brand identity updates, the "switching cost" is high. These decisions require the traditional 95% or even 99% confidence threshold to protect the business from significant downside.
By categorizing experiments by risk, organizations can optimize their "expected value" across the entire program rather than minimizing false positives in isolation.
Practical Implications for Data Teams
Transitioning to a more flexible decision policy requires a cultural shift within data and product teams. Experts recommend four specific steps for implementation:

- Acknowledge the Precision Trade-off: Teams must explicitly state that by lowering thresholds to increase velocity, a higher percentage of "winners" will technically be false positives. This should be documented as the "agreed-upon cost of a high-velocity program."
- Simulate Negative Scenarios: Before adopting a lower threshold, analysts should simulate what happens when the true lift is slightly negative (e.g., -3%). If the policy still prevents these "harmful" variations from being called winners 70-80% of the time, it is generally safe for business use.
- Use Sequential Testing Protocols: Rather than "peeking" at fixed-horizon tests, which invalidates the math, teams should use Bayesian or sequential frequentist models designed for continuous monitoring.
- Focus on "Sign Detection": Shift the primary KPI of the experimentation program from "Number of Significant Tests" to "Probability of Correct Directional Decisions."
Conclusion: The Shift from Academic Rigor to Business Intelligence
The evolution of digital experimentation is moving toward a more pragmatic application of statistics. While the 95% confidence interval remains a vital tool for scientific discovery, its role as the sole arbiter of business decisions is being challenged. By understanding the trade-offs between noise, signal, and velocity, organizations can transform their experimentation programs from academic exercises into true growth engines.
The goal of a modern experimentation policy is not to achieve absolute certainty, which is an impossibility in a stochastic world. Instead, the goal is to create a decision-making framework that balances the risk of being wrong with the risk of doing nothing. As the digital landscape becomes increasingly competitive, the businesses that succeed will be those that learn to act on "enough" evidence, rather than waiting for "perfect" evidence that may never arrive.


 Asro
Asro
 Dwi Wanna