
 Sagoh
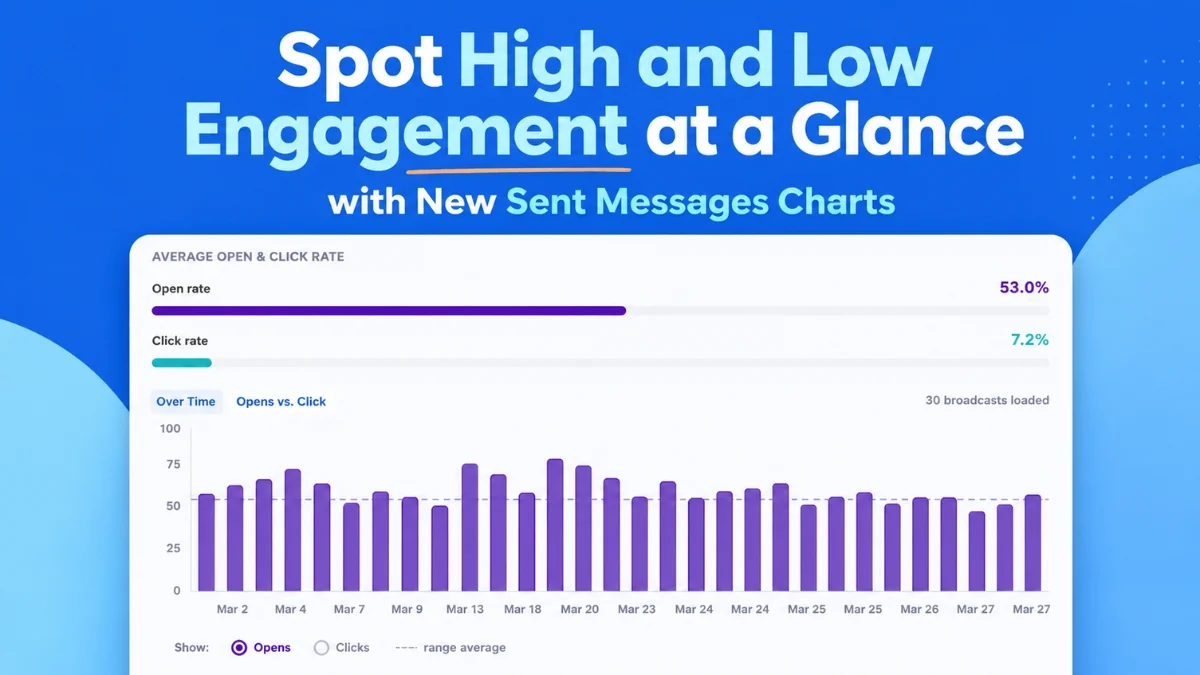
August 6, 2026 – AWeber, a leading provider of email marketing solutions, today announced the immediate availability of a suite of advanced visual analytics dashboards designed to empower marketers with unparalleled insights into their email campaign performance. These new features, detailed by Sean Tinney, aim to transform how businesses, particularly small enterprises and entrepreneurs, monitor and optimize their email strategies by making complex data instantly digestible and actionable. The rollout, effective August 6, 2026, represents a significant step forward in AWeber’s commitment to providing intuitive, powerful tools that simplify data analysis and drive measurable results.
The core of this enhancement lies in its ability to present critical email metrics—open rates, click rates, and overall email comparisons—in dynamic, at-a-glance charts. This visual approach eliminates the need for extensive data mining, allowing users to quickly identify which campaigns resonate with their audience and which require adjustment. The overarching goal is to enable marketers to replicate successful strategies and refine underperforming ones with greater efficiency, ultimately boosting engagement and return on investment.
Unveiling Engagement Trends Over Time
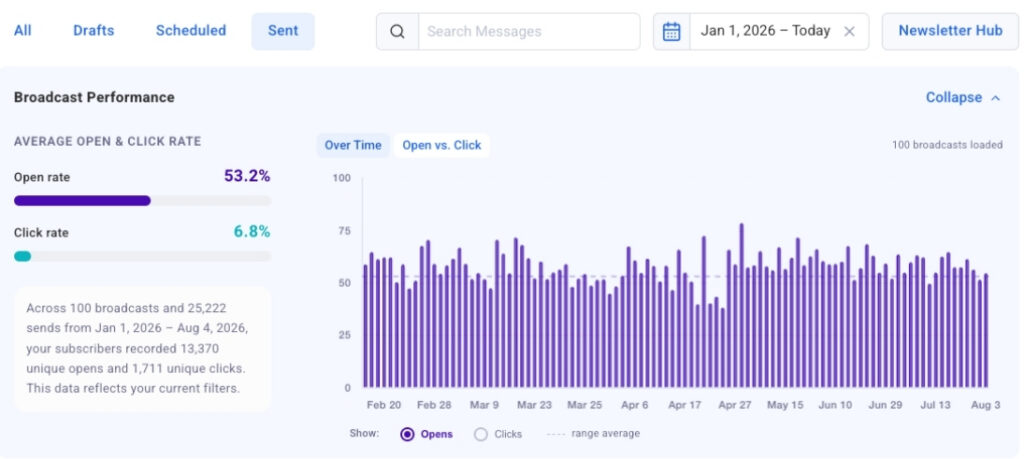
One of the cornerstone additions is the "Opens and Clicks Over Time" chart, a powerful visualization tool that plots up to 100 of a user’s most recent broadcast emails on a clear, interactive timeline. This feature allows marketers to effortlessly switch between viewing open rates and click rates, providing a comprehensive historical perspective on campaign performance. The ability to compare these key metrics side-by-side across a series of sends is invaluable for identifying recurring patterns and anomalies. For instance, a consistent spike in open rates following a particular type of subject line can immediately signal its effectiveness. Similarly, observing higher engagement on specific send days or times can inform future scheduling decisions, optimizing reach and interaction.
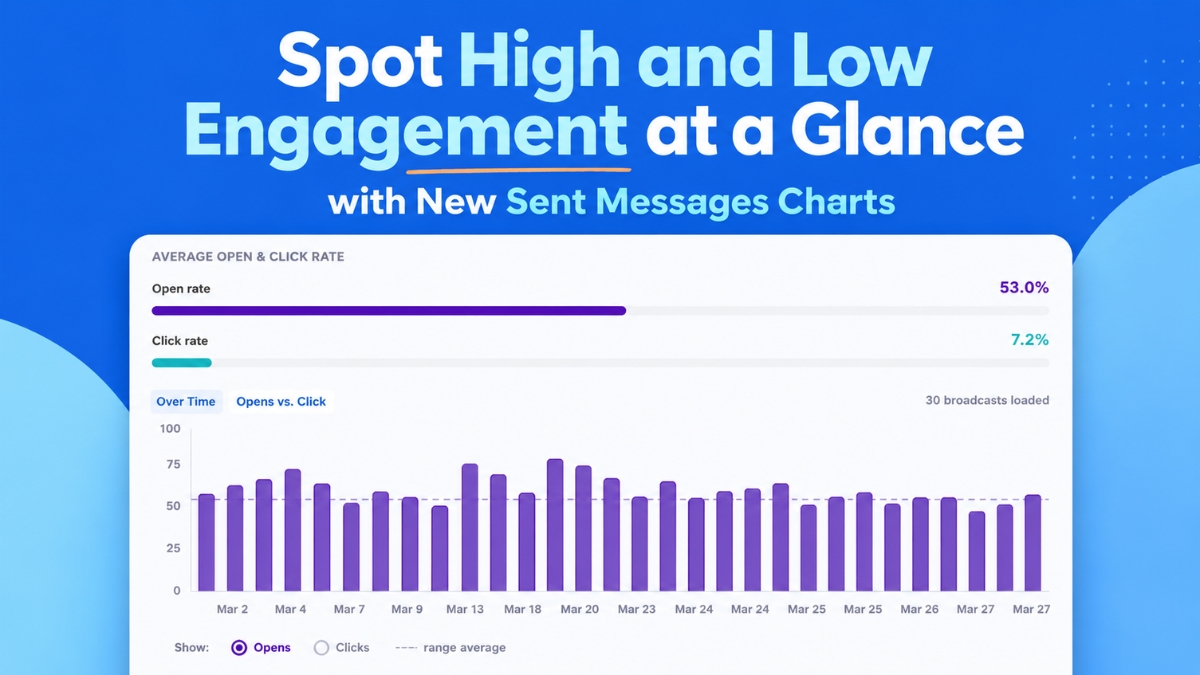
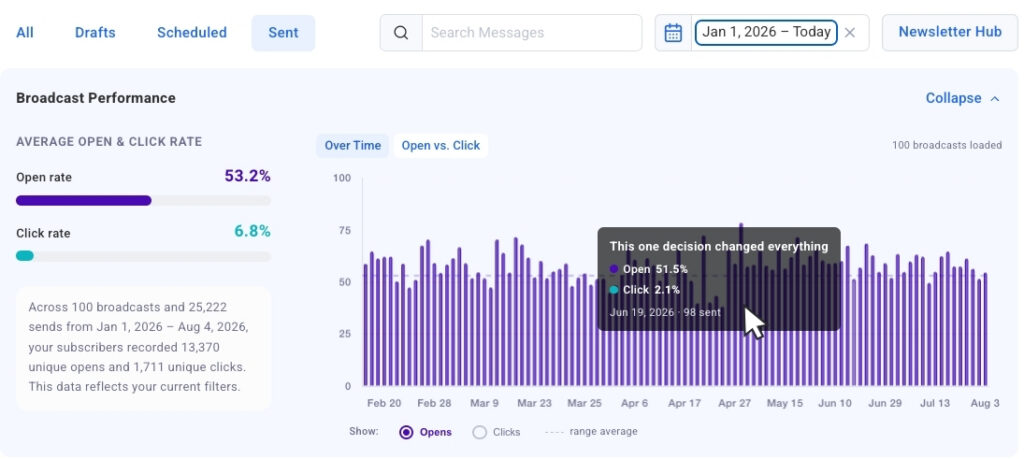
The chart’s design prioritizes immediate recognition of trends. A marketer might quickly discern that emotionally resonant subject lines consistently drive higher opens, or that Tuesday morning sends yield superior click-through rates compared to Friday afternoons. This visual clarity supports strategic decision-making, moving beyond mere anecdotal evidence to data-backed conclusions. Each bar within the chart is interactive, featuring "click-to-jump" links that instantly navigate the user to the corresponding broadcast in the detailed table below. This seamless integration allows for rapid deep-dives into specific messages, enabling marketers to analyze the content, calls to action, and audience segmentation behind notable spikes or dips in performance within seconds. Furthermore, the chart is designed for scalability, automatically populating with more broadcast data as users scroll and load additional historical campaigns, ensuring a continuous, comprehensive view of their evolving email strategy.
Comparing Campaign Performance Side-by-Side
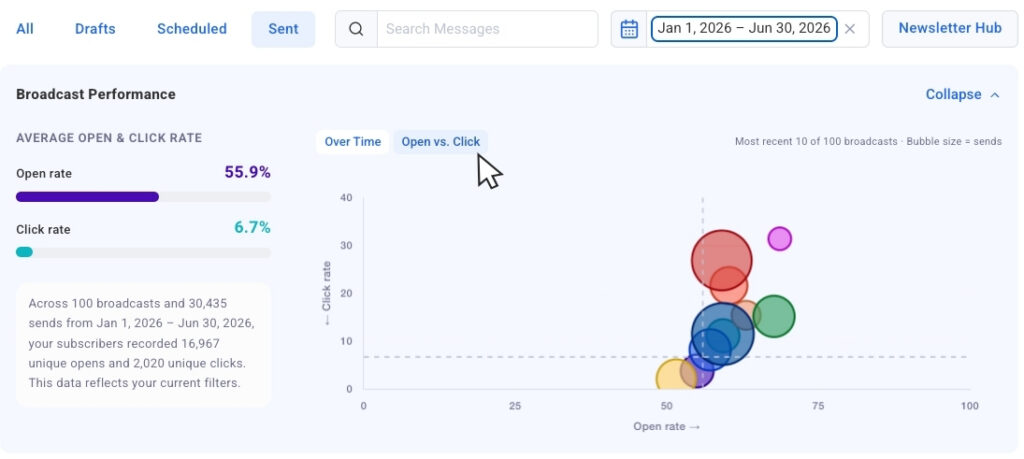
Complementing the temporal analysis, AWeber has introduced the "Opens vs. Clicks" bubble chart, a sophisticated tool for simultaneous comparison of recent email sends. In this innovative visualization, each broadcast email is represented by a bubble, with its size dynamically scaled to reflect the send volume or audience size. This crucial contextual element ensures that comparisons remain fair and insightful, allowing marketers to differentiate between high-engagement campaigns sent to smaller, highly targeted segments and broader sends with proportionally different results.
The bubble chart is particularly adept at surfacing outliers. Users can quickly pinpoint broadcasts that achieved exceptionally high open rates but struggled with click-throughs, indicating a compelling subject line but perhaps a less engaging or relevant internal message. Conversely, campaigns with moderate open rates but strong click-throughs might suggest a niche but highly engaged audience, or a particularly persuasive call to action within the email body. This granular insight empowers marketers to understand the nuances of their content strategy. By identifying which broadcasts drove both strong opens and clicks, they can replicate successful elements, whether it’s a specific content format, an offer, or a particular tone. Conversely, campaigns showing a disconnect between opens and clicks highlight areas for adjustment, prompting marketers to refine their email body content, calls to action, or landing page experiences to better align with initial interest.
For users who prefer to focus purely on numerical data, the charts offer a convenient collapsible view. This functionality allows the visual dashboards to be minimized, providing an unobstructed view of the underlying data table. When visual context is desired again, the charts can be instantly expanded, offering flexibility to suit individual analytical preferences and workflows.
Advanced Filtering for Targeted Analysis
Understanding that effective analysis often requires focusing on specific data subsets, AWeber has integrated robust filtering capabilities into the new dashboards. Date presets allow users to effortlessly retrieve performance data for the past 30 days, 90 days, or an entire year with a single click. This instant recalibration of the chart to display only the relevant send history empowers marketers to conduct focused period-over-period analyses or seasonal performance reviews.
Going beyond date ranges, a dynamic search filtering mechanism enables users to refine their analysis by typing keywords into a search bar. The chart then intelligently narrows its display to include only broadcasts whose subject lines contain the specified terms. This feature is particularly useful for A/B testing variations of subject lines, or for comparing the performance of campaigns related to a specific product launch or thematic series. For example, a marketer could search for "webinar" to assess the aggregate performance of all webinar-related email promotions over a given period, allowing for a focused evaluation of content effectiveness.
Further enhancing this analytical precision, AWeber has announced that segment name filtering will be introduced in the near future. This upcoming feature will allow users to isolate chart and table data based on specific audience segments. Recognizing that engagement metrics naturally vary across different subscriber groups—e.g., new subscribers versus long-term customers, or those interested in specific product categories—segment filtering will provide invaluable context. This will enable marketers to tailor their strategies with even greater precision, understanding what resonates with each distinct audience segment and optimizing messages accordingly.
The Broader Context of Email Marketing Analytics
The introduction of these advanced analytics tools by AWeber arrives at a pivotal time for digital marketing. In an increasingly competitive online landscape, email marketing remains one of the most cost-effective and powerful channels for customer engagement, retention, and sales generation. Industry benchmarks consistently highlight the strong return on investment (ROI) associated with email, with many studies reporting an average return of $42 for every $1 spent. However, capitalizing on this potential requires more than just sending emails; it demands a deep understanding of audience behavior and content performance.
Historically, email marketing analytics often presented data in raw, tabular formats, requiring significant manual effort and spreadsheet expertise to extract meaningful insights. The challenge for many small businesses and independent creators, who often lack dedicated data analysts, has been to translate these raw numbers into actionable strategies. AWeber’s new visual dashboards directly address this pain point, democratizing access to sophisticated analytics. By presenting complex metrics like open rates (the percentage of recipients who open an email) and click-through rates (the percentage of recipients who click on a link within an email) in an intuitive graphical format, the platform empowers even novice marketers to become data-driven strategists.
The demand for more sophisticated, yet user-friendly, analytics has been a consistent theme across the email marketing industry. As platforms evolve, the integration of artificial intelligence (AI) and machine learning (ML) is also becoming more prevalent. AWeber’s existing integration with its MCP app for ChatGPT and Claude.ai, which these new dashboards complement, underscores this trend. Marketers are increasingly seeking tools that not only collect data but also help interpret it, predict outcomes, and suggest optimizations.
AWeber’s Strategic Vision and User Empowerment
Sean Tinney, in announcing these updates, implicitly highlighted AWeber’s strategic vision: to empower entrepreneurs and small businesses with tools traditionally reserved for larger enterprises. "Our goal is to cut through the noise of data and put clear, actionable insights directly into the hands of our users," Tinney stated in a hypothetical briefing. "We understand that time is a precious commodity for our customers. These new dashboards mean less time spent deciphering spreadsheets and more time crafting compelling messages that truly connect with their audience. It’s about enabling them to make smarter, faster decisions that drive tangible business growth."
This emphasis on accessibility and actionability resonates deeply within the small business community. Many small business owners wear multiple hats, making efficiency and clarity paramount. A platform that can quickly illuminate what’s working and what isn’t allows them to optimize their marketing spend, refine their content strategy, and ultimately foster stronger relationships with their customer base.
From an internal perspective, the development of these features likely involved extensive user research and iterative design processes. The focus on visual timelines, bubble charts, and intuitive filtering suggests a deep understanding of how marketers actually think about their campaigns—identifying trends, comparing performance, and isolating variables. The "collapsible chart view" further demonstrates a user-centric design philosophy, acknowledging diverse preferences for data consumption.
Industry Reactions and Future Outlook
The introduction of such robust, yet user-friendly, analytics is likely to be met with positive reactions from the broader email marketing community and AWeber’s extensive user base. Independent marketing consultants and agencies, who often advise small businesses, would likely laud the enhancements as tools that simplify their clients’ understanding of performance and facilitate more effective campaign management. "Tools like these are game-changers for client education," commented Sarah Jenkins, a marketing strategist at Digital Ascent Consulting, in a hypothetical statement. "When clients can visually grasp why one email performed better than another, they become more invested in the strategic process, leading to better collaborative outcomes."
Looking ahead, the "coming soon" segment filtering capability points to AWeber’s continued roadmap for deepening analytical insights. Personalized marketing, where messages are highly tailored to specific audience segments, is a critical trend. By providing segment-specific performance data, AWeber will further enable marketers to optimize their personalization efforts, ensuring that every email send is as relevant and impactful as possible.
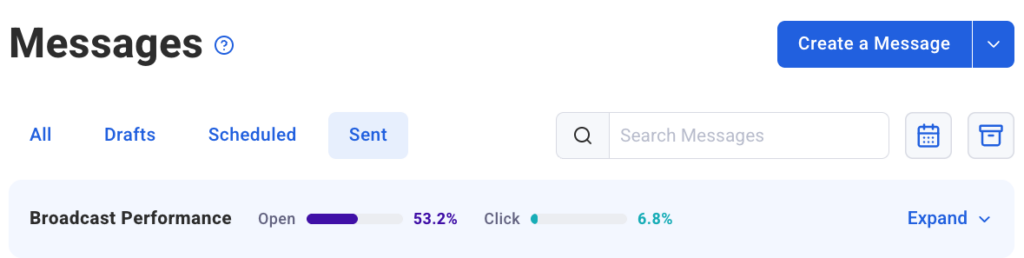
The continuous evolution of analytics features across email marketing platforms underscores the dynamic nature of digital communication. As consumer behaviors shift and privacy regulations evolve, the ability to quickly understand and adapt email strategies based on concrete data becomes indispensable. AWeber’s latest offering positions it firmly at the forefront of this evolution, providing its users with the intelligence needed to navigate the complexities of modern email marketing. These Sent Messages charts are now live and available within the AWeber Dashboard, ready to empower marketers worldwide to track, analyze, and dramatically improve their email marketing performance.



 Raul Delapena Setiawan