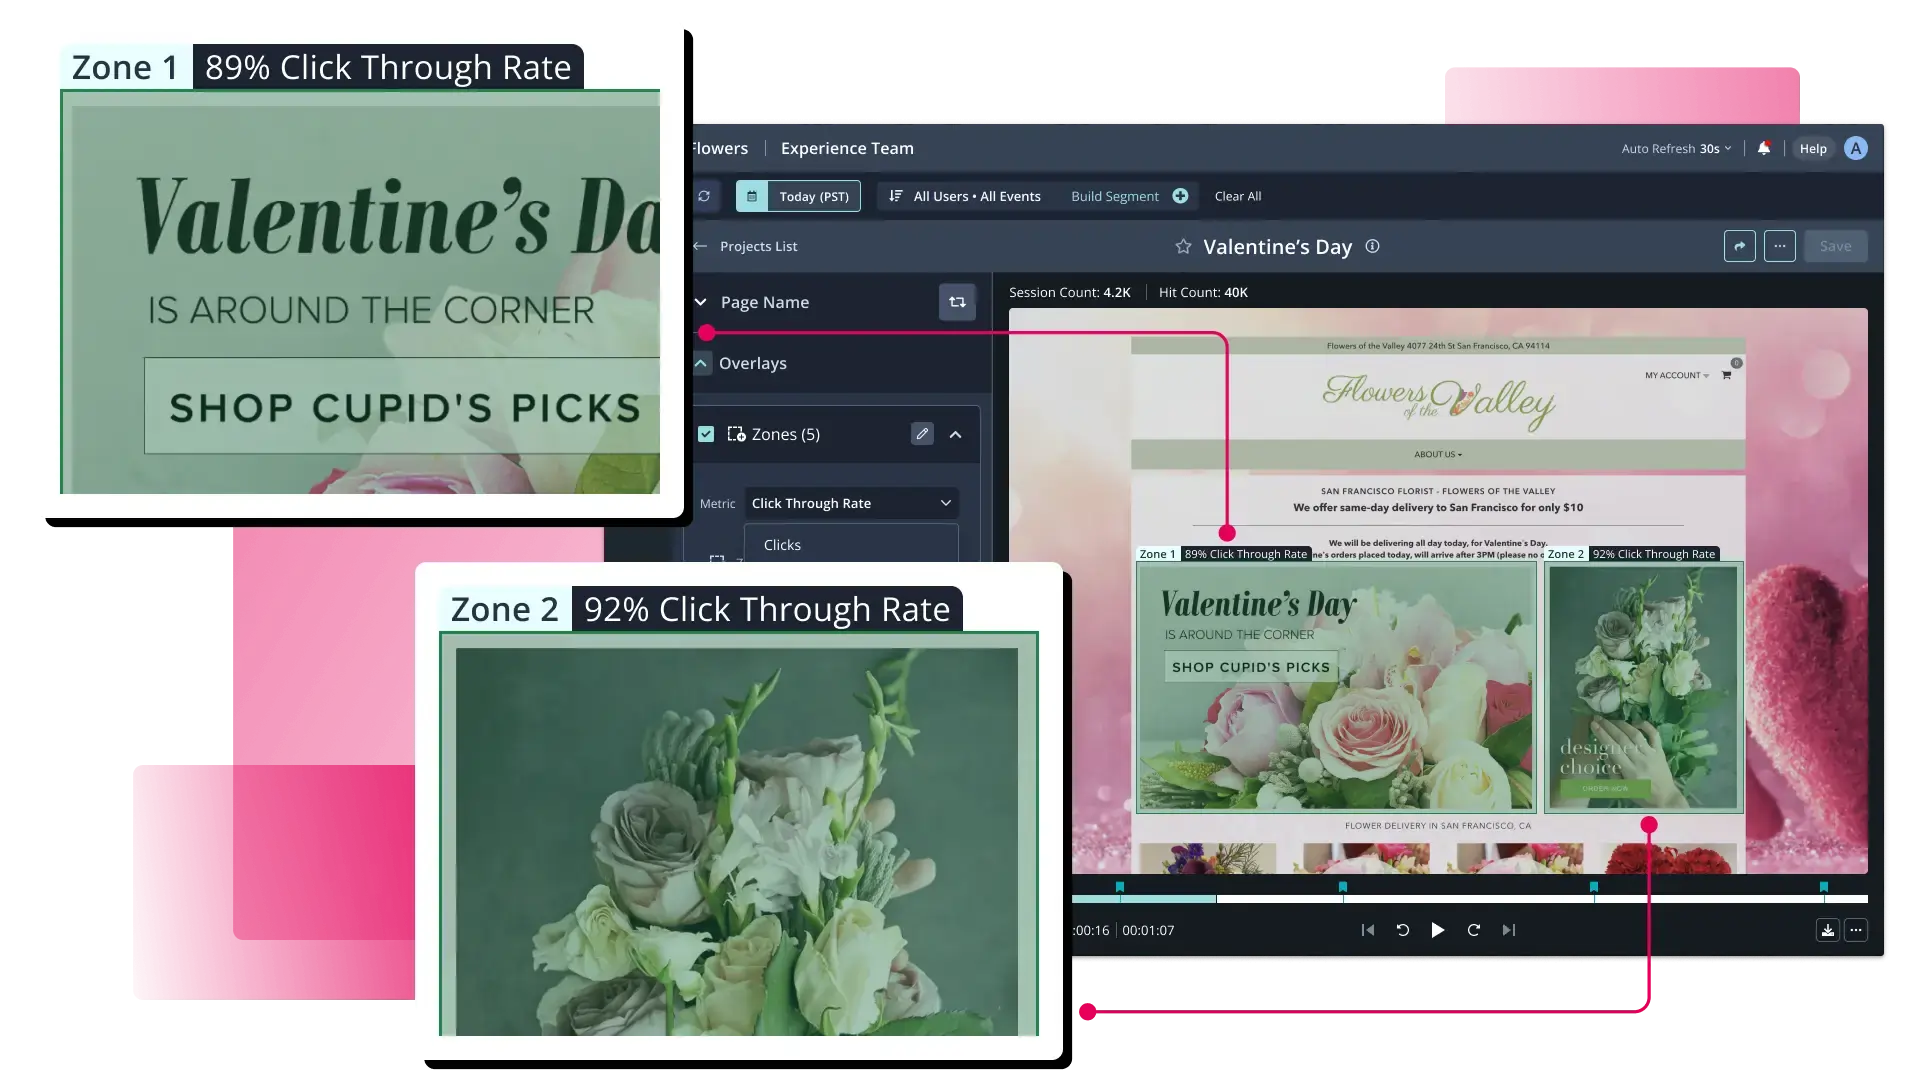
The digital landscape has shifted from basic traffic monitoring to a sophisticated era of Digital Experience Intelligence (DXI), where understanding the "why" behind user behavior is as critical as the "what." For modern in-house testing teams and conversion rate optimization (CRO) agencies, heatmap tools have emerged as the primary vehicle for deconstructing user interactions. By visualizing clicks, scrolls, and mouse movements, these platforms allow organizations to identify friction points and optimize website performance with surgical precision.
As the industry matures, the market for behavioral analytics has seen significant consolidation and technological advancement. A notable milestone occurred in July 2025, when Hotjar, a long-standing leader in the space, fully integrated its suite of feedback and behavior tools into the Contentsquare Group. This move highlights a broader trend: the convergence of qualitative user feedback with enterprise-grade data analytics.
The Evolution of Behavioral Analytics: A Chronology of Heatmapping
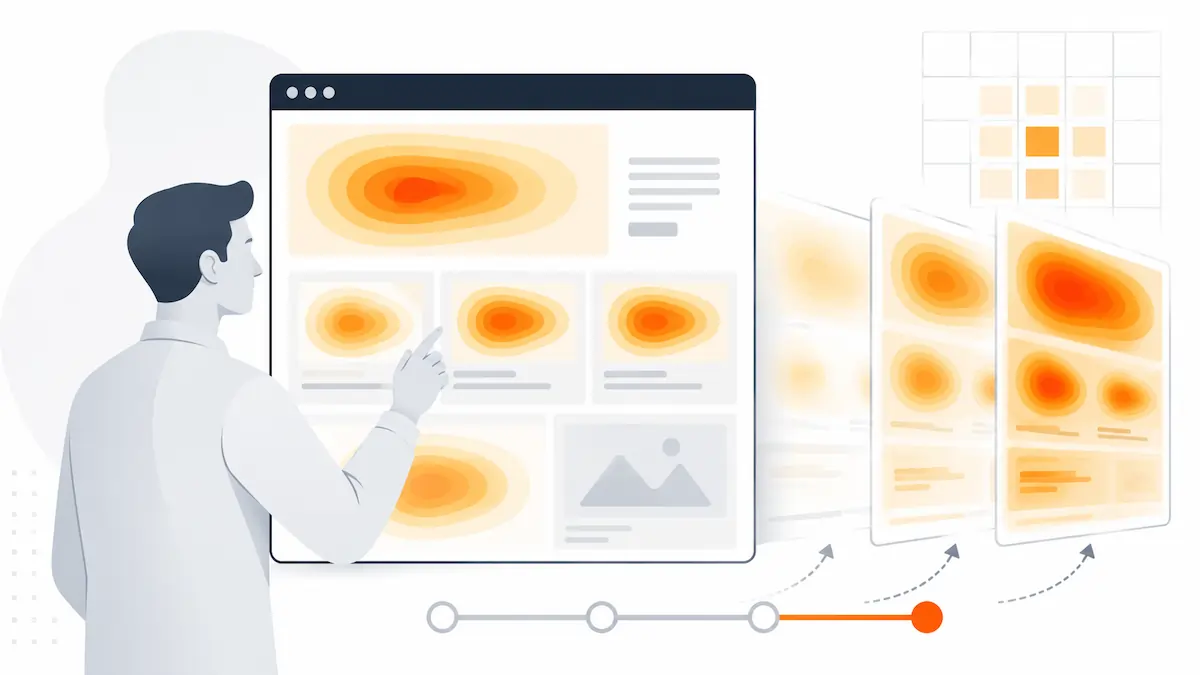
The history of heatmapping technology reflects the broader evolution of the web. In the early 2010s, heatmaps were largely static screenshots that provided a rudimentary "click cloud" of user activity. These early versions struggled with dynamic content, such as drop-down menus and parallax scrolling.
By the mid-2010s, the rise of Single Page Applications (SPAs) and heavy JavaScript environments necessitated the development of dynamic heatmapping. Tools like Inspectlet and Mouseflow began utilizing iframes and session recording synchronization to capture interactions on live, moving elements.
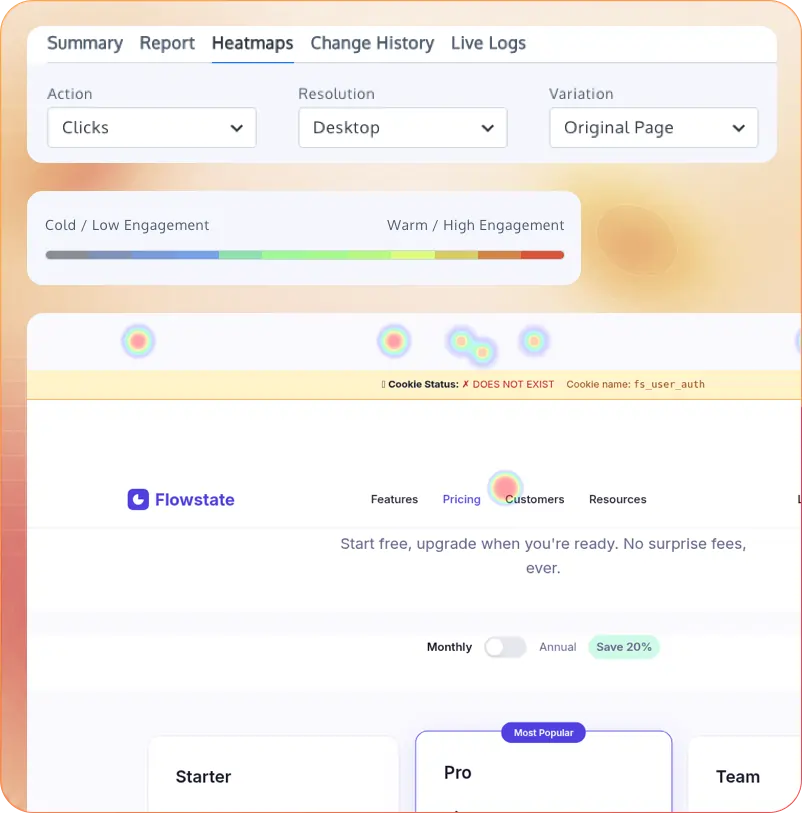
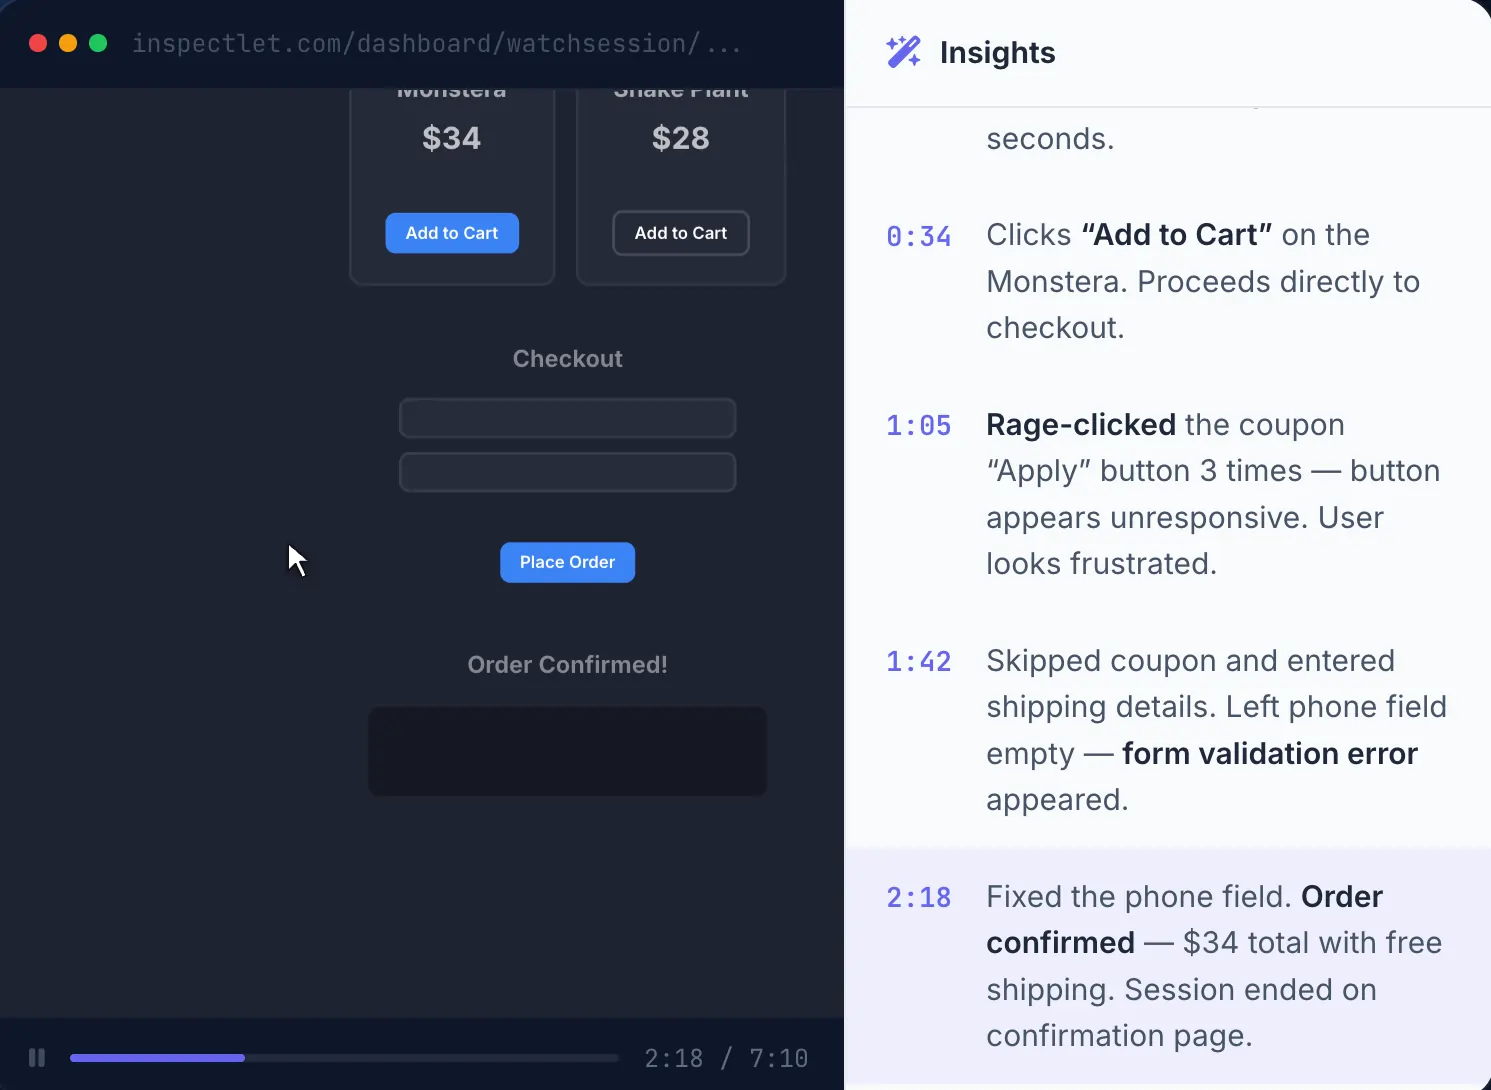
In the current decade, the focus has shifted toward "frustration detection" and revenue attribution. Modern platforms no longer just show where a user clicked; they identify "rage clicks," "dead clicks," and "hesitation patterns" using artificial intelligence. This chronological shift from observation to automated insight has transformed CRO from a reactive process to a predictive science.
Enterprise-Grade Solutions for Complex Digital Ecosystems
For large-scale organizations managing high-traffic volumes and complex conversion funnels, the requirements for a heatmap tool extend far beyond simple visualization. Enterprise solutions focus on scalability, data security, and deep integration with existing tech stacks.
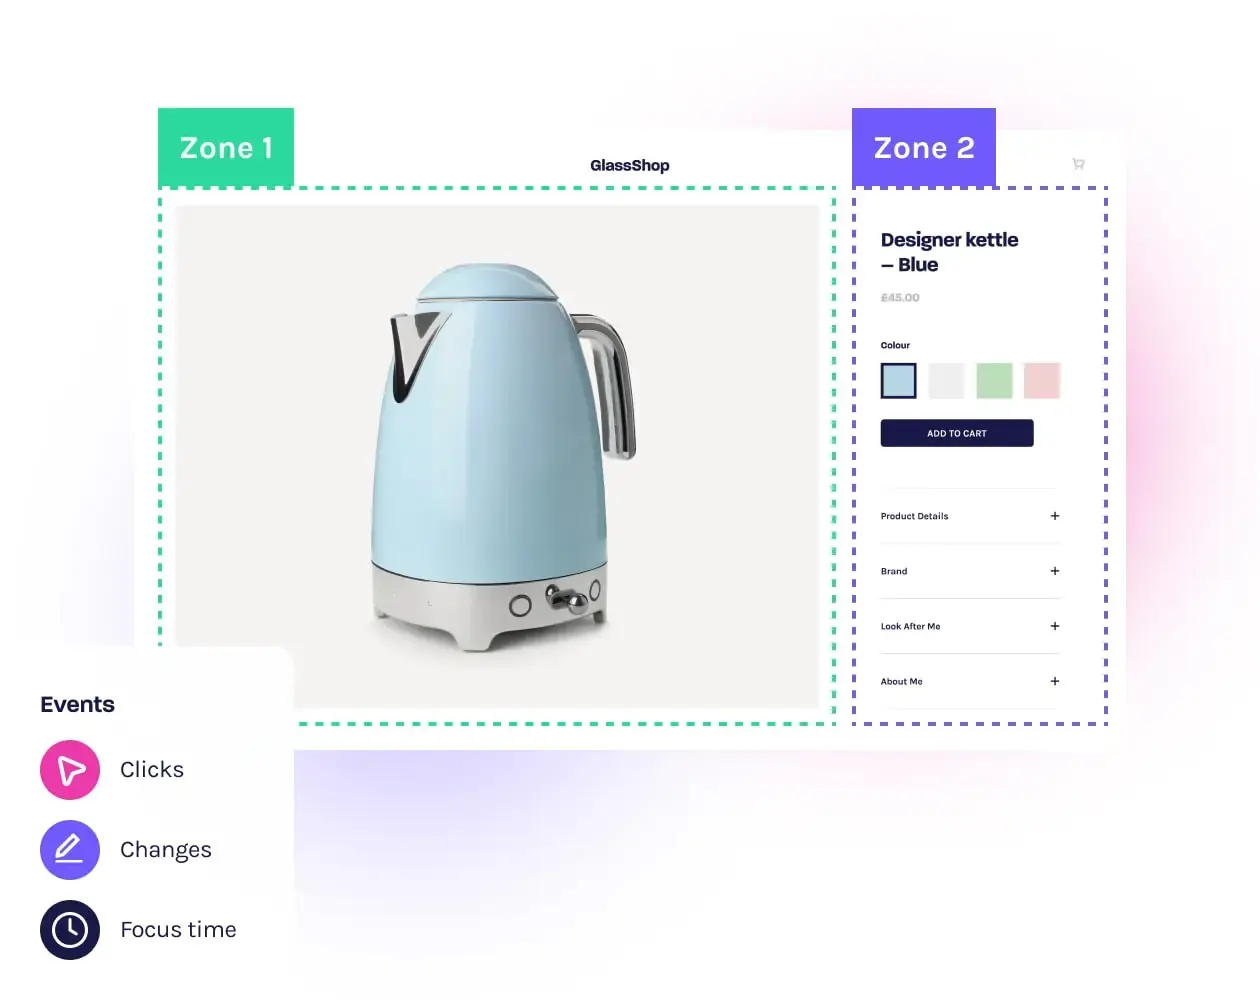
Glassbox and Quantum Metric represent the upper echelon of this category. Glassbox specializes in automatic interaction capture, removing the need for manual tagging, which is a significant hurdle for enterprise-level sites with thousands of pages. Their platform offers drag-and-drop funnel analysis and AI-powered insights to identify backend errors that correlate with UI friction.
Similarly, Quantum Metric has introduced "Felix AI," a feature designed to summarize user insights from thousands of session replays. In an era of big data, the challenge is no longer a lack of information but the time required to process it. By quantifying the financial impact of a technical glitch or a UI hurdle, these tools allow product managers to prioritize fixes based on potential ROI rather than subjective urgency.
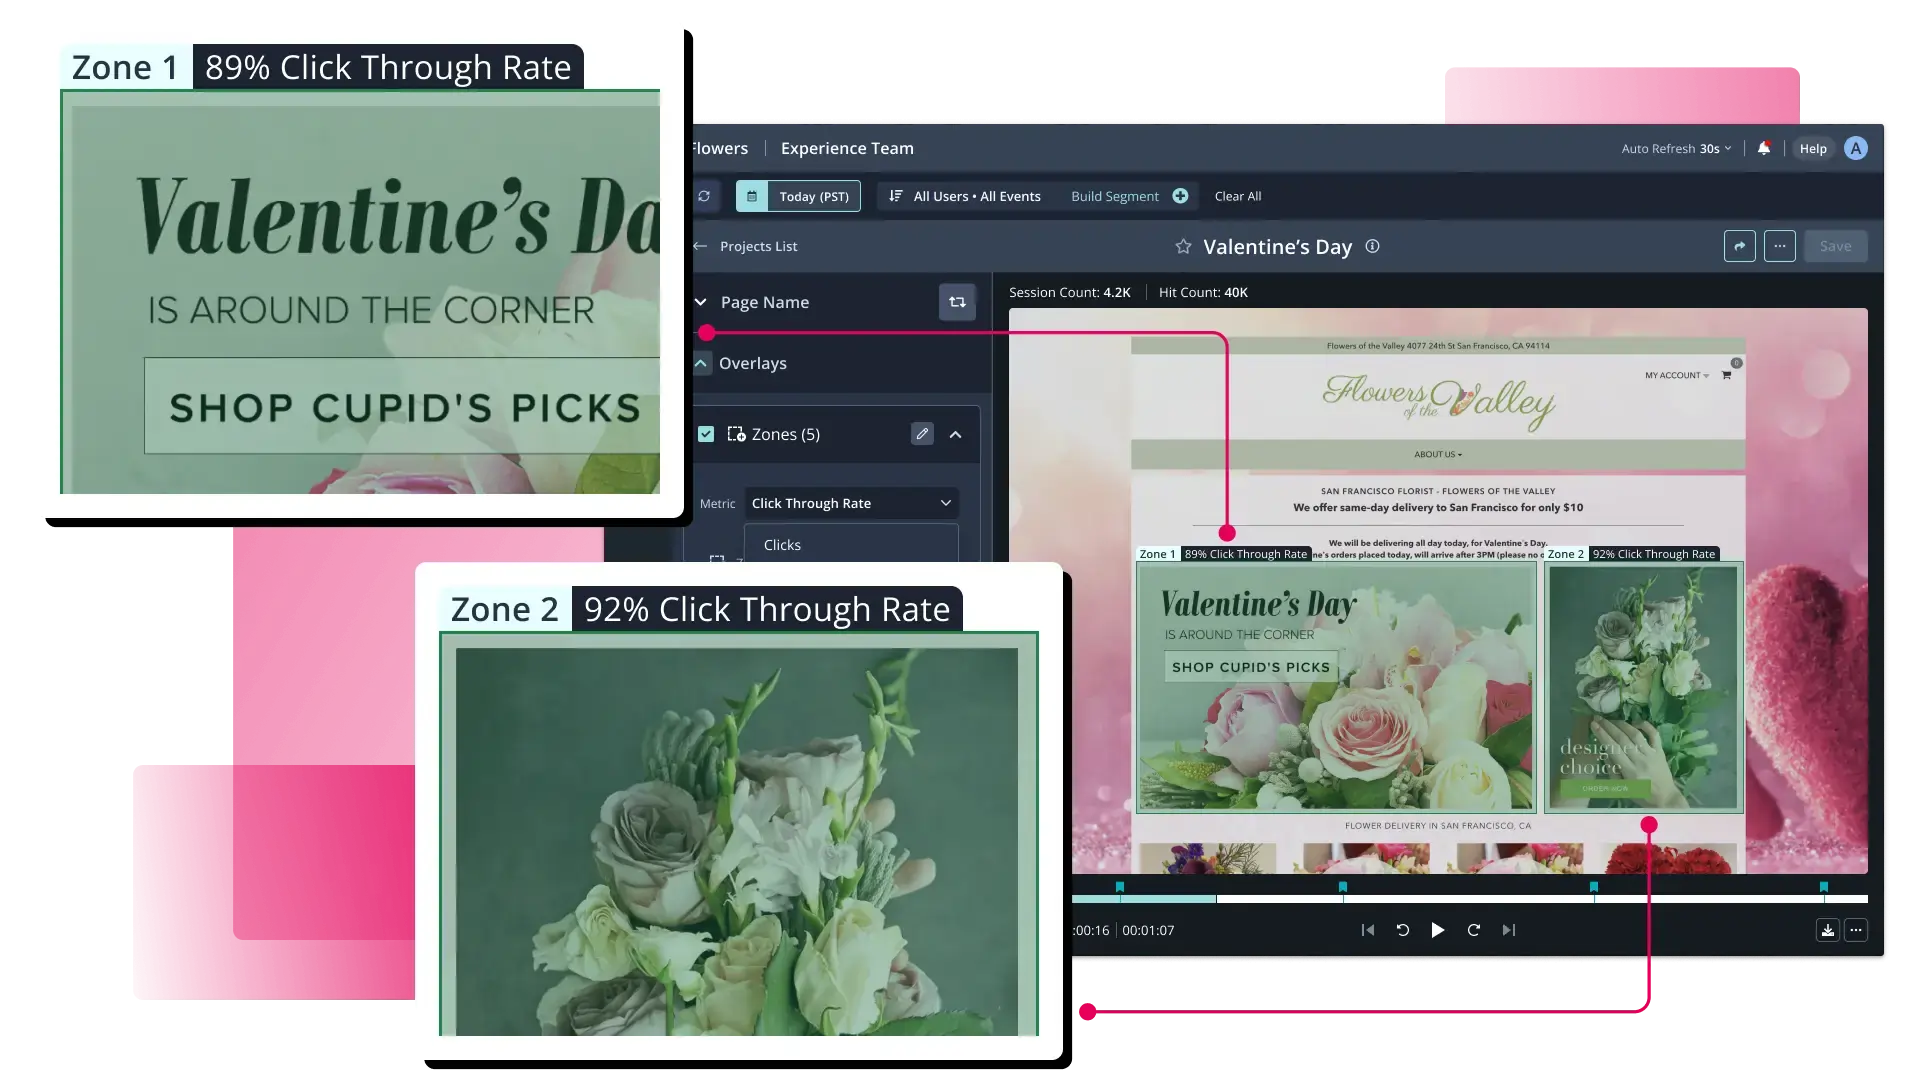
FullStory also remains a dominant force in the enterprise sector. Its "no-code" analytics approach allows non-technical team members to build complex funnels and monitor key performance indicators (KPIs) in real-time. The emphasis here is on "frustration signals," enabling teams to see exactly where a multi-page journey breaks down.
Revenue-Centric and E-commerce Optimization Tools
The e-commerce sector has unique requirements, specifically the need to tie behavioral data directly to transaction value. Heatmap.com has carved out a niche by focusing on Revenue Per Session (RPS) as its "north star" metric. Unlike traditional tools that treat all clicks equally, Heatmap.com attributes dollar values to specific page elements. This allows a merchant to see, for example, that while a "Related Products" widget gets fewer clicks than a hero banner, those clicks result in a higher average order value (AOV).
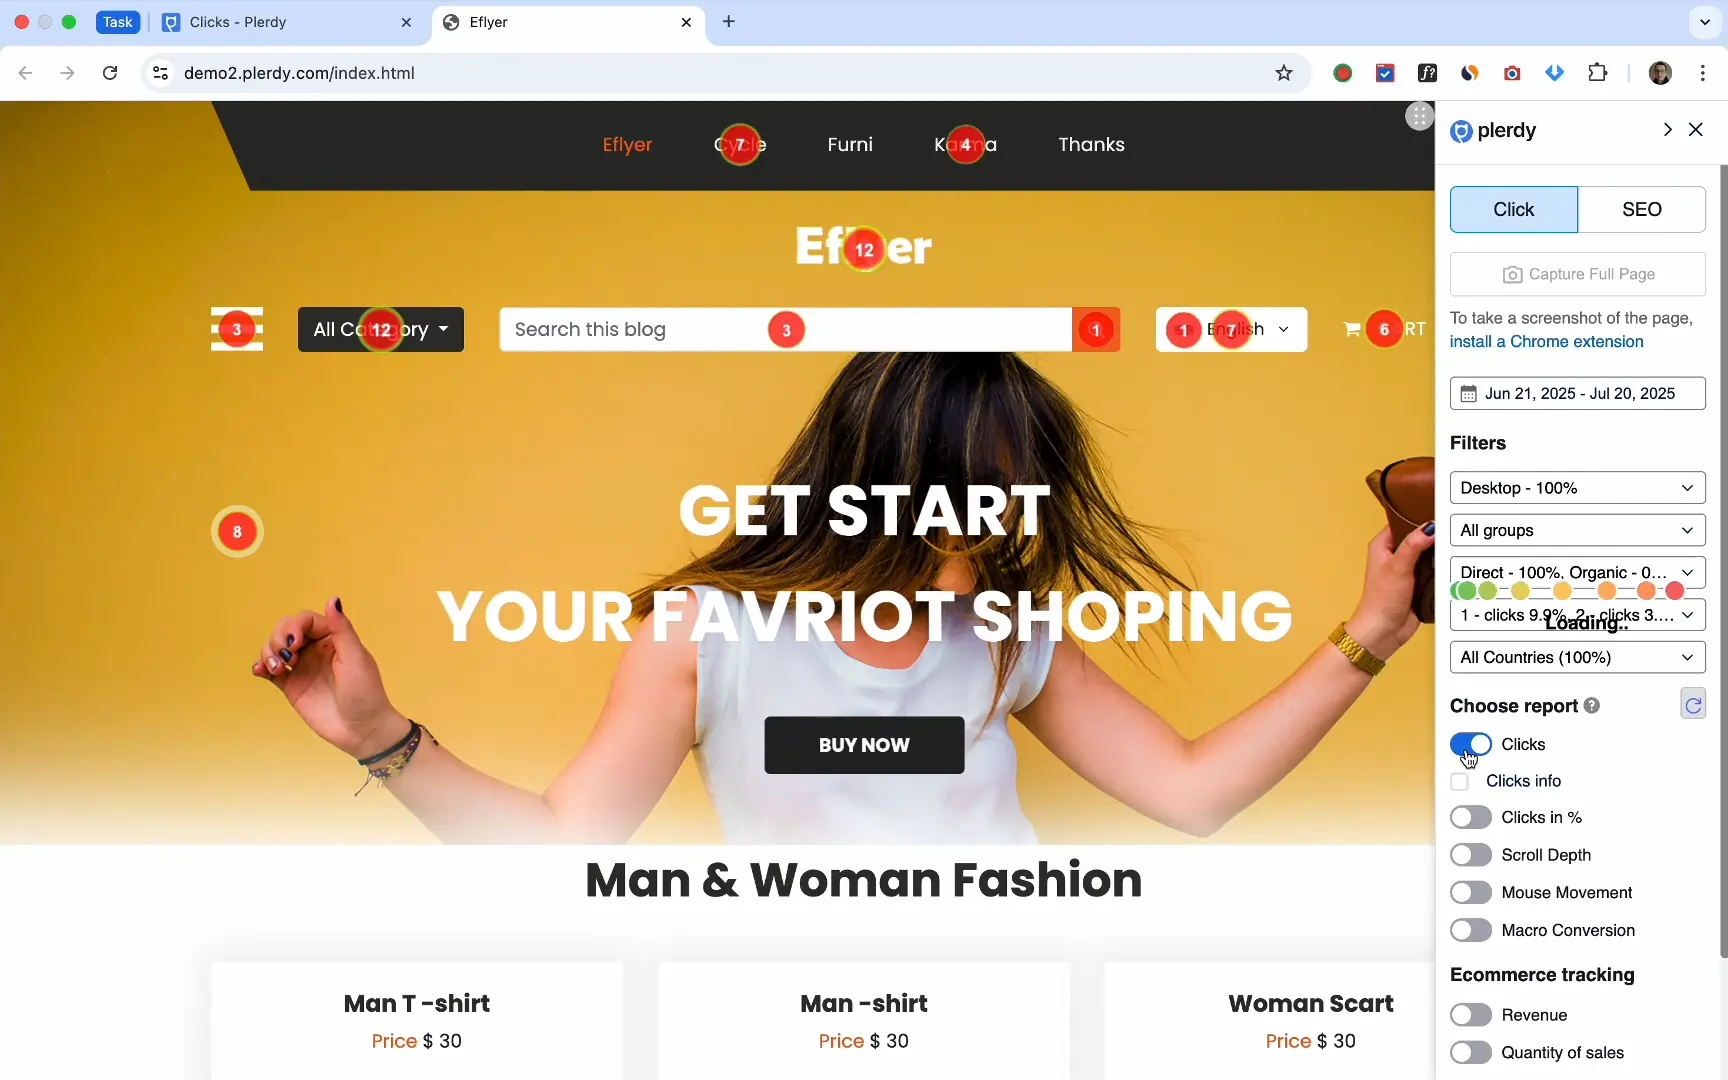
Plerdy and Lucky Orange offer similar advantages for e-commerce specialists. Plerdy provides a comprehensive suite that includes A/B testing and e-commerce-specific analytics with zero server load, a critical factor for maintaining site speed. Lucky Orange has recently introduced its "Discovery" feature, which uses AI to automatically surface optimization opportunities, such as identifying a high-traffic product page where users consistently stall before adding an item to the cart.
The Integration of Heatmaps and Experimentation Platforms
A significant shift in the CRO workflow is the move toward "all-in-one" experimentation hubs. Traditionally, a tester would identify a problem in a tool like Hotjar and then move to a separate platform like Convert Experiences or VWO to launch a test.
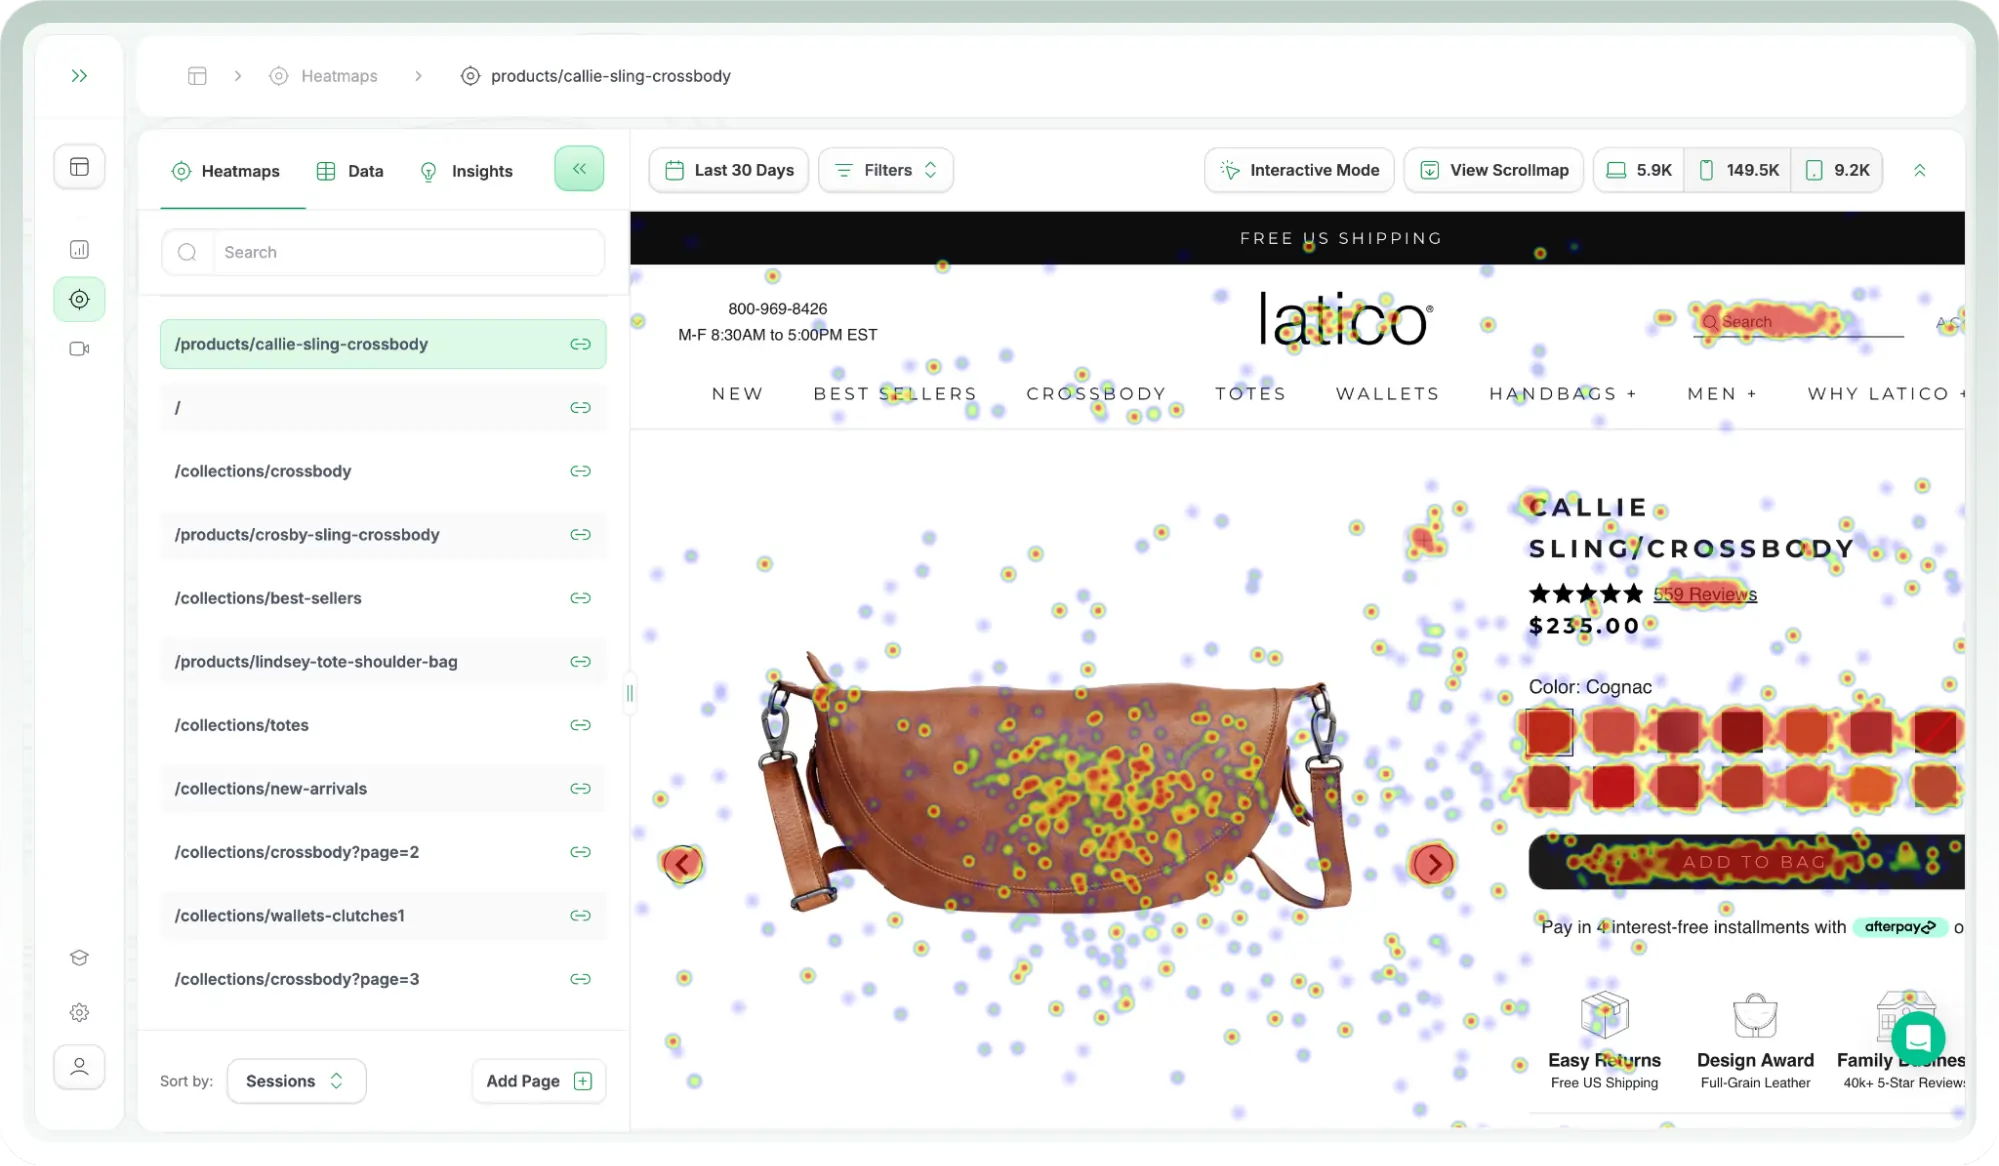
Convert Experiences has addressed this inefficiency by building native heatmaps directly into its experimentation engine. This allows testers to view heatmaps for each variation of an A/B test. If Version B of a landing page is outperforming Version A, the tester can immediately view the click and scroll data for that specific variation to understand why. This "Signals" feature also includes frustration detection, flagging sessions where users experience render delays or API slowness.
VWO Insights follows a similar philosophy, providing a centralized hub for heatmaps, session recordings, and form analysis. For UX researchers, having these tools under one roof reduces data silos and ensures that the qualitative "why" is always linked to the quantitative "how much."

Accessibility and the SMB Market: The Rise of Free and Low-Cost Tools
The democratization of behavioral analytics has been driven largely by Microsoft Clarity. By offering a "free forever" plan with no traffic limits, Microsoft has made enterprise-level features—such as rage click detection and Google Analytics integration—accessible to small business owners and independent bloggers.
Other tools like Mouseflow, Crazy Egg, and Contentsquare (formerly Hotjar) offer tiered pricing models that allow smaller teams to scale their usage. Mouseflow, for instance, provides a free plan for up to 500 monthly sessions, making it an ideal entry point for startups looking to validate their initial user experience. Crazy Egg, one of the pioneers of the industry, continues to be a favorite for small e-commerce teams due to its straightforward visualization of traffic sources and segmented click analysis.
Supporting Data: Why Heatmapping is Non-Negotiable
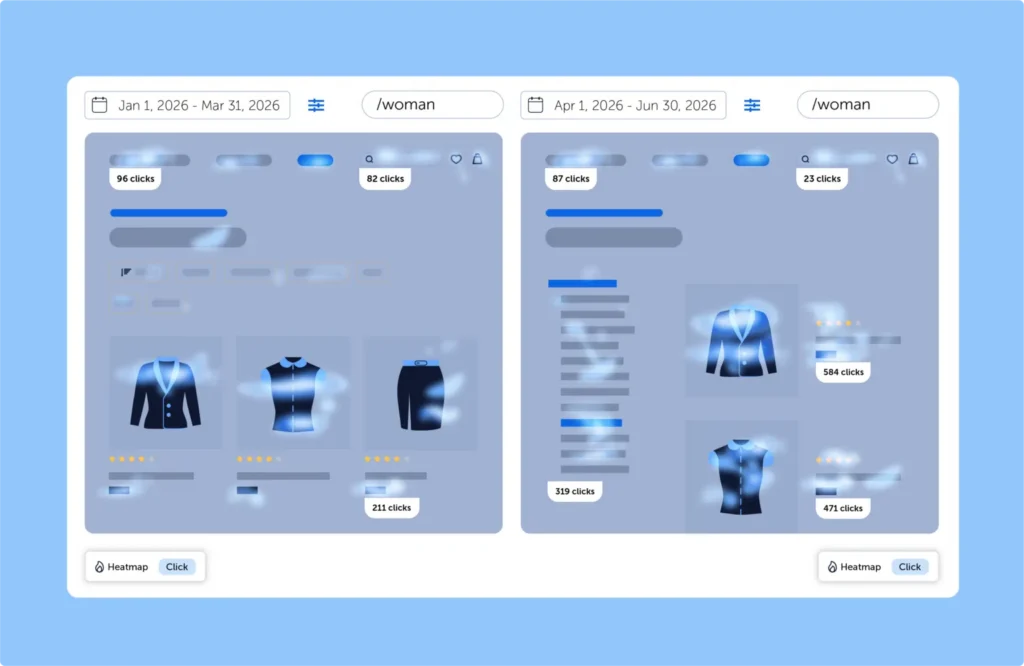
Industry data suggests that companies using behavioral analytics see a significant lift in conversion rates compared to those relying solely on traditional web analytics. According to various CRO benchmarks, identifying and fixing a single "friction point" in a checkout funnel can result in a 10% to 30% increase in completed transactions.
Furthermore, the "dead click" phenomenon—where a user clicks an element that is not interactive—is one of the leading causes of mobile site abandonment. Heatmap data reveals that on average, 12% of mobile users encounter at least one dead click per session. Without heatmapping software, these silent conversion killers remain invisible to site owners.
Official Responses and Industry Implications
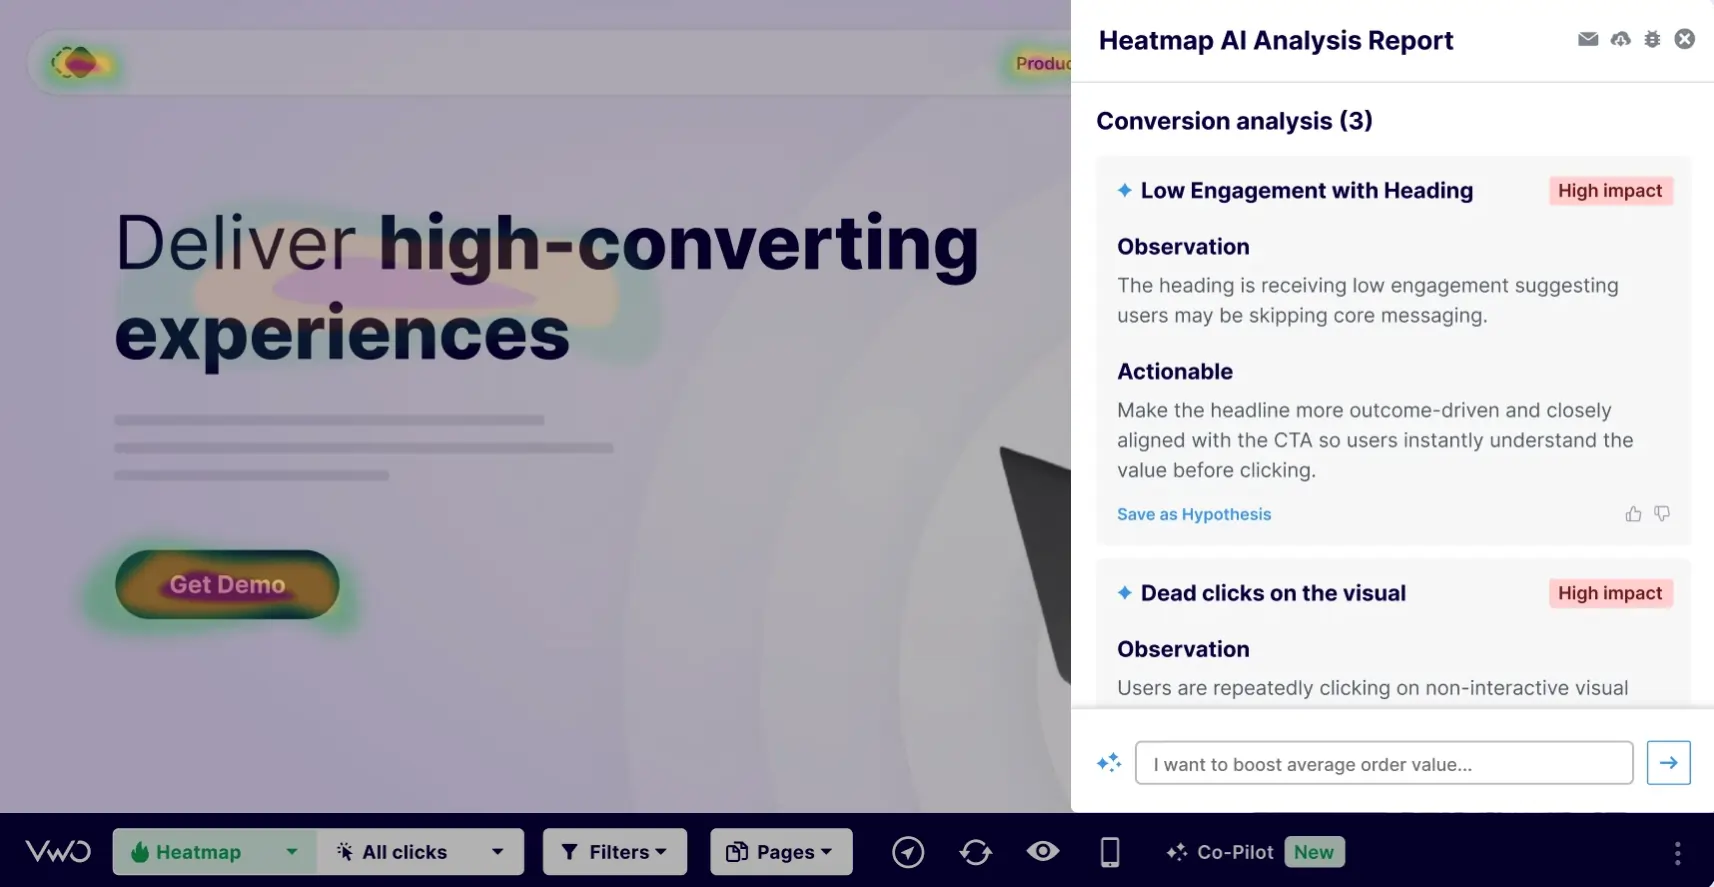
Industry experts and product leads at these major firms suggest that the future of the sector lies in "autonomic optimization." In recent statements, representatives from several top-tier heatmap providers indicated that the next phase of development involves AI agents that not only identify problems but also suggest specific design changes or even automatically generate A/B test variations to solve the identified issues.
The broader impact of these tools extends to privacy and data ethics. With the implementation of GDPR in Europe and CCPA in California, heatmap vendors have had to overhaul their data collection methods. Most modern tools now offer built-in PII (Personally Identifiable Information) masking, ensuring that while user behavior is tracked, individual identities remain protected. This balance between granular insight and user privacy is now a standard requirement for any tool entering the market.
Strategic Implementation and Best Practices
For organizations looking to select a tool, the decision should be guided by three primary criteria:
- Feature Set: Does the tool offer click, scroll, and mouse movement maps? Does it include frustration detection?
- Scalability: Can the tool handle the site’s peak traffic without impacting load times?
- Integration: Does it play well with the existing A/B testing and CRM software?
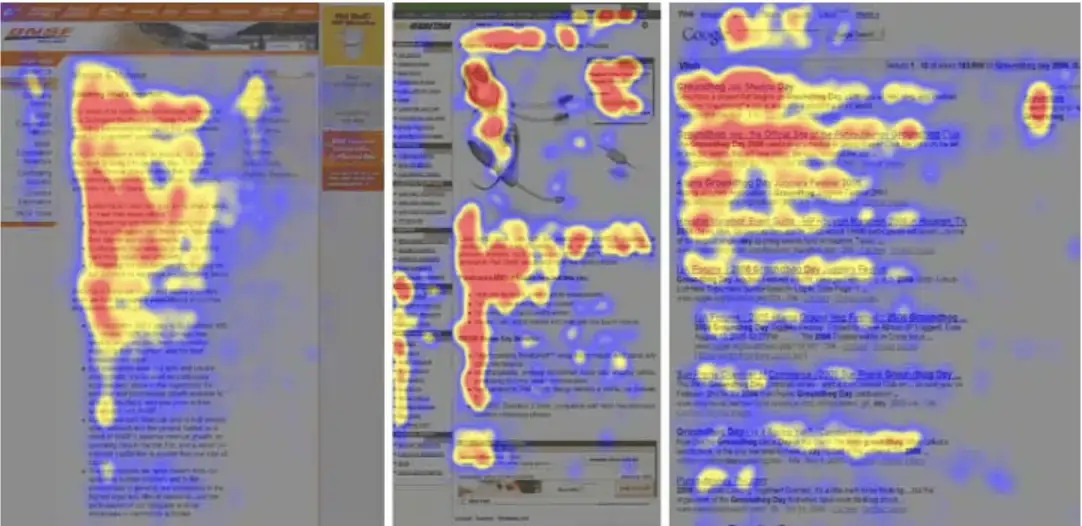
A logical workflow for implementing these tools involves first using scrollmaps to determine if key content is being seen, then using clickmaps to see if users are interacting with the correct elements, and finally using session recordings to "zoom in" on the specific moments where users struggle.
Broader Impact: The End of "Gut-Feeling" Design
The widespread adoption of heatmapping software marks the end of an era where website design was driven by the "Highest Paid Person’s Opinion" (HiPPO). In a professional journalistic context, the evidence is clear: data-driven design is no longer a luxury but a requirement for survival in the digital economy.
As AI continues to integrate with behavioral data, the speed at which companies can iterate on their user experience will only increase. Organizations that fail to adopt these tools risk falling behind competitors who can see exactly where their customers are frustrated and move to fix those issues in real-time. Whether through a free tool like Microsoft Clarity or an enterprise powerhouse like Glassbox, the ability to see through the eyes of the user remains the most powerful advantage in the digital age.