


The digital landscape has undergone a seismic shift as businesses transition from simple traffic metrics to deep behavioral analysis to sustain growth in an increasingly competitive e-commerce environment. As third-party cookies continue to phase out and data privacy regulations tighten, marketing and product teams are turning to first-party behavioral data to understand the "why" behind user actions. Heatmap tools have emerged as the cornerstone of this analytical shift, providing a visual layer to quantitative data that allows organizations to identify friction points, optimize user journeys, and significantly boost conversion rates. By tracking clicks, scrolls, and mouse movements, these platforms transform raw session data into actionable intelligence, bridging the gap between technical performance and human psychology.
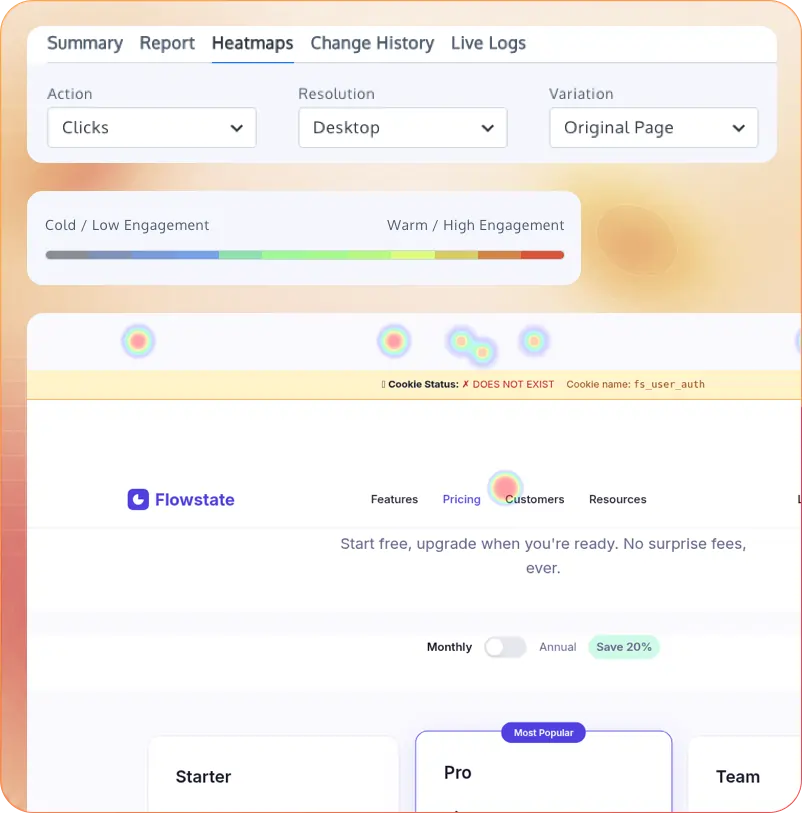
The Evolution of Behavioral Analytics and the Rise of Heatmapping
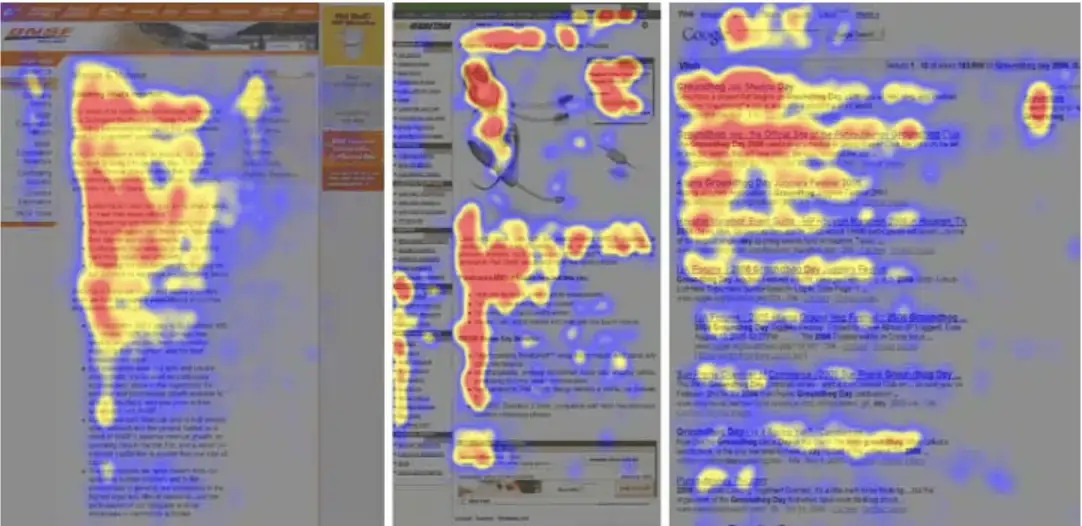
The concept of heatmapping traces its roots back to the late 19th century, but its application in web design became prominent in the mid-1990s as a way to visualize eye-tracking studies. Over the last decade, the technology has evolved from static screenshots to dynamic, real-time overlays that can handle complex Single Page Applications (SPAs) and AJAX-heavy content. According to industry reports, the global Conversion Rate Optimization (CRO) software market is projected to grow at a compound annual growth rate (CAGR) of over 10% through 2030, driven largely by the integration of artificial intelligence and machine learning into behavioral tools.
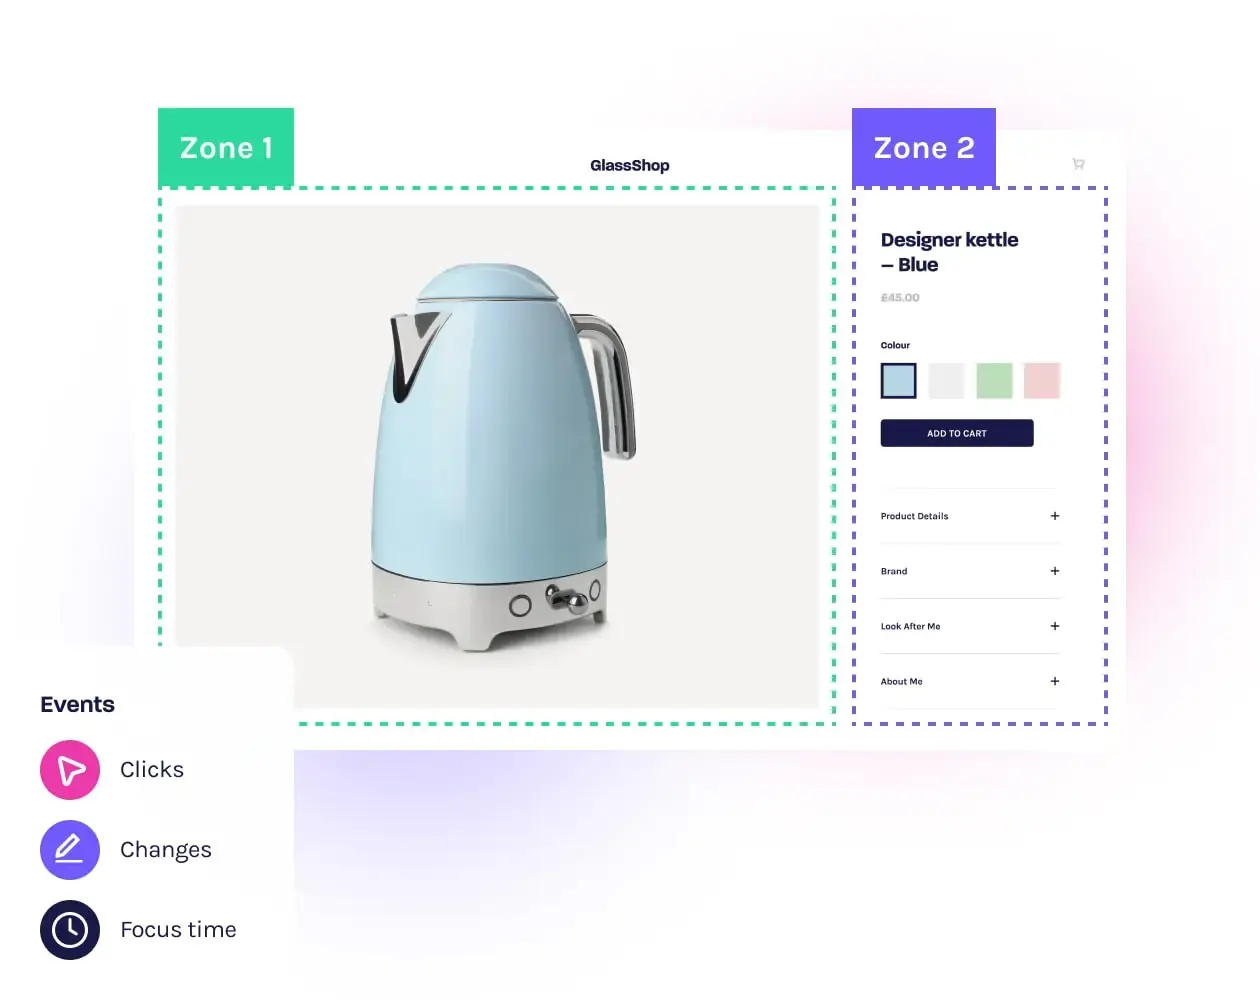
Modern heatmapping is no longer a standalone feature but a component of broader Digital Experience Intelligence (DXI) platforms. This integration allows testers to see not just where a user clicked, but how that specific click relates to an A/B test variation or a specific revenue outcome. The recent consolidation in the industry—most notably the acquisition of Hotjar by Contentsquare—underscores the move toward unified platforms that combine qualitative feedback with quantitative behavioral data.

Comparative Analysis of Leading Heatmap Solutions
Selecting the appropriate tool requires an understanding of the specific needs of a business, ranging from scrappy startups to global enterprises. The following analysis explores the top contenders in the market based on feature depth, scalability, and integration capabilities.
Integrated Experimentation and Behavioral Insights: Convert Experiences
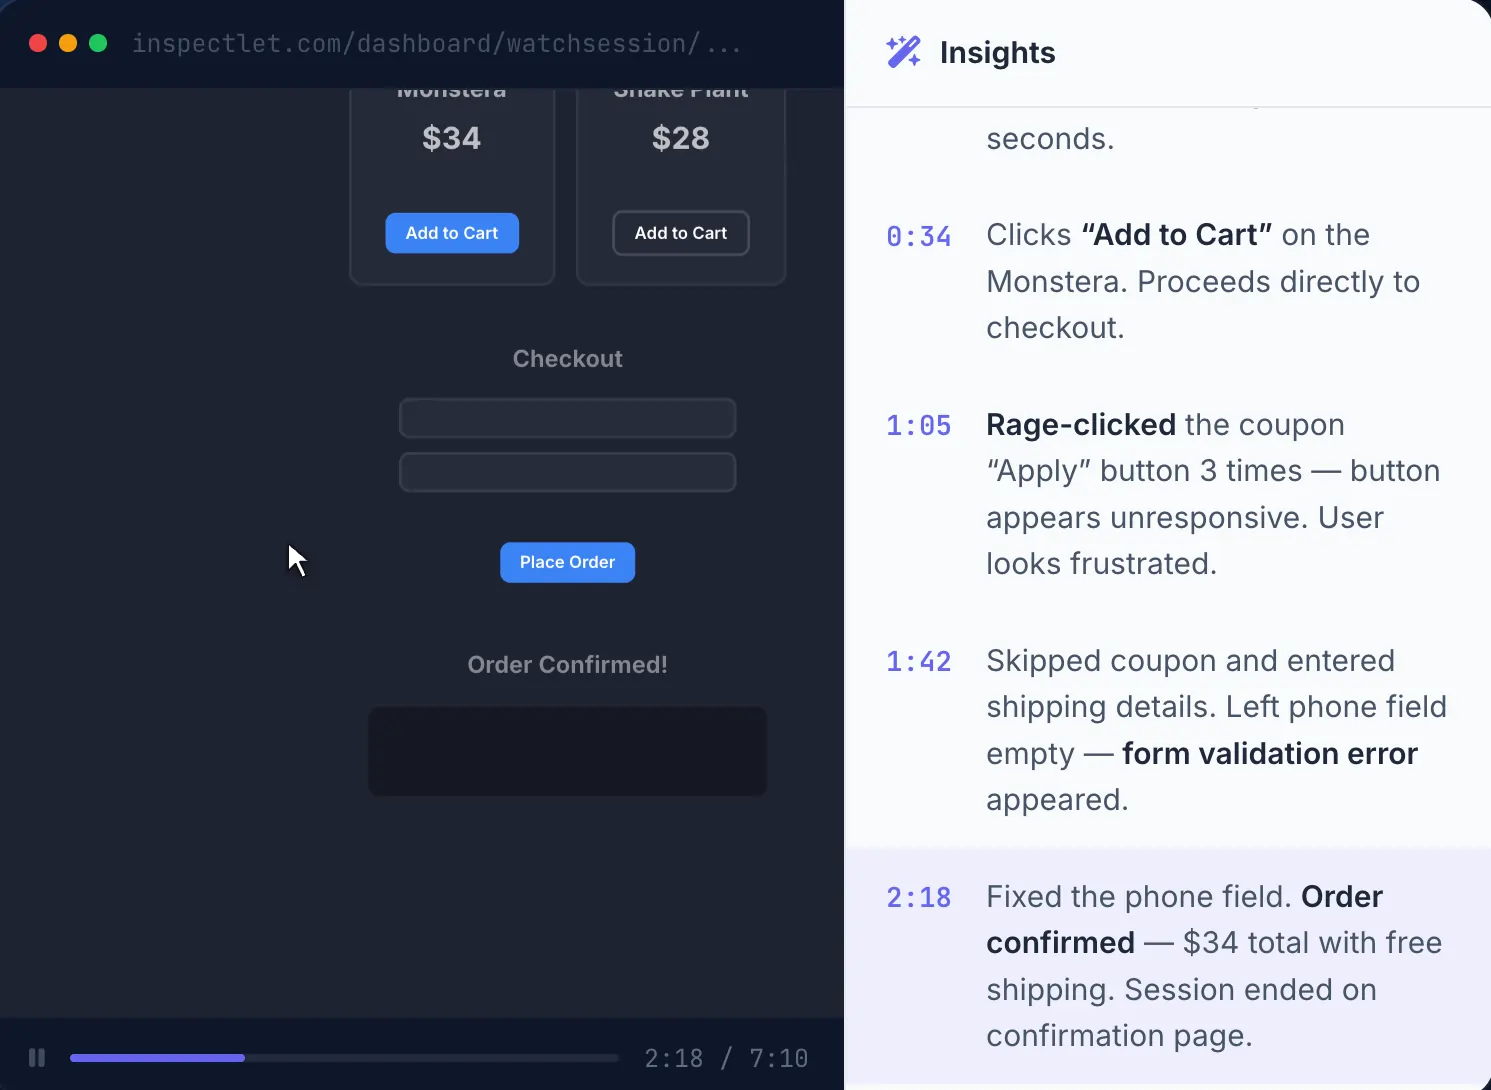
For conversion teams that prioritize efficiency, Convert Experiences offers a unique value proposition by nesting native heatmaps directly within its A/B testing platform. This eliminates the "data silo" problem where researchers must jump between tools to correlate test results with user behavior. Its proprietary "Signals" feature acts as an automated frustration detector, flagging sessions characterized by rage clicks or "scroll stalls." This proactive approach allows teams to skip manual review and move directly to high-impact sessions, making it a favorite for mid-market agencies and in-house CRO teams.
Enterprise-Grade Journey Mapping: Glassbox and Quantum Metric
In the enterprise sector, the focus shifts toward complex funnels and technical performance. Glassbox specializes in "frictionless" data capture, requiring no manual tagging to track interactions. It is designed for high-volume environments where understanding the technical cause of a drop-off—such as a backend API delay—is just as important as the UI layout. Similarly, Quantum Metric utilizes its "Felix AI" to summarize user insights, allowing product managers to quantify the financial impact of a specific bug or UI hurdle across millions of sessions in real-time.

Accessibility and the Impact of Big Tech: Microsoft Clarity
The entry of Microsoft into the behavioral analytics space with Microsoft Clarity fundamentally changed the market dynamics. By offering a robust, "free forever" tool that includes heatmaps and session recordings with no traffic caps, Microsoft lowered the barrier to entry for small businesses. While it lacks the deep experimentation features of paid tools, its seamless integration with Google Analytics and its focus on privacy and site performance have made it a ubiquitous choice for those beginning their optimization journey.
Revenue-Centric Optimization: Heatmap.com
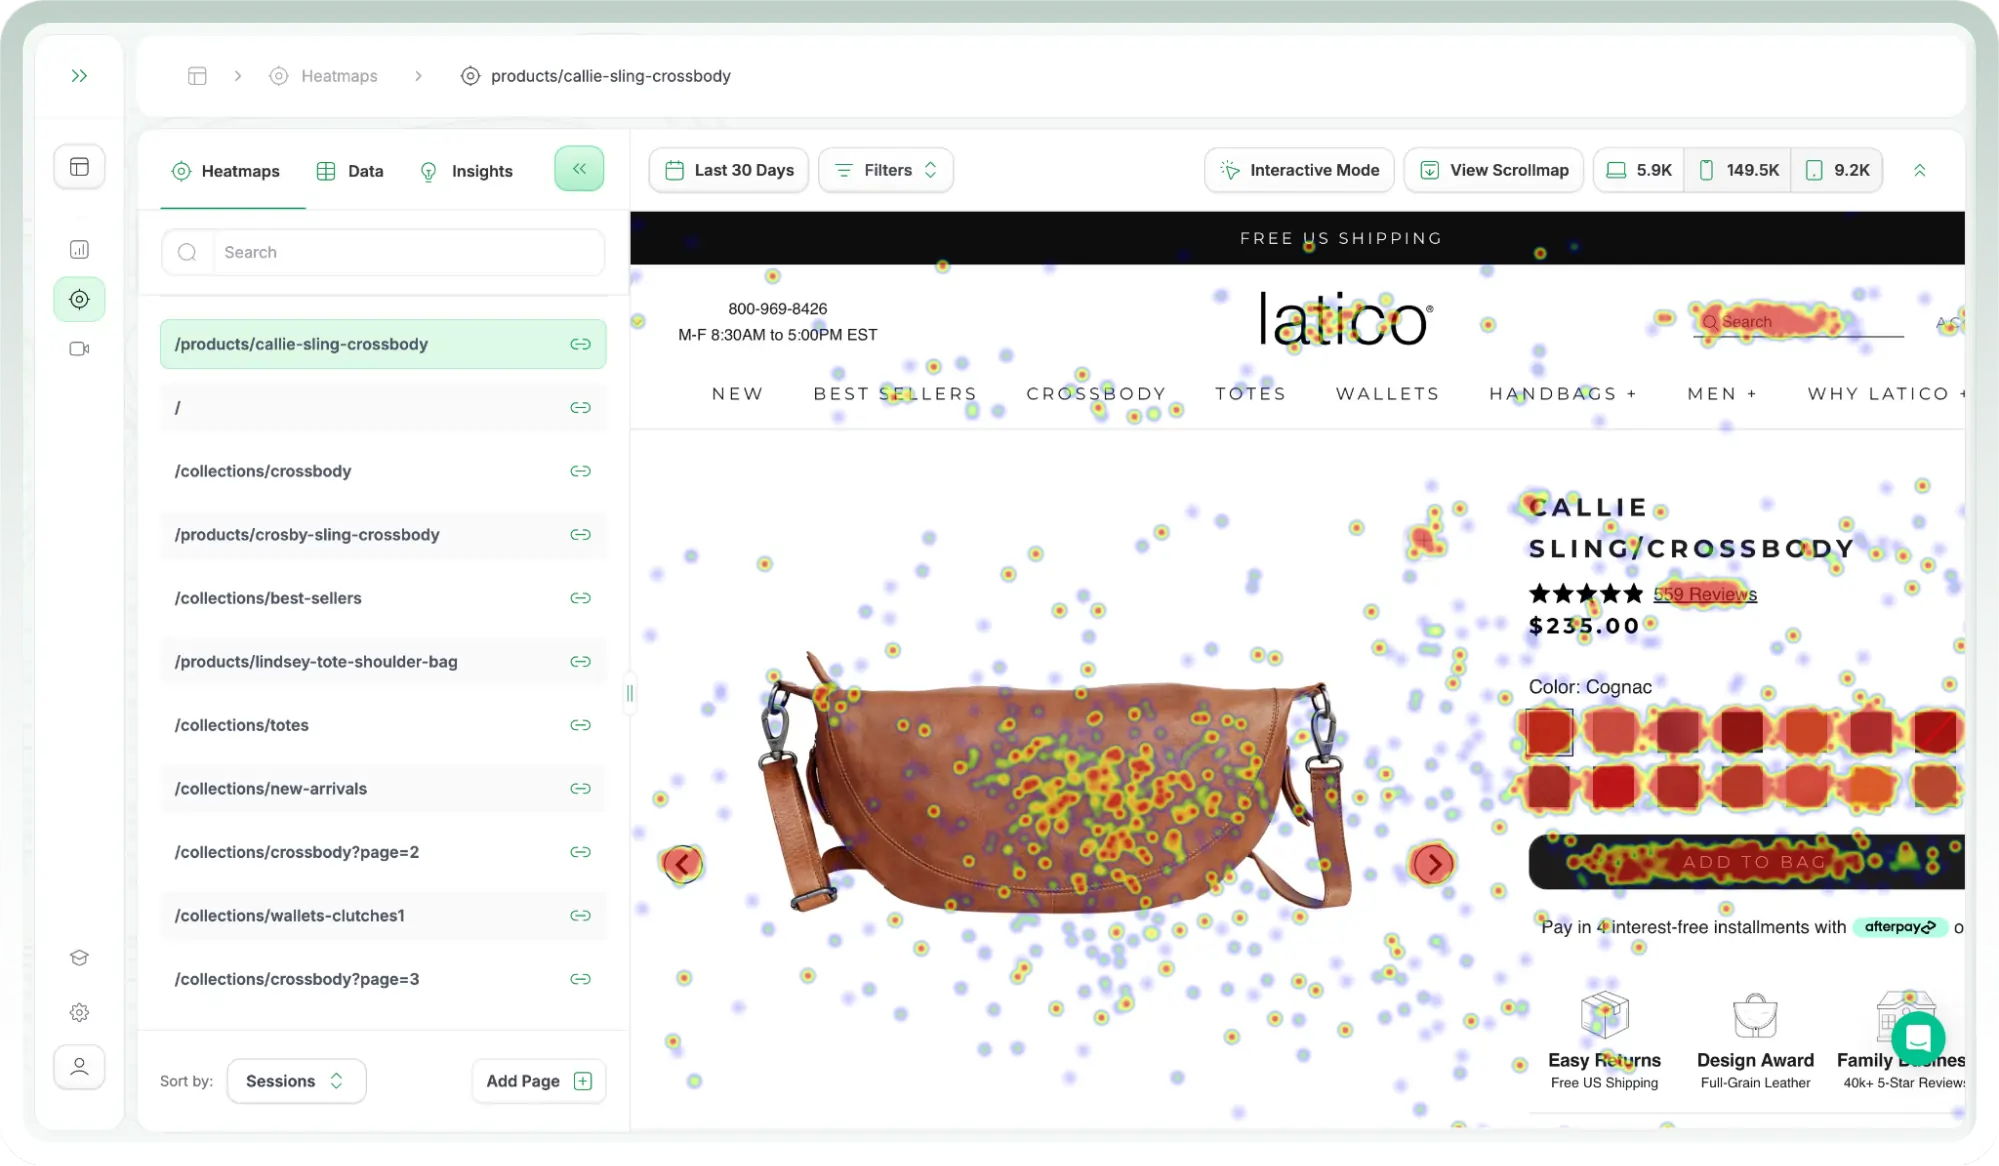
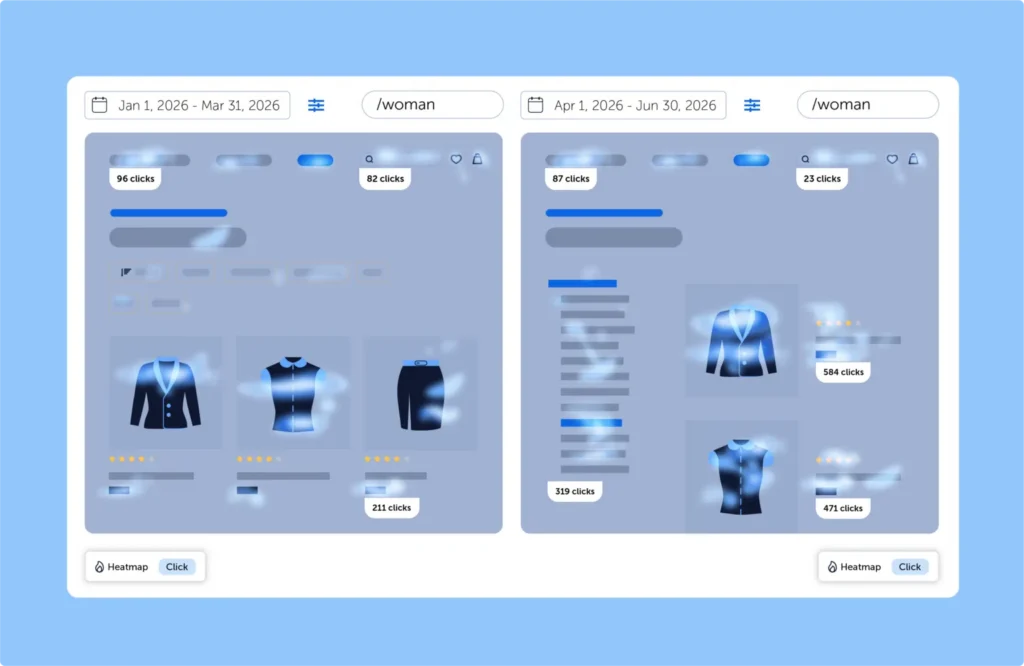
A specialized segment of the market is now focusing on direct financial attribution. Heatmap.com distinguishes itself by moving beyond click density to "Revenue Per Session" (RPS) metrics. For e-commerce and Direct-to-Consumer (DTC) brands, knowing that a button was clicked is less important than knowing if that button contributed to a high-value purchase. By tying actual dollars to specific page elements, this tool allows marketers to prioritize design changes based on ROI rather than engagement alone.
Technical Mechanics: How Modern Heatmaps Function
The underlying technology of these tools relies on lightweight JavaScript snippets that capture the Document Object Model (DOM) of a webpage. Unlike early versions that relied on static screenshots, modern "dynamic" heatmaps record the state of the page as the user sees it, including expanded menus, pop-ups, and interactive elements.
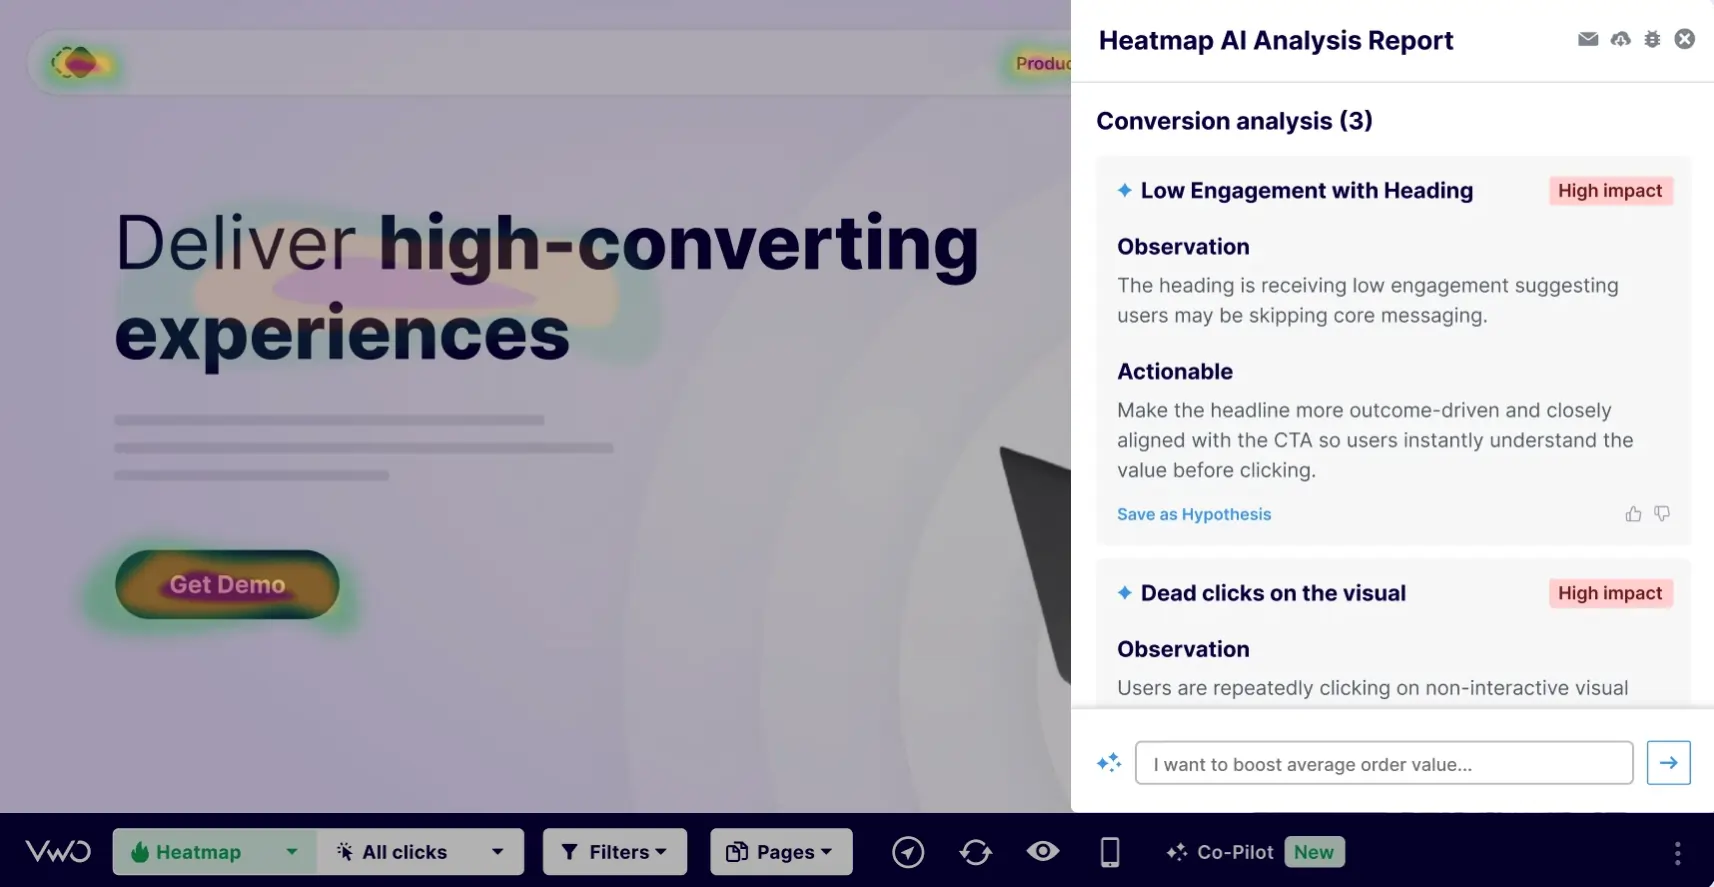
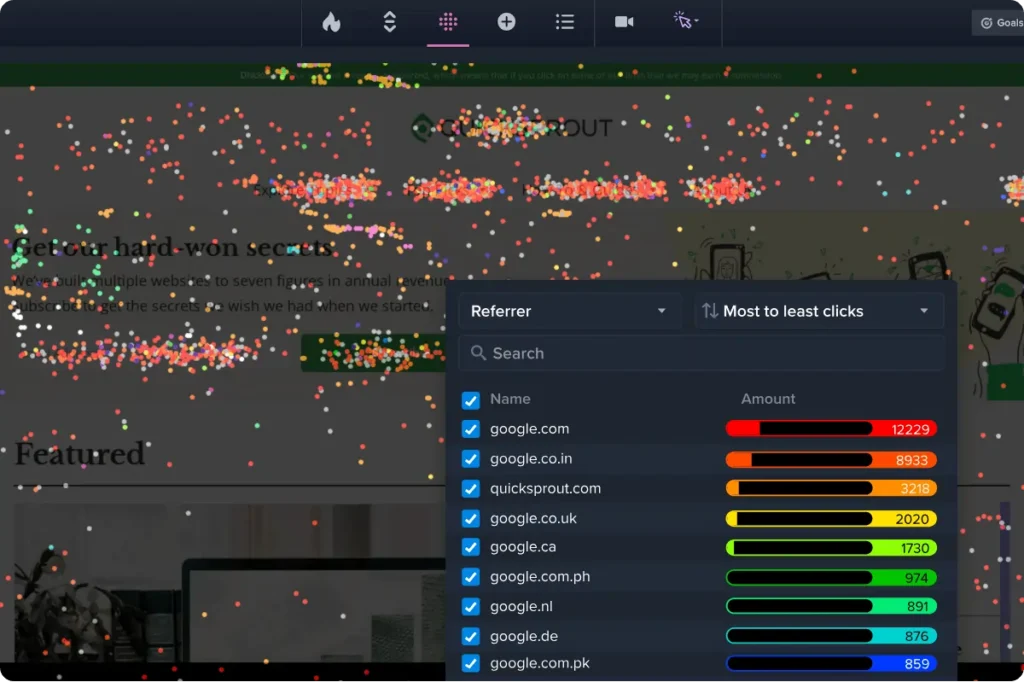
- Click and Tap Maps: These visualize where users interact with links, buttons, and non-clickable elements. High activity on non-links often indicates a "dead click" where users expect an interaction that does not exist.
- Scroll Maps: These show the percentage of users who reach specific depths of a page. This data is critical for determining the placement of "Calls to Action" (CTAs) and ensuring that key information is not buried below the "fold."
- Move/Attention Maps: By tracking mouse movement, these tools proxy for eye-tracking, showing which sections of a page are being read or ignored.
Industry Perspectives and Regulatory Compliance
The use of behavioral tracking has drawn scrutiny from privacy advocates, leading to significant innovations in data masking. Most top-tier heatmap providers now include automated PII (Personally Identifiable Information) masking, ensuring that sensitive data entered into forms is never recorded or stored.

Industry experts suggest that the future of heatmapping lies in "Predictive Analytics." Rather than waiting for thousands of users to visit a page, AI models trained on trillions of data points can now predict with high accuracy where a user is likely to look or click on a new design. "We are moving from a reactive model of ‘what happened’ to a proactive model of ‘what will happen,’" says one lead strategist at a major CRO agency. "Heatmaps are the training data for the next generation of AI-driven design."
Strategic Implementation and Broader Impact
For organizations to derive value from these tools, the data must be integrated into a broader optimization framework. The standard chronology of a successful CRO project typically involves:
- Identification: Using Google Analytics or similar tools to find high-traffic pages with low conversion rates.
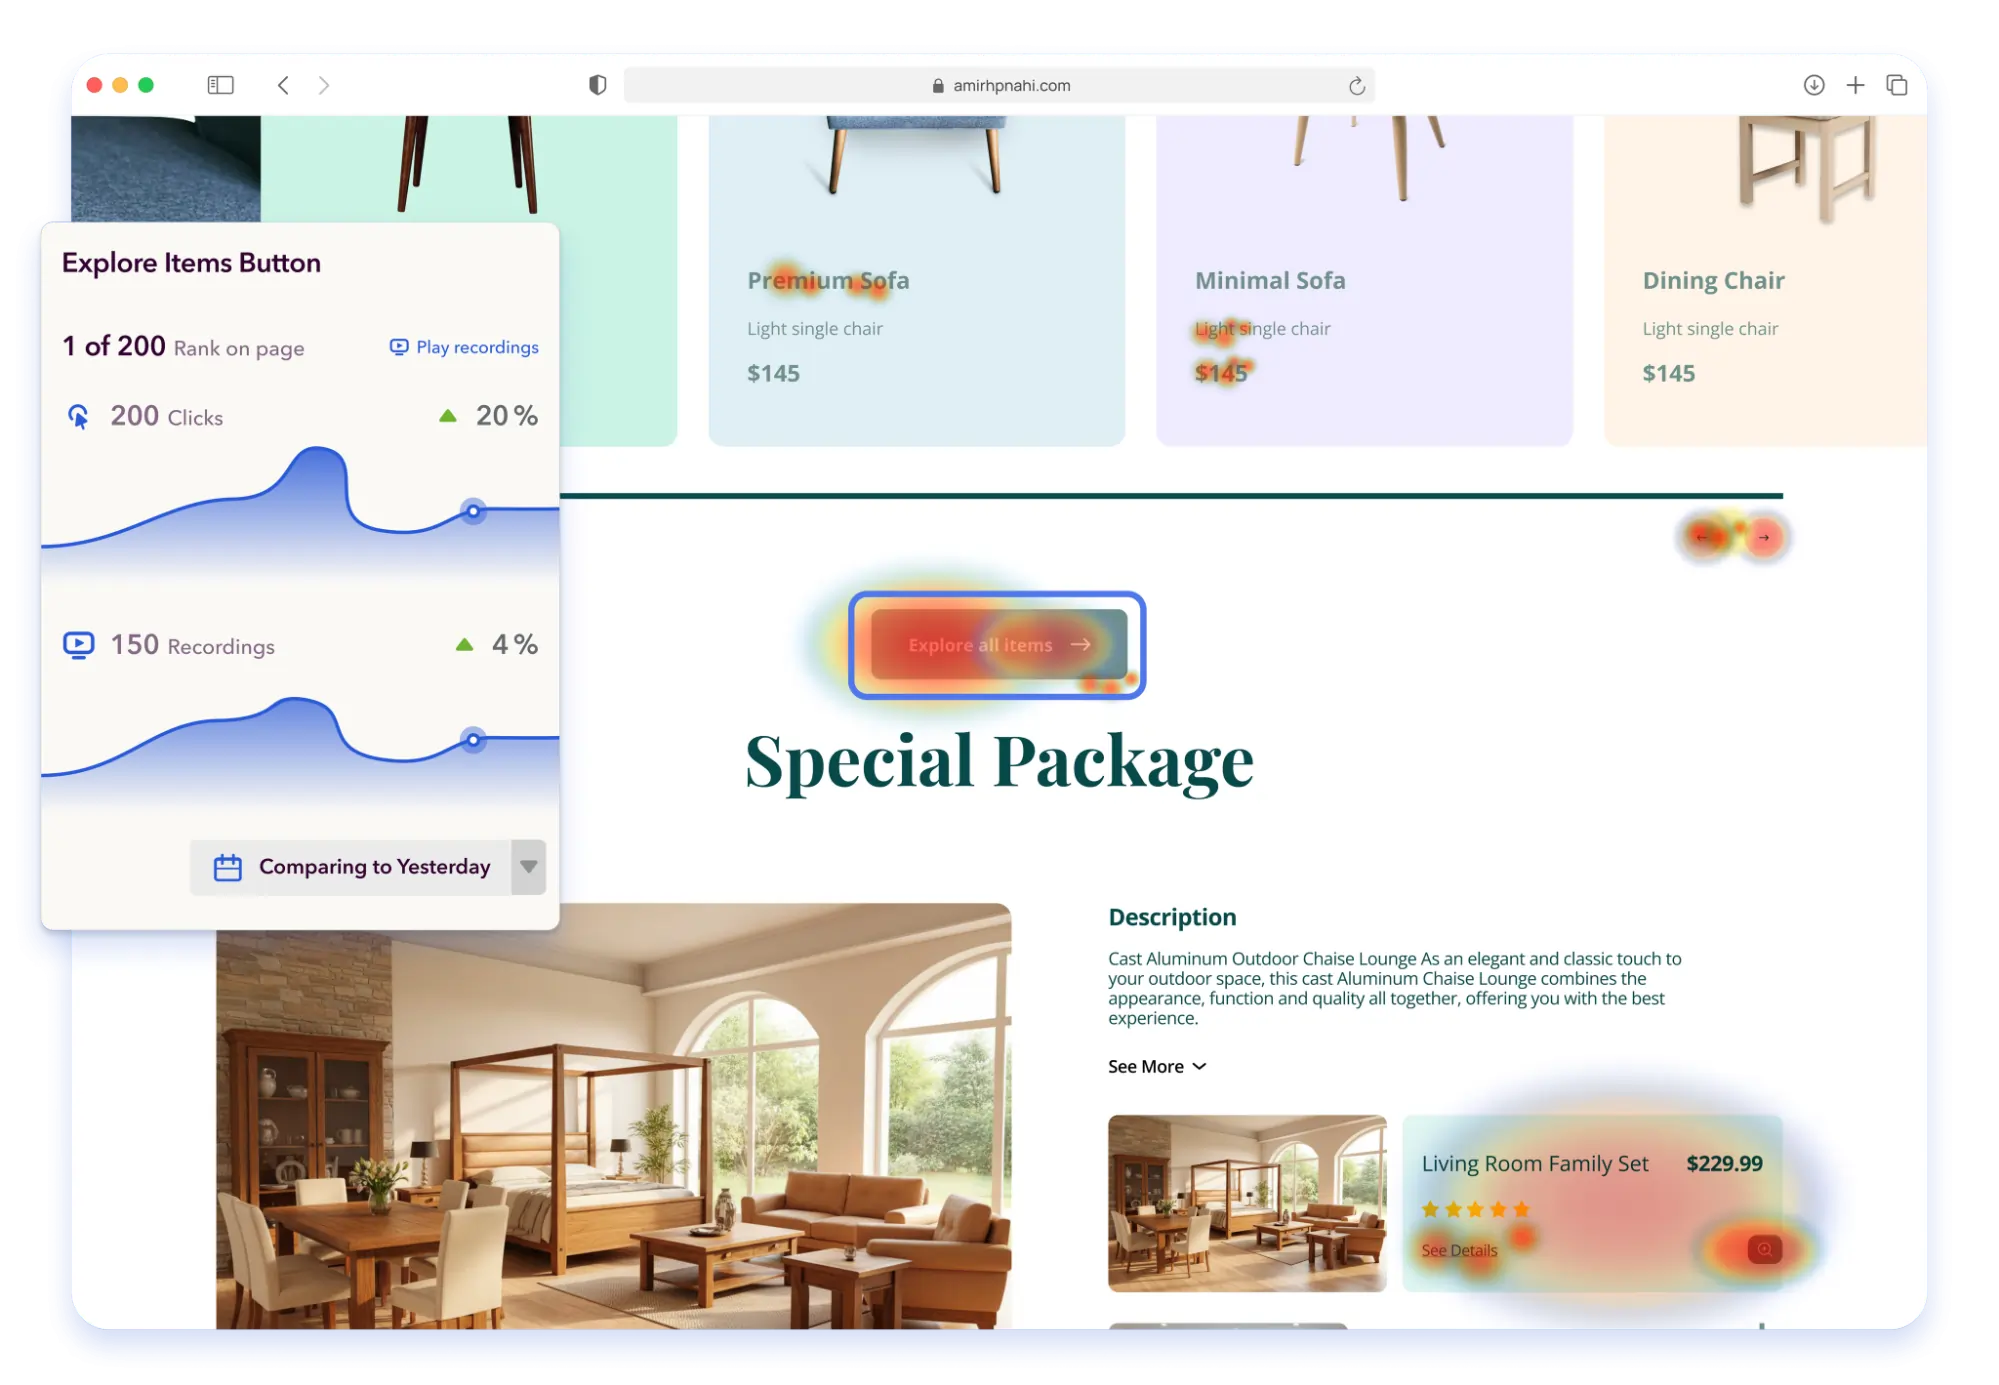
- Observation: Deploying heatmaps and session recordings to observe user struggle on those specific pages.
- Hypothesis: Formulating a theory on why users are struggling (e.g., "The CTA is too far down the page").
- Testing: Running an A/B test to validate the hypothesis.
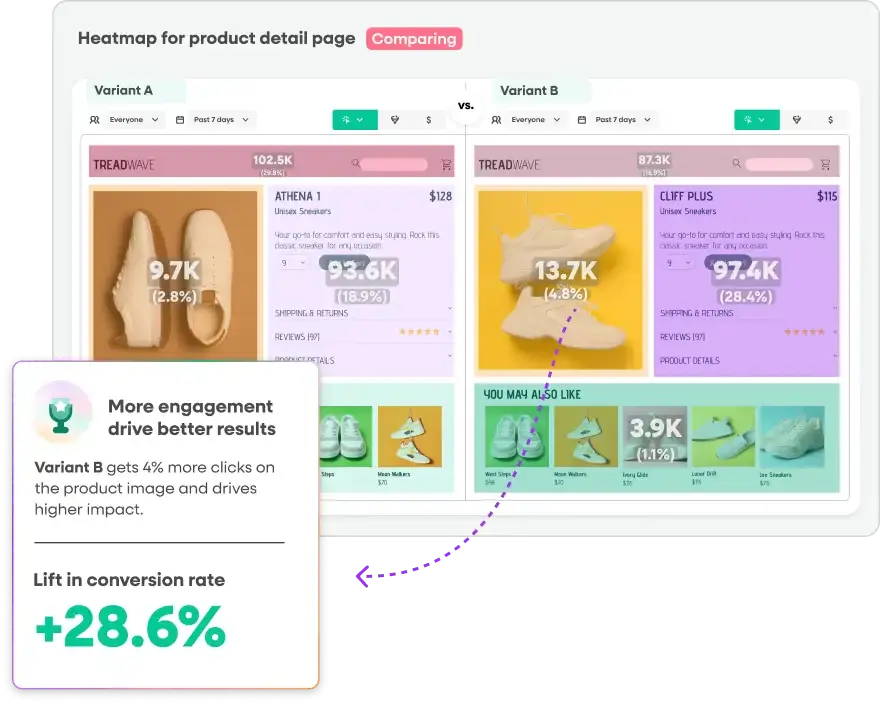
- Analysis: Using post-test heatmaps to see if the new design successfully changed user behavior in the intended way.
The implications of this data-driven approach extend beyond marketing. Product teams use heatmap data to prioritize feature development, while customer support teams use session replays to understand and reproduce reported bugs. This cross-functional utility has transformed heatmap tools from "nice-to-have" marketing gadgets into essential components of the modern corporate tech stack.
Conclusion and Future Outlook
As we move through 2025, the consolidation of the behavioral analytics market suggests that the most successful tools will be those that offer the most "context" rather than just the most "data." The integration of AI-powered summaries, revenue attribution, and native experimentation capabilities is setting a new standard for what businesses expect from their analytics software. Whether through the enterprise-level depth of Contentsquare or the accessibility of Microsoft Clarity, the ability to visualize the user experience has become the definitive competitive advantage in the digital economy. Organizations that fail to look beneath the surface of their traffic data risk losing ground to more observant, agile competitors who treat every click as a valuable insight.







