The global mobile application market has reached a point of saturation where traditional performance metrics are no longer sufficient to guarantee commercial success. While nearly every mobile app professional today utilizes some form of analytics to track performance, a fundamental flaw persists in standard industry workflows: an over-reliance on quantitative data. Quantitative analytics—the numerical tracking of user actions—serves as a vital component of app optimization by identifying trends in user retention, session frequency, and funnel abandonment. However, these metrics represent only the "what" of user behavior, leaving a significant void regarding the "why." To bridge this gap, industry leaders are increasingly turning toward qualitative analytics, a methodology that provides a visual and narrative context to raw data, allowing for a more nuanced understanding of the user experience (UX).
The Quantitative Limitation and the Need for Context
In the current digital landscape, quantitative analytics tools provide a high-level overview of an app’s health. They can alert a developer if 40% of users drop off at the registration screen or if the daily active user (DAU) count has plummeted following a recent update. While this "alarm system" is essential, it lacks the diagnostic power to pinpoint the specific cause of friction. Without qualitative context, product teams are often forced to engage in expensive and time-consuming trial-and-error processes to guess why users are dissatisfied.
The integration of qualitative analytics into the standard development lifecycle transforms this reactive approach into a precise, data-fueled strategy. By utilizing tools such as touch heatmaps and user session recordings, professionals can gain an unbiased, unaltered view of the user journey. This holistic perspective is becoming the industry standard for those looking to deliver a "mobile powerhouse" product that prioritizes user satisfaction alongside technical performance.
Visualizing Interaction: The Role of Touch Heatmaps
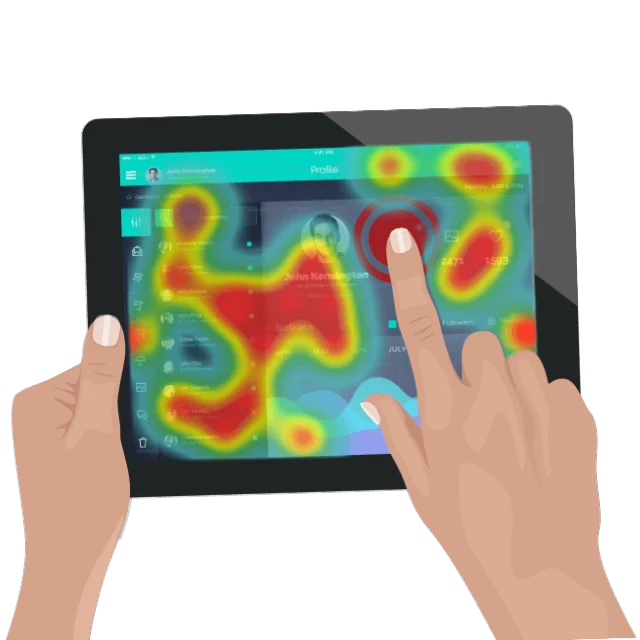
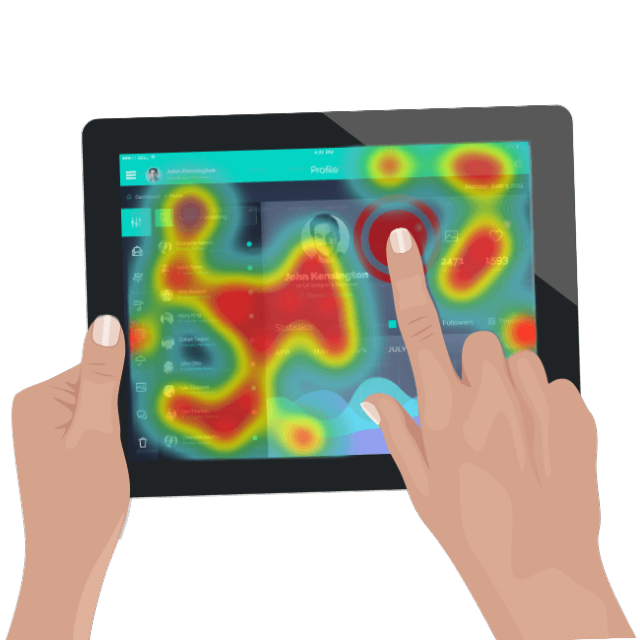
One of the primary pillars of qualitative analytics is the touch heatmap. This tool aggregates every gesture performed by users—including taps, double-taps, and swipes—across every screen within the application. This data is then translated into a visual color-coded overlay, where "hot" zones indicate high interaction and "cold" zones indicate neglected areas.
The strategic value of heatmaps extends beyond merely seeing where users click. Their most critical function is the identification of "unresponsive gestures." These occur when a user interacts with an element—such as an image they believe is a button or a text field they expect to be interactive—and the application does not respond. These instances are more than just minor inconveniences; they are significant indicators of design flaws or technical bugs that severely degrade the user experience. By analyzing these gestures, developers can align the app’s interface with actual user intuition, ensuring that the navigation is as seamless and predictable as possible.
Narrative Insight: User Session Recordings
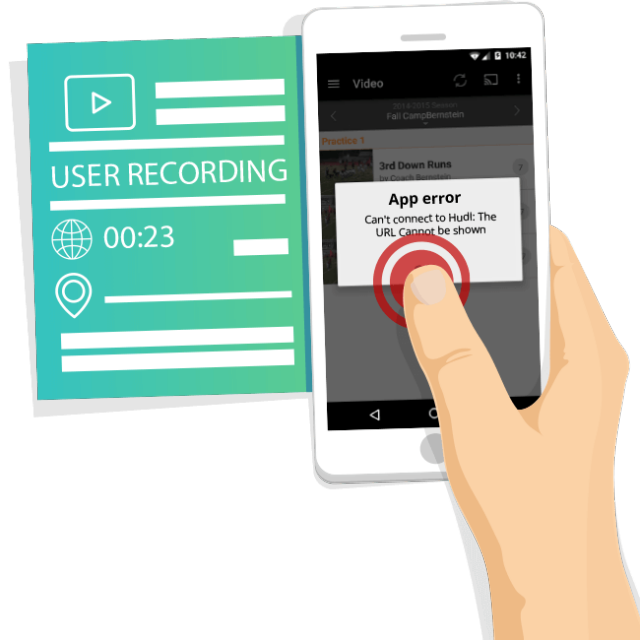
If heatmaps provide a bird’s-eye view of interaction, user session recordings provide a first-person perspective. This technology records the exact sequence of events a user experiences during their time in the app, capturing every screen transition and interaction in real-time. Unlike traditional focus groups or usability labs, which can be influenced by the "observer effect," session recordings offer a raw look at how the app performs "in the wild."
Through these recordings, app professionals can investigate specific anomalies. For instance, if quantitative data shows a spike in crashes on a specific device model, a session recording can reveal the exact sequence of actions that triggered the failure. Furthermore, these recordings are invaluable for understanding abandonment. By watching a user struggle with a complex form or a confusing checkout process, a product manager can identify the exact moment of frustration that led the user to quit. Modern qualitative tools are designed to work background-processes efficiently, ensuring that data collection does not impact the app’s performance or battery consumption.
The Hybrid Workflow: Data-Fueled Optimization
The most effective mobile strategies employ a "lather, rinse, repeat" cycle of data-fueled optimization that combines both analytical branches. This workflow typically follows a three-step progression: alert, investigate, and resolve.
- Alert (Quantitative): The process begins with quantitative tools identifying a trend. For example, an e-commerce app might notice that 30% of users abandon their shopping carts at the final payment screen.
- Investigate (Qualitative): Instead of guessing the cause, the team reviews session recordings of those specific abandoned carts. They may discover that a mandatory registration field is malfunctioning or that a specific "Promo Code" box is confusing users into thinking they cannot proceed without a discount.
- Resolve: Armed with visual evidence, the development team can implement a targeted fix. In this scenario, they might shorten the registration process or move the promo code field to a less prominent position.
This synergy removes the "blind stab" approach from the optimization process. Industry data suggests that companies utilizing this hybrid model can reduce their development cycles and see a more significant return on investment (ROI) by focusing resources on fixes that are guaranteed to improve the user experience.
Proactive Troubleshooting and Technical Stability
Beyond optimization, qualitative analytics enables a shift from reactive to proactive troubleshooting. In a purely quantitative environment, a developer often needs a large sample size of data before a problem becomes statistically significant. By the time a "crash rate" metric spikes high enough to trigger an alarm, thousands of users may have already been affected, potentially leading to negative App Store reviews and permanent churn.
Proactive troubleshooting allows teams to spot usability issues long before they escalate. By regularly auditing session recordings and heatmaps, QA teams can identify minor bugs—such as a login button that requires multiple taps or a social media API that occasionally hangs—before they become widespread failures. For example, if a developer notices that users attempting to log in via a third-party service like Twitter are experiencing lag, they can address the integration issue before it results in a total system crash. This vigilance protects the brand’s reputation and ensures high user retention rates in a market where competitors are only a tap away.
Market Context and Industry Implications
The shift toward qualitative analytics reflects a broader trend in the global software industry toward "User-Centric Design." According to market research, the mobile app analytics market is expected to grow significantly over the next five years, with a heavy emphasis on behavioral and diagnostic tools. As user acquisition costs (CAC) continue to rise, the economic focus has shifted from merely gaining new users to retaining existing ones through superior experience.
Industry analysts suggest that the "Experience Economy" now dictates the success of mobile products. Users no longer compare an app only to its direct competitors; they compare it to the best experiences they have across all digital platforms. If a banking app is not as intuitive as a top-tier social media app, the user perceives it as a failure. Qualitative analytics provides the necessary toolkit to meet these escalating expectations.
Conclusion: The Future of Mobile Strategy
The integration of qualitative analytics represents the "fresh twist" on traditional data science that the mobile industry has long required. By moving beyond the "what" and into the "why," app professionals can make crucial product decisions with a level of confidence that raw numbers alone cannot provide.
The combination of quantitative alerts and qualitative investigations creates a robust framework for building high-performance applications. It allows for a deeper understanding of human behavior, turning clinical data into actionable insights. As the mobile ecosystem continues to evolve, the ability to empathize with the user through visual data will likely become the most significant differentiator between an app that survives and one that thrives as a market leader. Through diligent optimization and proactive troubleshooting, the path to creating a mobile powerhouse is now clearer than ever before.