Understanding the nuanced landscape of social media performance is no longer a luxury but a strategic imperative for brands seeking to thrive in the digital age. In a comprehensive analysis, recent social media benchmarks highlight the typical performance metrics across various industries, offering invaluable context for evaluating engagement, growth, and content effectiveness. These industry standards serve as a vital compass, guiding brands to understand whether their current social media efforts are truly resonating with their target audiences or if there’s significant room for improvement.
A social media benchmark is essentially an industry-specific yardstick that allows organizations to measure their digital performance against similar brands. It provides a definitive answer to questions like, "Is 100 likes on a post considered good?" by illustrating what ‘good’ looks like for critical metrics such as engagement rates, organic reach, and follower growth. Without these benchmarks, businesses risk operating in a vacuum, making it challenging to accurately interpret their social media Key Performance Indicators (KPIs) and subsequent Return on Investment (ROI).
The significance of social media benchmarks extends beyond mere reporting. They are foundational for setting realistic and achievable social media goals. Different sectors exhibit distinct performance patterns; for instance, entertainment brands typically enjoy higher engagement rates compared to healthcare organizations, a disparity that underscores the necessity of industry-specific context. By aligning goals with industry norms, brands can set targets that are ambitious yet grounded in reality, preventing potential burnout for social media teams and ensuring marketing efforts are strategically focused.
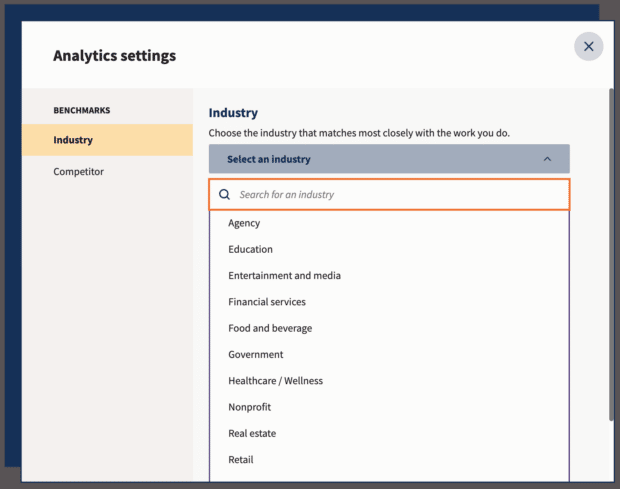
Navigating the complexities of social media data to derive reliable benchmarks can be an arduous and time-consuming task. Recognizing this challenge, platforms like Hootsuite have integrated sophisticated social media benchmarking tools within their analytics suites. Hootsuite Analytics, for example, empowers users to compare their social performance against industry averages with just a few clicks. This streamlined process involves navigating to the ‘Analytics’ section, selecting ‘Benchmarking,’ choosing the relevant industry category, and instantly accessing comparative data.
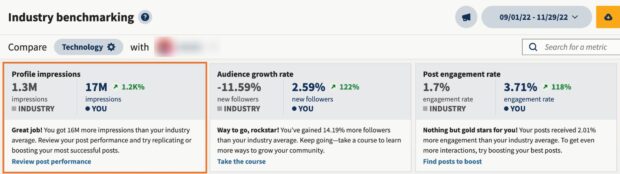
The Hootsuite tool provides detailed insights across major social media platforms, including Instagram, Facebook, X (formerly Twitter), LinkedIn, and TikTok. Users can customize timeframes and delve into crucial metrics such as engagement rate, reach, follower growth, clicks, shares, and video views. Beyond presenting raw data, Hootsuite further enriches the user experience by offering actionable recommendations tailored to improve performance based on the benchmark analysis. These reports can be easily exported as PDFs, facilitating seamless sharing of insights with stakeholders and ensuring data-driven decisions are communicated effectively across the organization.
Industry-Specific Insights: A Deep Dive into Performance
The recent benchmarks reveal compelling trends across diverse sectors, offering a roadmap for optimizing social media strategies.
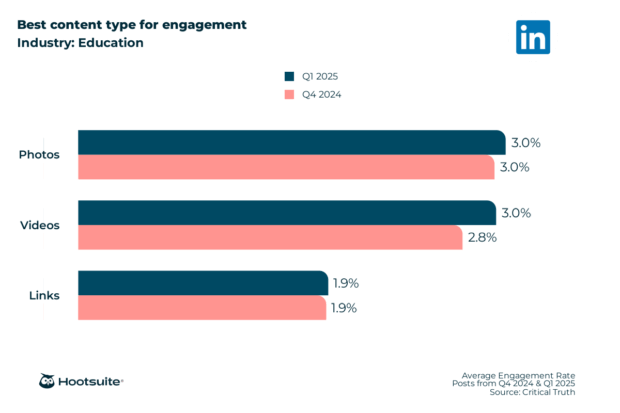
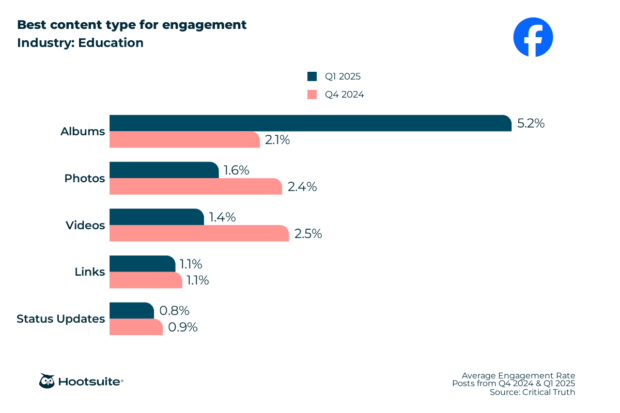
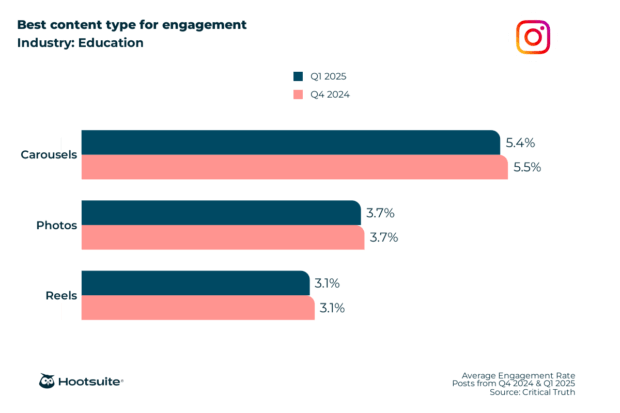
Education Sector:
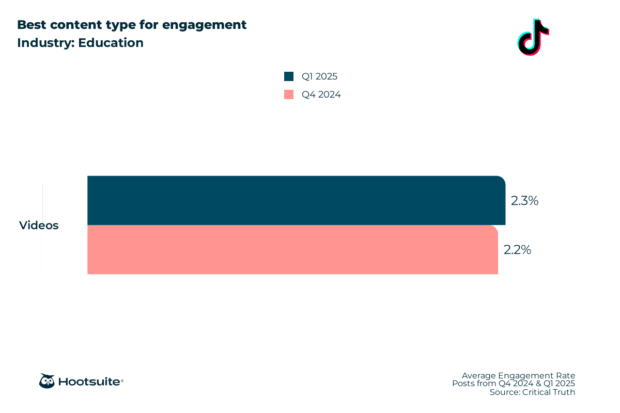
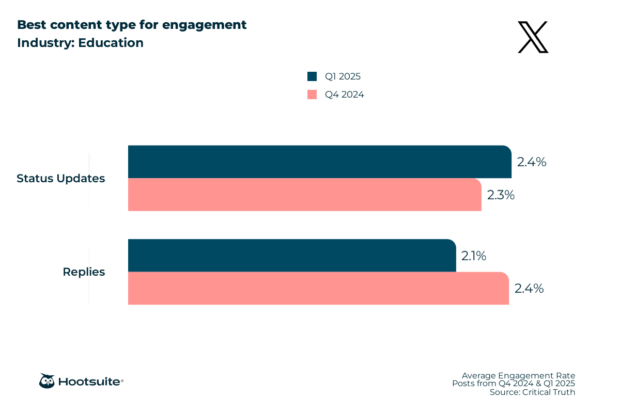
In the realm of education, content strategy varies significantly by platform. On Facebook, photo albums emerge as the top-performing content type, securing a robust 5.2% engagement rate. This suggests that multi-image posts showcasing campus life, events, or academic achievements resonate strongly. Instagram, a visually-driven platform, sees carousels leading with a 5.4% engagement rate, highlighting the effectiveness of interactive, swipeable content for educational institutions. LinkedIn, the professional networking hub, shows an equal preference for photos and videos, both achieving a 3.0% engagement rate, underscoring the importance of visual storytelling for professional development and institutional branding. On TikTok, short-form videos predictably dominate, garnering a 2.3% engagement rate, aligning with the platform’s video-centric nature. X (Twitter) users in education favor concise status updates, which yield a 2.4% engagement rate.
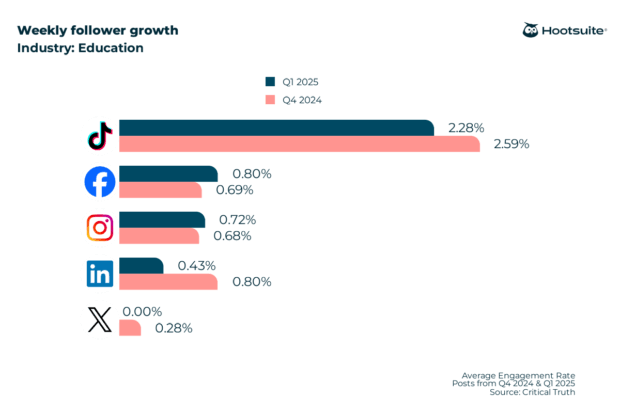
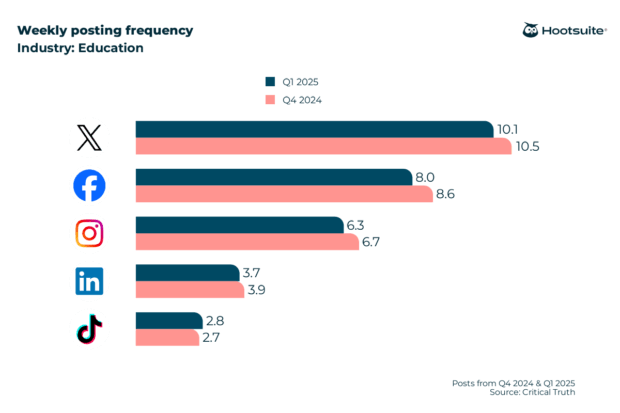
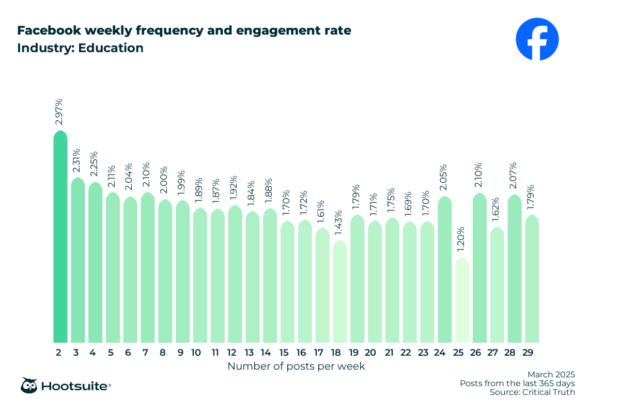
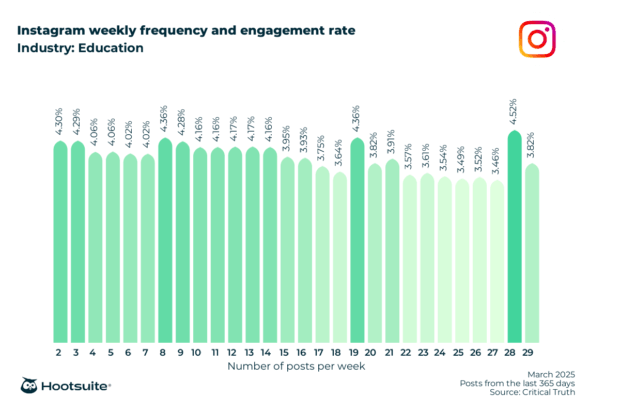
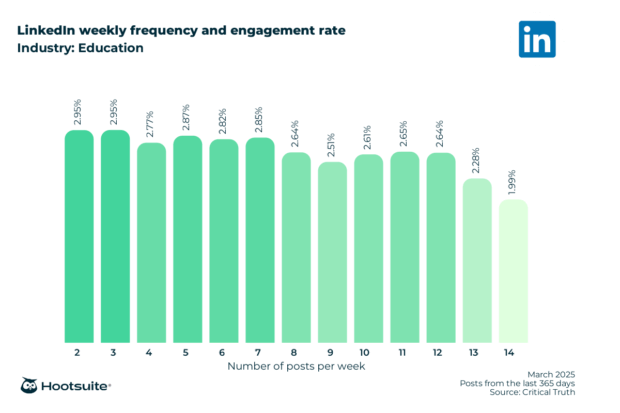
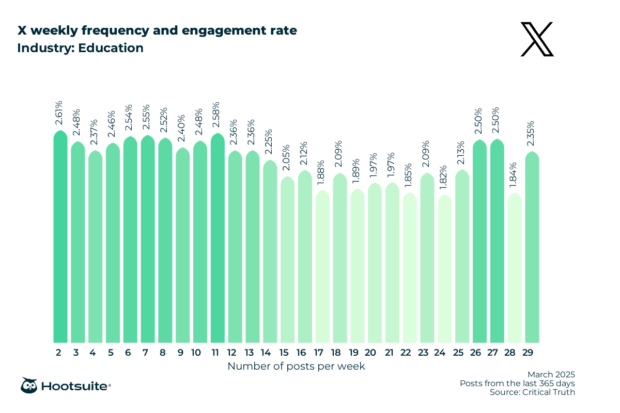
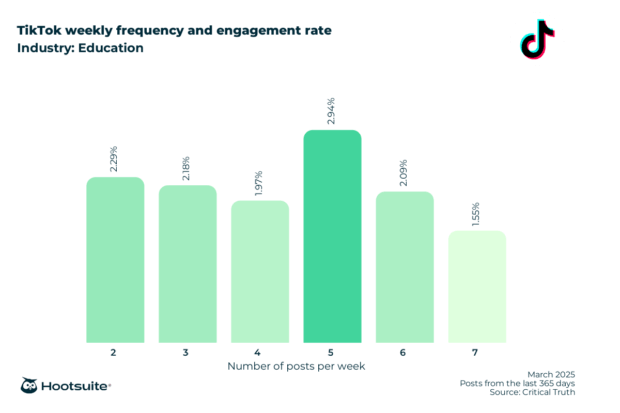
Regarding follower growth, TikTok demonstrates exceptional potential for educational institutions, boasting an average weekly follower growth of 2.28%. This signals TikTok’s increasing importance as a channel for reaching younger audiences and promoting educational content. While X (Twitter) sees a high average posting frequency of 10.1 times per week in this sector, optimal engagement rates are achieved with more focused posting schedules: Facebook posts twice weekly for 2.97% engagement, Instagram posts 28 times weekly for 4.52%, LinkedIn 2-3 times weekly for 2.95%, X (Twitter) twice weekly for 2.61%, and TikTok five times weekly for 2.94%.
Entertainment and Media:
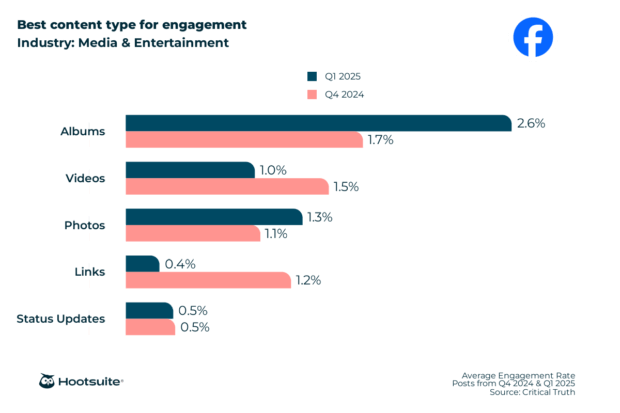
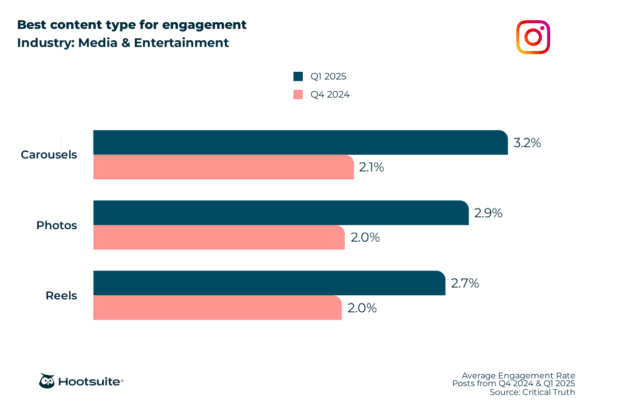
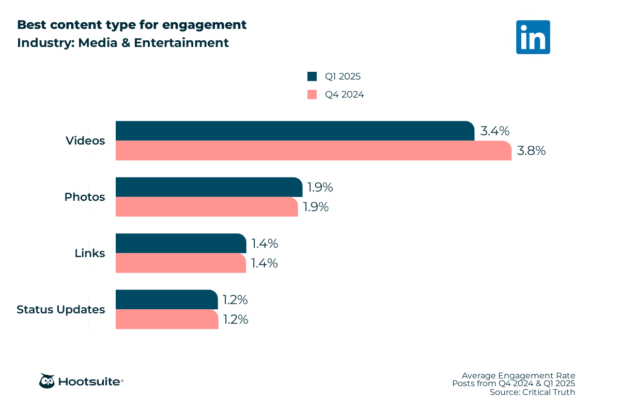
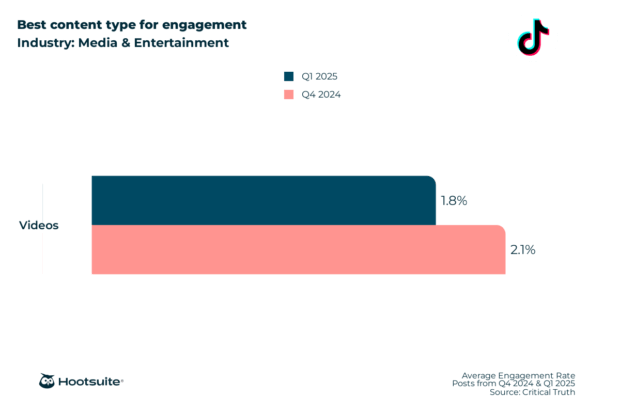
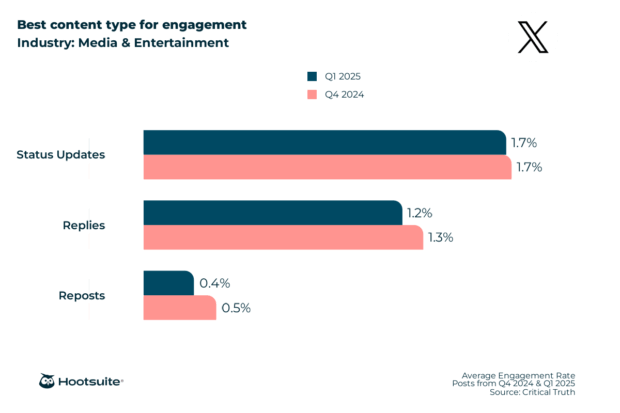
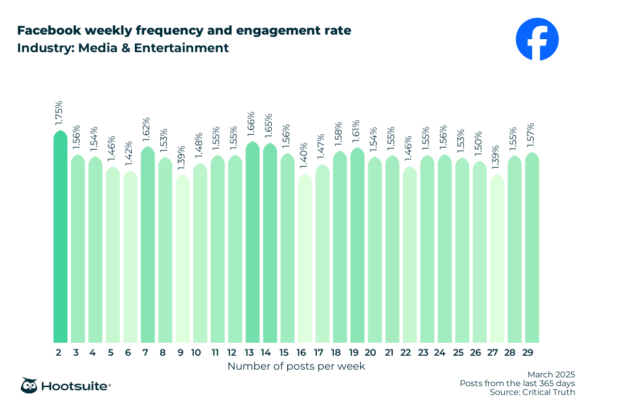
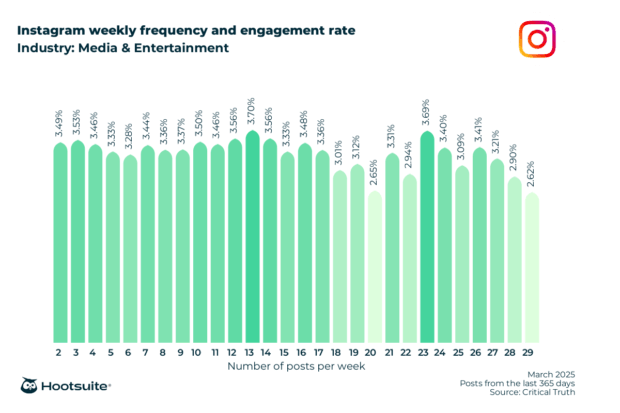
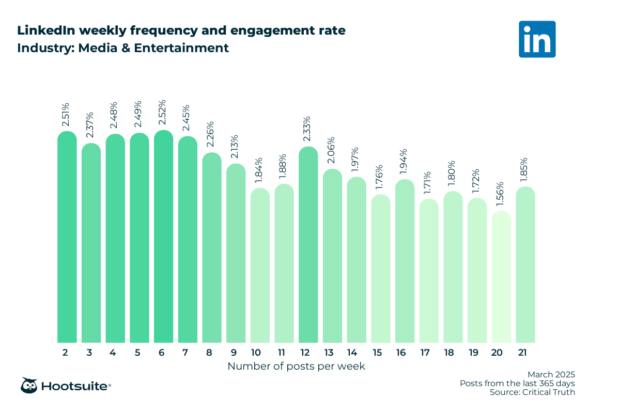
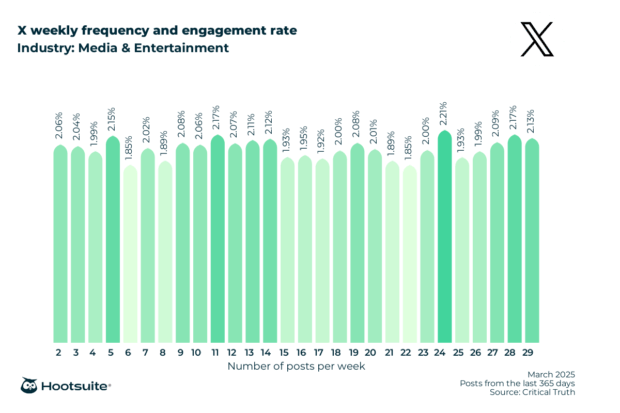
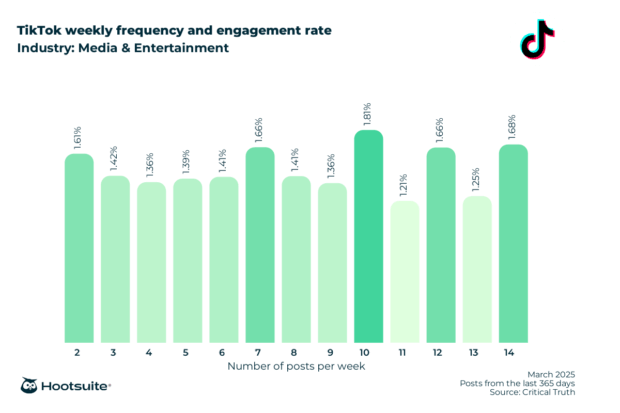
The entertainment and media industry, inherently visual and dynamic, also presents distinct patterns. Facebook albums perform best at 2.6% engagement, likely due to their ability to showcase event photos or behind-the-scenes glimpses. Instagram carousels lead with 3.2% engagement, with Reels following closely at 2.7%, indicating a preference for rich, interactive visual narratives. Videos are the undisputed champion on LinkedIn (3.4% engagement) and TikTok (1.8% engagement), reflecting the industry’s focus on dynamic content. X (Twitter) status updates yield the highest engagement at 1.7%.
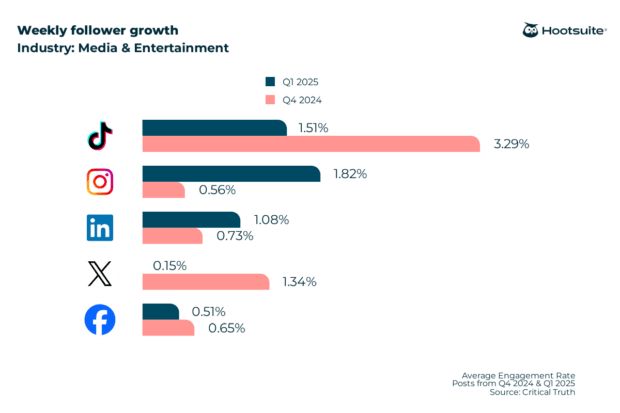
Instagram is a powerhouse for follower growth in this sector, achieving an average weekly growth rate of 1.82%, emphasizing its role in audience expansion. Facebook sees the highest posting frequency at 10.8 times weekly. For optimal engagement, two Facebook posts per week yield 1.75%, 13 Instagram posts achieve 3.70%, two LinkedIn posts secure 2.51%, 24 X (Twitter) posts reach 2.21%, and 10 TikTok posts result in 1.81%.
Financial Services:
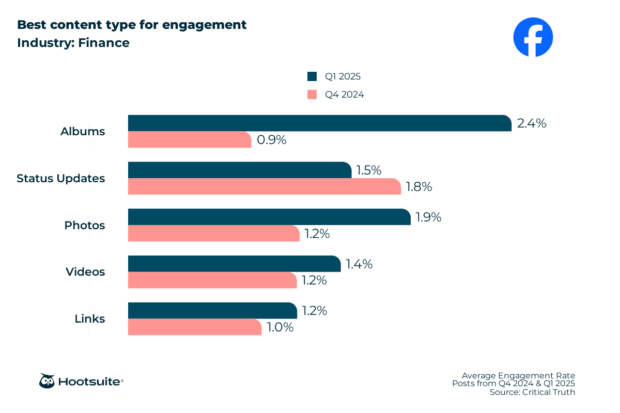
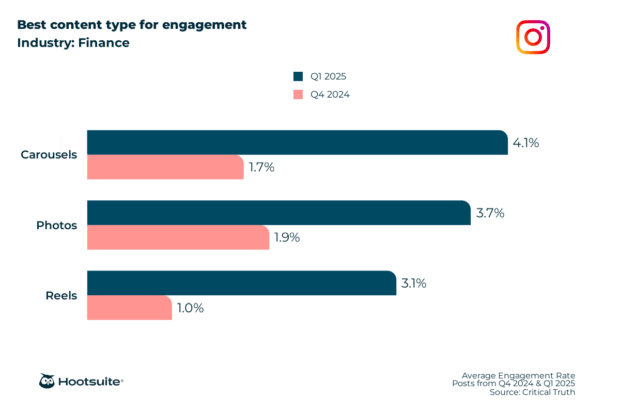
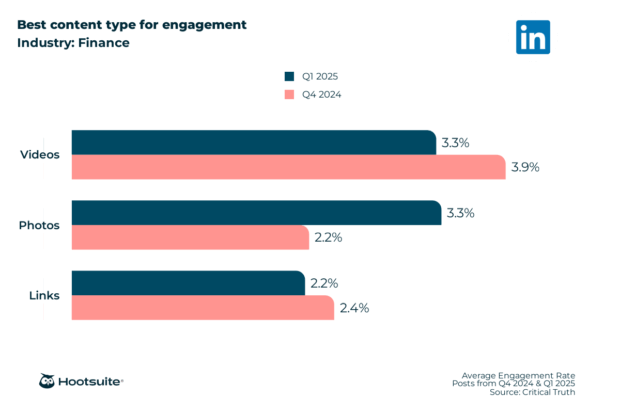
In the often-conservative financial services industry, albums on Facebook lead with 2.4% engagement, suggesting that organized visual content like event recaps or team spotlights is effective. Instagram carousels stand out with 4.1% engagement, indicating that digestible, multi-slide explanations of financial concepts or services are well-received. On LinkedIn, both photos and videos perform equally well at 3.3% engagement, highlighting the dual importance of professional imagery and informative video content.
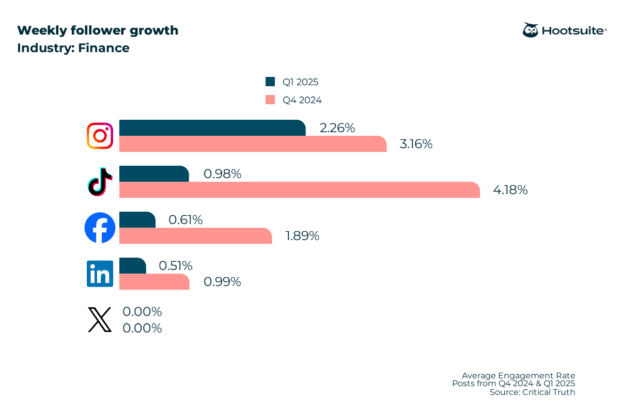
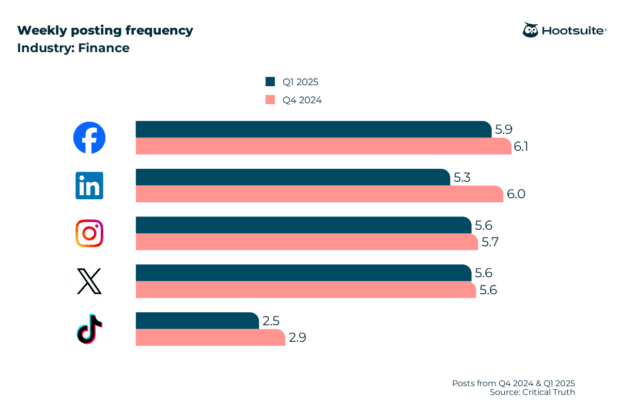
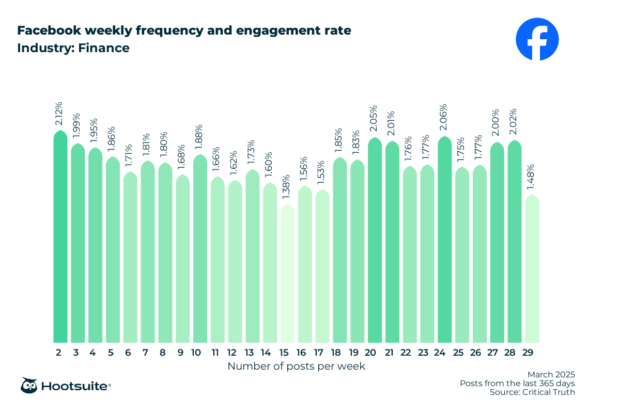
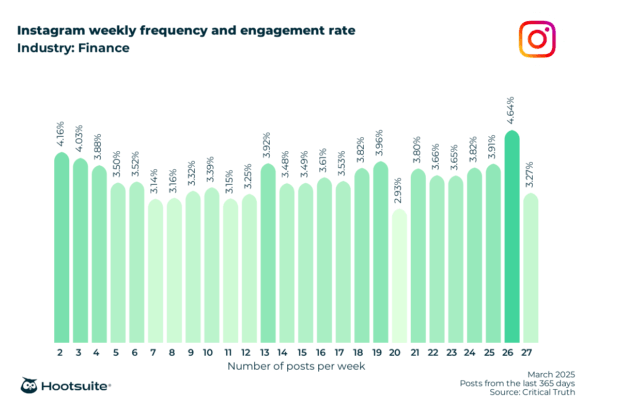
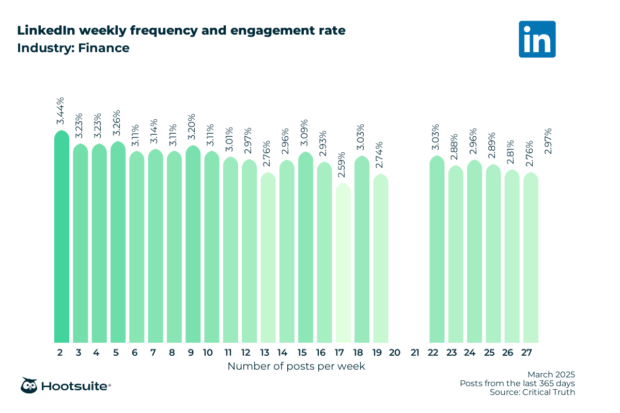
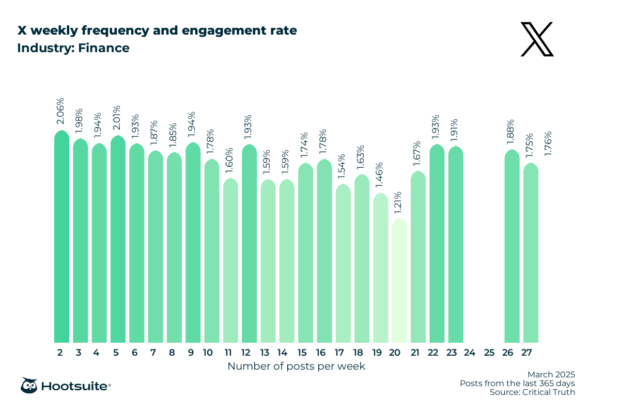
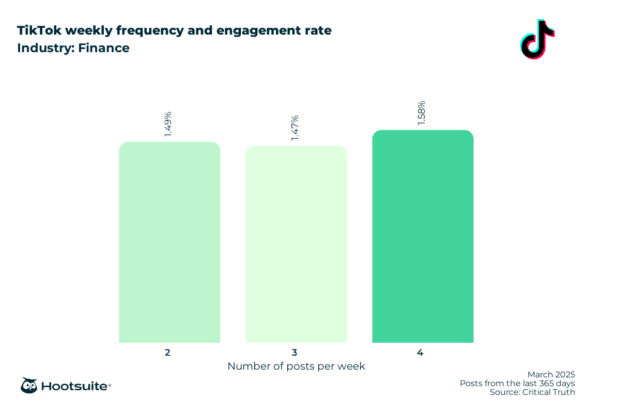
Instagram also dominates follower growth in financial services with a weekly rate of 2.26%, showcasing its potential for building brand awareness and trust. Facebook is the most frequently used platform, with 5.9 posts per week. Optimal engagement rates are achieved with two Facebook posts per week (2.12%), 26 Instagram posts (4.64%), two LinkedIn posts (3.44%), two X (Twitter) posts (2.06%), and four TikTok posts (1.58%).
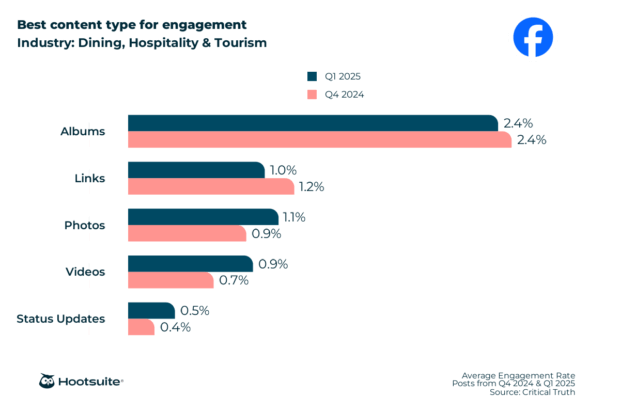
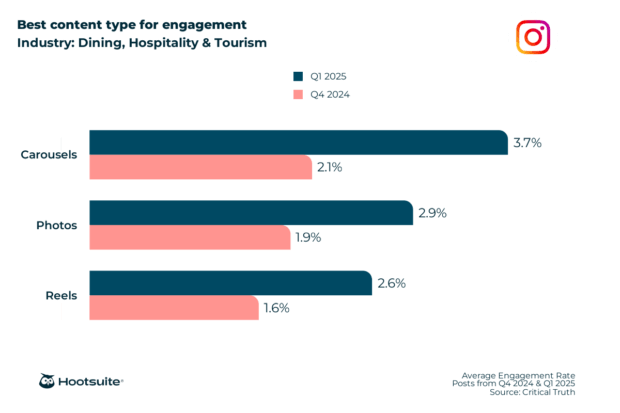
Dining, Hospitality, and Tourism:
This sector thrives on visual appeal and aspirational content. Facebook albums perform best at 2.4% engagement, likely due to showcasing experiences, venues, or culinary delights. Instagram carousels are top-performers with 3.7% engagement, perfect for presenting travel destinations or multi-course meals. Videos are paramount on LinkedIn (4.5% engagement) and TikTok (1.3% engagement), reflecting the immersive nature of travel and dining experiences. On X (Twitter), both replies and status updates achieve 2.0% engagement, emphasizing conversational interaction.
TikTok is the runaway leader for follower growth in this industry, boasting an astonishing 18.75% weekly growth rate, cementing its status as a critical platform for viral content and broad reach. Both Facebook (9.9 posts/week) and Instagram (11.9 posts/week) are heavily utilized. Optimal engagement is seen with 17 Facebook posts per week (1.58%), two Instagram posts (3.52%), 8-10 X (Twitter) posts (2.14%), and two TikTok posts (1.36%).
Government-Related Services:
For government entities, transparency and information dissemination are key. Facebook albums yield the highest engagement at 3.6%, suitable for public awareness campaigns or community event photos. Instagram carousels achieve 5.0% engagement, suggesting that multi-slide information graphics or public service announcements are highly effective. LinkedIn photos lead with 2.8% engagement, underscoring the importance of official imagery. On TikTok, videos are most engaging at 1.6%, allowing for concise public information. X (Twitter) status updates perform best at 1.8% engagement.
Instagram shows the highest weekly follower growth rate at 2.17%, indicating its growing importance for public outreach. Facebook is the most active platform, with an average of 16.1 posts per week. Optimal engagement rates are achieved with two Facebook posts per week (2.32%), three LinkedIn posts (2.80%), and two X (Twitter) posts (2.03%).
Healthcare Industry:
The healthcare sector often faces the challenge of conveying complex information in an accessible manner. Facebook albums perform best at 3.8% engagement, perhaps for showcasing facilities, staff, or community health initiatives. Instagram carousels lead with 4.5% engagement, ideal for breaking down health tips or explaining procedures visually. LinkedIn photos achieve 3.4% engagement, emphasizing professional credibility. Videos are most engaging on TikTok at 1.0%. X (Twitter) status updates lead with 2.3% engagement, crucial for rapid information dissemination.
Facebook surprisingly has the highest weekly follower growth rate at 10.11% in healthcare, demonstrating its continued relevance for community engagement and patient communication. Facebook is also the most frequently used platform, with 11.4 posts per week. Optimal engagement is achieved with two Facebook posts per week (2.22%), two Instagram posts (3.89%), 20 LinkedIn posts (3.61%), 28 X (Twitter) posts (2.65%), and seven TikTok posts (1.03%).
Real Estate, Legal, and Other Professional Services:
For professional services, building trust and showcasing expertise are paramount. Facebook albums garner 2.9% engagement, likely used for property tours or event highlights. Instagram carousels perform best at 4.1%, effective for showcasing multiple property angles or legal case studies. LinkedIn videos lead with 4.0% engagement, ideal for thought leadership and client testimonials.
TikTok registers the highest weekly follower growth at 1.62%, indicating its emerging potential for these sectors. Facebook is the most active platform with 11.6 posts per week, followed by X (Twitter) at 10.2 posts per week. Optimal engagement rates are achieved with two Facebook posts per week (2.09%), two Instagram posts (4.23%), two LinkedIn posts (3.36%), three X (Twitter) posts (1.88%), and three TikTok posts (0.95%).
Retail Industry:
The retail sector thrives on visual merchandising and product promotion. Facebook albums achieve 1.9% engagement, useful for product collections or event photos. Instagram carousels are top-performers at 3.6%, perfect for showcasing product variations or lifestyle content. LinkedIn videos lead with 4.3% engagement, potentially for corporate updates or supply chain transparency. TikTok videos are most engaging at 1.6%, ideal for product demonstrations or trends. X (Twitter) status updates perform best at 1.7%.
Facebook leads in weekly follower growth at 2.43%, maintaining its importance for direct consumer interaction. Retail brands post most frequently on Facebook, averaging 9.0 times per week. For optimal engagement, 18 Facebook posts per week yield 1.54%, 25 Instagram posts achieve 3.66%, 15 LinkedIn posts secure 4.15%, eight X (Twitter) posts reach 1.88%, and 4-5 TikTok posts result in 1.74%.
Construction, Mining, and Manufacturing:
These industrial sectors often focus on B2B communication and showcasing large-scale projects. Facebook albums lead with 2.8% engagement, effective for project progress or site photos. Instagram carousels are top-performers at 5.2%, ideal for step-by-step project showcases. On LinkedIn, both videos and photos perform equally well at 4.0% engagement, underscoring the importance of visual updates for professional audiences. TikTok videos are most engaging at 2.6%. X (Twitter) status updates achieve 2.4% engagement.
Both TikTok and Instagram show the highest weekly follower growth rates at 1.71%, highlighting their increasing relevance for employer branding and showcasing operations. Facebook is the most active platform, averaging 7.9 posts per week. Optimal engagement rates are achieved with two Facebook posts per week (2.31%), 28 Instagram posts (5.02%), 2 or 20 LinkedIn posts (4.13%), two X (Twitter) posts (2.58%), and three TikTok posts (2.60%).
Marketing Agencies:
For marketing agencies, demonstrating expertise and creative output is crucial. Facebook albums achieve 2.2% engagement, potentially for campaign recaps or team events. Instagram carousels lead with 3.7% engagement, excellent for showcasing portfolio pieces or client success stories. LinkedIn videos perform best at 4.7% engagement, ideal for thought leadership and industry insights. TikTok videos are most engaging at 0.7%. X (Twitter) status updates perform best at 1.7%.
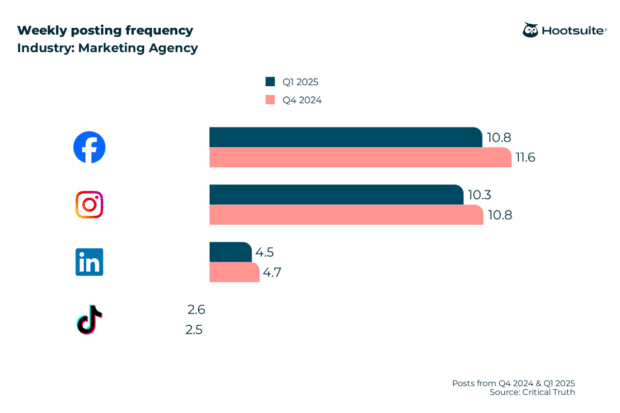
Instagram has the highest weekly follower growth rate, emphasizing its visual appeal for showcasing creative work. Marketing agencies post frequently on both Facebook (10.8 times/week) and Instagram (10.3 times/week). Optimal engagement rates are achieved with two Facebook posts per week (2.08%), two Instagram posts (4.00%), 19 LinkedIn posts (4.02%), nine X (Twitter) posts (2.09%), and six TikTok posts (0.88%).
Nonprofit Industry:
Nonprofits aim to inspire action and build community support. Facebook albums lead with 3.0% engagement, effective for showcasing impact or event photos. Instagram carousels are top-performers at 5.5% engagement, excellent for storytelling and campaign updates. LinkedIn photos perform best at 3.4% engagement, ideal for partner recognition and organizational news. TikTok videos are most engaging at 1.3%. X (Twitter) replies perform best at 2.4% engagement, highlighting direct interaction.
TikTok shows the highest weekly follower growth at 2.15%, indicating its rising importance for reaching new demographics and sharing impactful stories. Nonprofits post most frequently on Facebook, averaging 9.5 times per week. Optimal engagement rates are achieved with two Facebook posts per week (2.36%), 25 Instagram posts (4.95%), two LinkedIn posts (3.58%), 2 or 24 X (Twitter) posts (2.44%), and three TikTok posts (1.67%).
Technology Industry:
The fast-paced technology industry benefits from demonstrating innovation and thought leadership. Facebook albums achieve 1.8% engagement, possibly for event photos or company culture showcases. Instagram carousels lead with 4.2% engagement, excellent for explaining new features or tech concepts. LinkedIn videos perform best at 3.9% engagement, ideal for product demos or executive insights. TikTok videos are most engaging at 0.7%. X (Twitter) replies perform best at 2.5% engagement, highlighting customer service and engagement.
Facebook demonstrates an extraordinary weekly follower growth rate of 199.09% in the technology industry, indicating significant potential for rapid audience expansion. Instagram is the most frequently used platform, with an average of 12.1 posts per week. Optimal engagement rates are achieved with 25 Facebook posts per week (1.67%), 18 Instagram posts (3.57%), two LinkedIn posts (3.72%), 19 X (Twitter) posts (2.59%), and three TikTok posts (0.74%).
Utilities and Energy:
This sector often focuses on public service announcements and community relations. Facebook albums lead with 3.2% engagement, effective for community updates or energy-saving tips. Instagram carousels are top-performers at 5.5% engagement, excellent for explaining complex processes or safety guidelines visually. On LinkedIn, both videos and photos perform equally well at 3.4% engagement, ideal for corporate responsibility and industry news. X (Twitter) status updates perform best at 2.4%.
LinkedIn has the highest weekly follower growth rate at 1.12%, emphasizing its role in professional networking and industry communication. Utilities and energy companies post most frequently on Facebook, averaging 4.8 times per week. Optimal engagement rates are achieved with two Facebook posts per week (2.24%), two Instagram posts (3.95%), 10 LinkedIn posts (3.74%), five TikTok posts (0.85%), and 10 X (Twitter) posts (2.60%).
Overall Industry Trends:
Across all industries, some general patterns emerge. Albums consistently perform best on Facebook (2.9% engagement), while carousels excel on Instagram (4.2%). Videos are generally the most engaging content type on LinkedIn (3.9%) and TikTok (1.5%). On X (Twitter), status updates (1.8%) and replies tend to drive the highest engagement.
In terms of overall follower growth, TikTok stands out with an impressive average weekly growth rate of 197.37%, positioning it as a dominant platform for rapid audience expansion. Facebook also shows strong growth potential in specific sectors like Technology and Healthcare. While X (Twitter) sees the highest overall posting frequency across industries (18.1 times/week), high frequency does not always correlate with the highest engagement. Optimal engagement across platforms often occurs with more moderate posting frequencies, typically 2-3 times per week for Facebook, Instagram, and LinkedIn, with TikTok showing higher optimal frequencies (e.g., 14 posts/week for 1.71% engagement).
Strategic Implications: Leveraging Benchmarks for Success
These comprehensive benchmarks offer more than just data points; they provide a strategic framework for enhancing social media presence.
-
Understanding Current Performance: Benchmarks provide crucial external context for internal performance metrics. A growth rate that seems slow internally might actually be exceeding industry averages, validating current efforts. Conversely, seemingly good engagement might reveal untapped potential when compared to top-performing competitors. This external validation is critical for justifying resource allocation and showcasing the real value of social media marketing to senior stakeholders.
-
Setting Realistic and Ambitious Goals: By understanding what is typical and achievable within their specific industry, brands can set SMART (Specific, Measurable, Achievable, Relevant, Time-bound) goals. This prevents setting targets that are either too conservative or entirely unrealistic, leading to more effective resource management and improved team morale.
-
Replicating Winning Strategies: Identifying industry leaders who consistently outperform benchmarks is a powerful way to refine strategy. Through social listening and competitive analysis, brands can reverse-engineer successful content types, posting frequencies, and engagement tactics. Integrating these proven methods, adapted to one’s own brand voice and audience, can significantly uplift performance.
-
Spotting Early Opportunities and Adapting: Benchmarks are forward-looking indicators. A consistent decline in audience growth on a particular platform across an industry, for example, could signal a need to diversify efforts or explore emerging platforms. While benchmarks provide guidance, they should always be combined with internal testing and experimentation to discover unique strategies that work best for individual brands.
In conclusion, social media benchmarks are indispensable tools for any organization serious about its digital footprint. They provide the necessary context to understand performance, set intelligent goals, learn from industry leaders, and proactively adapt to the evolving social media landscape. By leveraging robust analytics tools like Hootsuite, brands can transform raw data into actionable insights, ultimately driving stronger engagement, sustainable growth, and measurable ROI.