
 Dwi Wanna

The Ubiquitous Rise of Video in Digital Strategy
The past decade has witnessed an unprecedented surge in video content, transforming it from a supplementary element to a dominant force in digital communication. Platforms like YouTube pioneered long-form video, while the explosion of short-form content on TikTok, Instagram Reels, and YouTube Shorts has fundamentally reshaped consumer attention spans and content consumption habits. This evolution has necessitated a more sophisticated approach to measuring video performance. Early metrics often focused on simple view counts, but as the medium matured, marketers realized the need for deeper insights. The shift has been towards understanding not just if a video was seen, but how it was consumed, why it resonated (or didn’t), and what impact it had on business objectives. This background context underscores why social video metrics are no longer optional but a strategic imperative for any brand seeking to thrive in the digital ecosystem.

Beyond Vanity: Aligning Metrics with Business Goals
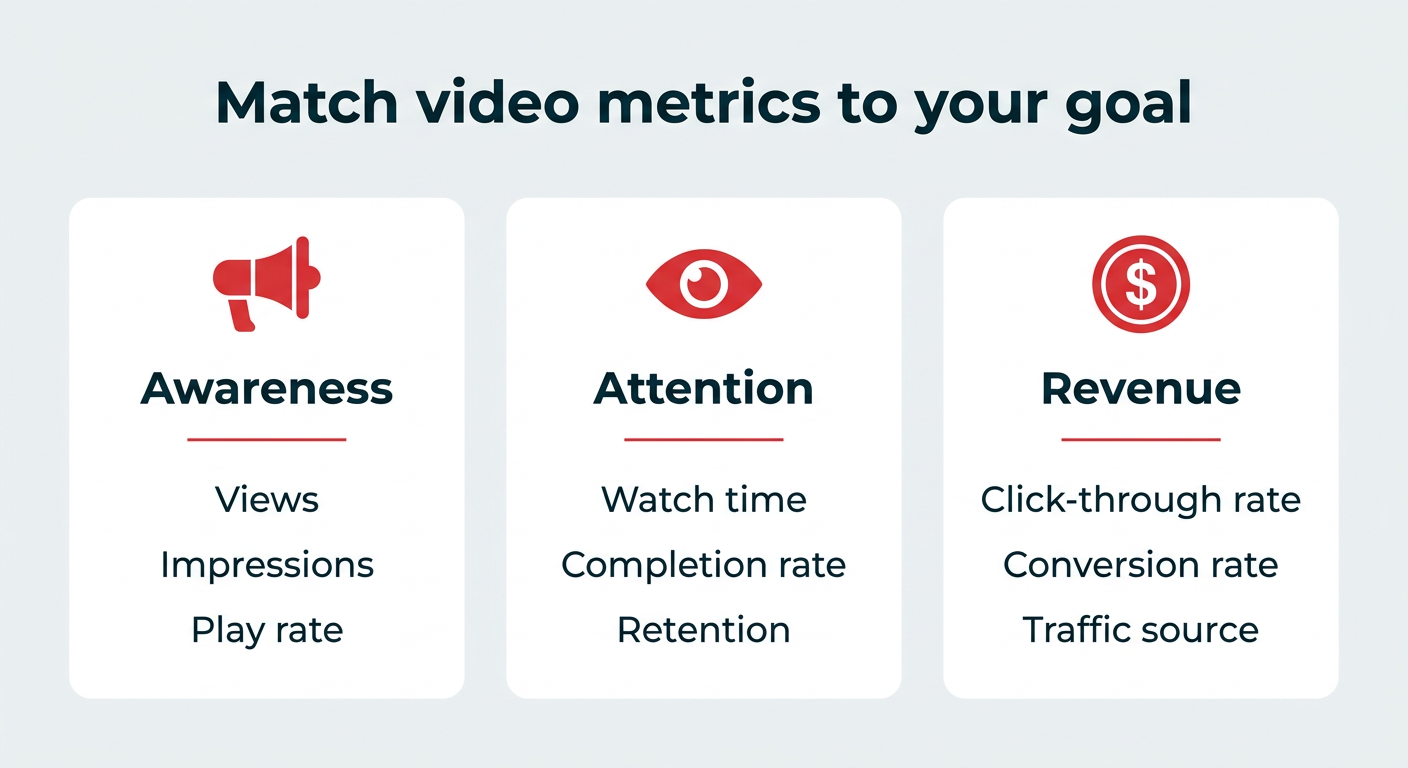
The true power of social video metrics lies in their ability to map directly to specific business objectives. A blanket approach to metrics can be misleading; what constitutes success for a brand awareness campaign is fundamentally different from a direct conversion initiative. Therefore, defining Key Performance Indicators (KPIs) that align with overarching marketing goals is the first critical step.
-
Brand Awareness: For campaigns focused on increasing brand visibility and recognition, metrics like Views, Impressions, Reach, and Play Rate are essential. Views indicate how many times a video was watched, while impressions show how many times it was displayed. Reach identifies the unique number of individuals who saw the video. Play rate, particularly in click-to-play environments, measures the initial appeal and effectiveness of the video’s thumbnail and opening. A high play rate suggests compelling visuals and a strong hook, drawing viewers in.

-
Engagement: When the goal is to foster interaction and build a relationship with the audience, Engagement Rate, Comments, Shares, and Saves become paramount. Engagement rate, encompassing likes, reactions, comments, and shares, reflects how much the content resonated with viewers. Comments provide qualitative feedback, while shares and saves are powerful indicators of content value and advocacy. As Instagram’s Head, Adam Mosseri, has repeatedly emphasized, engagement metrics are critical signals for platform algorithms, indicating content quality and relevance.
-
Audience Retention: To understand how well a video holds viewer attention and maintains interest throughout its duration, Average Watch Time, Video Completion Rate, and Retention Graphs are key. These metrics reveal if the storytelling is effective, identify potential drop-off points, and guide future content pacing and editing decisions. Eileen Kwok, former Social Media Strategist at Hootsuite, notes that average watch time is one of the clearest signals of content quality and audience interest.
-
Conversion and ROI: For objectives centered on driving specific actions that contribute to the bottom line, Conversion Rate, Click-Through Rate (CTR), and Traffic Source are indispensable. Conversion rate measures the percentage of viewers who completed a desired action (e.g., signing up, downloading, purchasing). CTR specifically tracks clicks on links or calls-to-action (CTAs). Traffic source data reveals where converting viewers originated, informing distribution strategies.
-
Community Building: To cultivate a loyal and active community, metrics such as Comments, Replies, Saves, and Shares are crucial. These interactions signify that the content is sparking conversations, being valued for future reference, and being disseminated within social circles, strengthening the brand’s presence within its niche.
Crucial Social Video Metrics for In-Depth Analysis
A deeper dive into the most vital social video metrics reveals their nuances and strategic implications across various platforms.
-
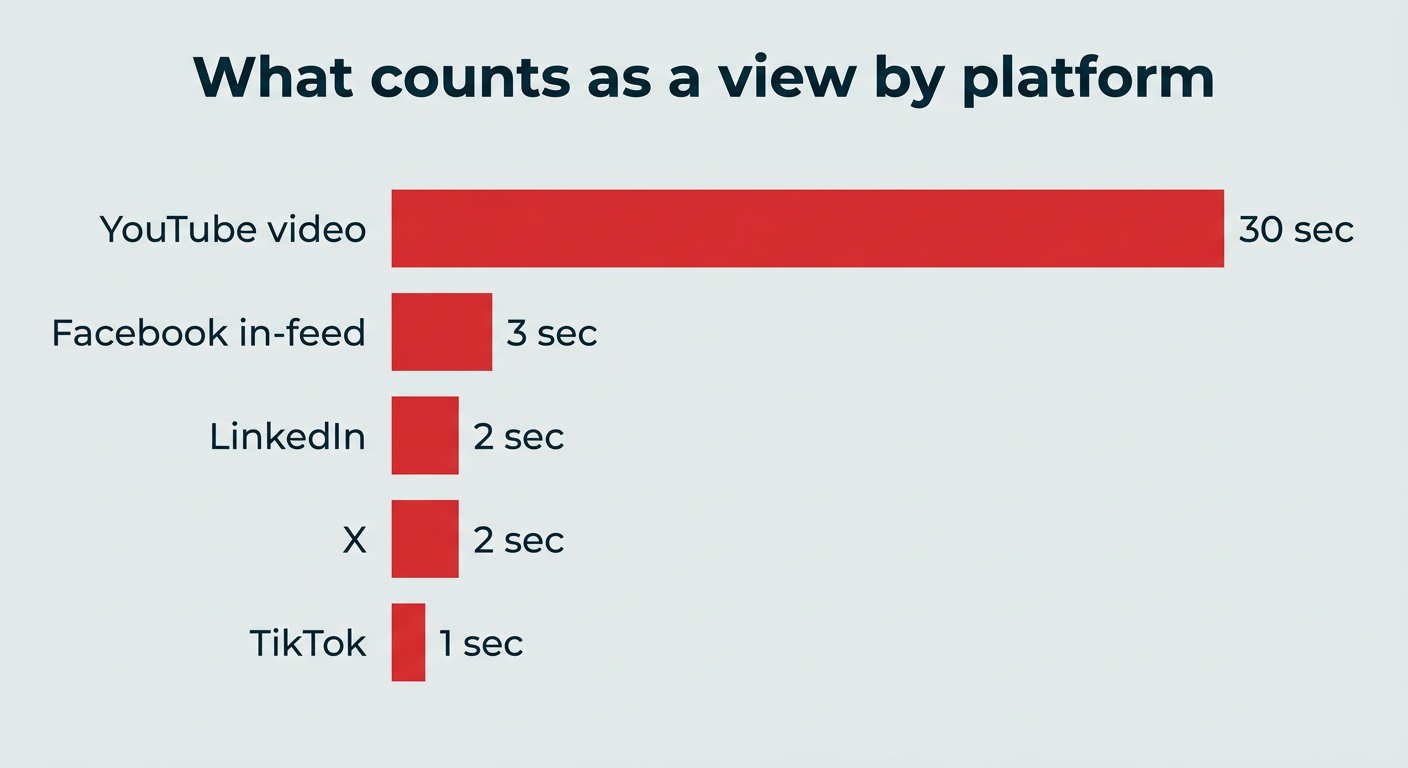
View Count: This fundamental metric quantifies how many times a video has been watched. While seemingly straightforward, its definition varies significantly by platform. YouTube typically counts a view after 30 seconds of watch time. Facebook and Instagram often count a view once the video starts playing or after 3 seconds in-feed. LinkedIn requires at least 2 seconds with 50% of the video on screen, while TikTok counts a view after just 1 second. This disparity highlights the need for platform-specific benchmarking rather than direct cross-platform comparisons of raw view numbers. Despite past controversies (like Facebook’s overstated average viewing time figures in 2018), view count remains a primary indicator of initial reach and awareness, often influencing algorithmic visibility. Consistent views signal effective content distribution, while fluctuations prompt a review of top-performing videos to identify successful patterns.
-
Engagement Rate: This metric measures the overall interaction with a video, encompassing likes, comments, shares, and saves, relative to its reach or impressions. A high engagement rate signifies that the content resonated strongly with the audience, prompting them to interact. Platform algorithms, particularly on Instagram and TikTok, prioritize content with higher engagement, increasing its visibility in feeds and recommendation systems. Comparing engagement rates against industry benchmarks or competitors provides valuable context for performance evaluation. Low engagement can point to issues with content quality, relevance, or targeting, necessitating a review of social video best practices.
-
Average Watch Time: This metric indicates the average duration viewers spend watching a video. It is a potent signal of content quality and audience interest. For example, a one-minute video with an average watch time of three seconds suggests a lack of an effective hook. Conversely, an average watch time exceeding the video’s total length (e.g., five seconds for a three-second video) implies repeat viewing, a strong positive signal. While platforms may use different labels (e.g., Facebook’s "Average time watched," YouTube’s "Average view duration"), the insight remains consistent: it reveals where audience attention is gained and lost, guiding content structure and optimal video length.

-
Video Completion Rate: This percentage represents viewers who watched a video entirely to the end. It’s calculated by dividing completed views by total views and multiplying by 100. Unlike average watch time, which provides a mean duration, completion rate offers a binary outcome: did they finish it or not? A high completion rate suggests that the content maintained interest throughout. LinkedIn considers a video "completed" at 97-100% watched, while TikTok reports it as a percentage of full watches. This metric is a strong quality signal to algorithms, especially for short-form content, as it indicates the video’s ability to hold attention.
-
Play Rate: This metric, calculated by dividing total plays by total impressions and multiplying by 100, measures the percentage of people who saw a video and chose to click "play." It is most relevant in "click-to-play" environments like YouTube, LinkedIn articles, or embedded website videos, where the viewer actively initiates playback. A low play rate often points to issues with pre-play elements such as the thumbnail, headline, or video placement, rather than the content itself. Optimizing these elements can significantly boost initial viewer engagement. On autoplay platforms like TikTok or Reels, play rate loses its significance, with retention and completion rate becoming more important.
-
Click-Through Rate (CTR): For videos designed to drive specific actions beyond viewing, CTR is critical. It measures the percentage of viewers who clicked on a link or Call-to-Action (CTA) embedded in or alongside the video. Calculated as clicks divided by total views (or impressions) multiplied by 100, CTR is the clearest indicator of whether a video successfully transitioned viewers from passive consumption to active engagement with an external resource. This metric is paramount for paid campaigns, product launches, and lead generation efforts. Given platform variations in CTA implementation (e.g., YouTube end screens, TikTok bio links, Instagram Stories links, LinkedIn in-post links), CTR should be compared within a single platform.
-
Shares: Shares occur when viewers disseminate a video to others, either through direct messages, re-posts on their own feeds, or mentions in stories. Beyond being an engagement metric, shares represent a powerful form of word-of-mouth marketing, lending credibility and expanding reach organically. As Eileen Kwok states, "Users are more likely to pay attention to content that’s shared by their peers." Both Instagram and TikTok algorithms heavily weigh shares as a ranking signal, recognizing that content worthy of sharing is likely high-quality and valuable, thereby amplifying its distribution.
-
Saves: When a viewer saves a video, it’s a strong signal of perceived value, utility, or entertainment. This action indicates that the content is deemed important enough to revisit later. Saves are particularly prevalent for "reference-style" content such as tutorials, checklists, or educational explainers. Similar to shares, platforms like Instagram and TikTok treat saves as a key ranking signal, recognizing that saved content is highly valued by users. Analyzing which videos are saved most often provides direct insight into what your audience finds genuinely useful or memorable, guiding future content strategy.
-
Traffic Source: This metric identifies the origins of video views, such as internal searches, platform feeds (e.g., TikTok’s For You Page), profile visits, or external websites. Understanding traffic sources is crucial for optimizing content distribution. For instance, a high volume of views from search suggests effective keyword optimization in titles and descriptions, while significant traffic from feeds indicates algorithmic favor and compelling hooks. External traffic sources confirm that the content is resonating beyond a brand’s immediate follower base. This data empowers marketers to refine their content strategy, focusing on keyword research for search-driven platforms or enhancing hooks for feed-driven discovery.

-
Conversion Rate: The ultimate measure of business impact, conversion rate tracks the percentage of viewers who complete a predefined action after watching a video. This could range from signing up for a newsletter, downloading an asset, making a purchase, or requesting a demo. Calculating conversion rate involves dividing the number of conversions by the total video viewers (or clicks, if a link is involved). For accurate attribution, especially in paid campaigns, tools like the Meta Pixel, TikTok Pixel, and LinkedIn Conversions API are invaluable, linking on-site actions directly back to the video that initiated them. A robust conversion rate validates the video’s effectiveness in driving tangible business results.
-
Retention and Drop-Off Points: Unlike average watch time or completion rate, retention data provides a granular view of audience engagement throughout the video’s timeline, typically visualized through a retention graph. This graph reveals precisely where viewers lose interest and drop off. Understanding these "dead zones" allows content creators to diagnose issues with pacing, narrative flow, or specific content segments. As Adam Mosseri highlighted, algorithms now consider total seconds viewed, not just completion percentage, to avoid penalizing longer, high-value videos. This means even if viewers don’t finish a long video, significant watch time still sends a positive signal. Analyzing retention graphs is a powerful diagnostic tool for continuous improvement in video production.
Strategic Optimization: Expert Recommendations for Performance Enhancement

Improving social video metrics requires a continuous cycle of creation, analysis, and refinement. Mariam (MJ) Ordubadi, Head of Marketing at Aequilibrium, offers key strategies to elevate video performance:
-
Treat the First 3 Seconds Like Prime Real Estate: In an era of endless scrolling, the initial moments of a video are critical. Ordubadi emphasizes the need for an immediate, compelling hook that stops the scroll without resorting to misleading clickbait. "The problem/solution hook" is a reliable formula, directly addressing a viewer’s need or pain point. A practical tip is the "mute test": if the visual alone in the first five seconds doesn’t compel someone to unmute, the hook needs reworking.
-
Match Length to Platform Psychology: There’s no universal "ideal" video length; rather, it depends on the platform and goal. Ordubadi notes that for discovery on TikTok, Reels, and Shorts, videos under 30 seconds often perform best. However, for educational or conversion-focused content on platforms like LinkedIn and YouTube, longer videos (2-3 minutes) can be effective, provided every second delivers value. The guiding principle is "as short as possible, as long as necessary," ensuring no "fluff" deters viewers. Utilizing platform retention graphs to identify and trim "dead zones" can significantly improve performance.

-
Obsess Over Retention, Not Just Views: While view count offers an initial measure of reach, Ordubadi prioritizes average watch time and retention rate. These metrics provide deeper insights into audience engagement and content resonance. "I want to know what’s catching the audience’s attention and what makes them bounce," she explains. This shift in focus from mere visibility to sustained attention is crucial for creating truly impactful content that algorithms will favor.
-
Build "Loopability" into Your DNA: Creating content designed for repeat viewing, or "loopable moments," has been a significant performance driver. This strategy is particularly effective on platforms like Instagram Reels and TikTok, where replay culture is ingrained. Loopable content, often characterized by layered storytelling, visual Easter eggs, or quick, dense information, encourages viewers to watch multiple times to grasp the full message. Brands like Duolingo have successfully leveraged this to drive higher watch times and retention, tapping into evolving social content consumption patterns.
-
Use AI Creatively to Drive Results: The rise of AI-native video formats presents new opportunities for content creation and scaling. Ordubadi highlights formats like "talking documents," where creators break down complex information (e.g., Google Sheets) with their face as an overlay. This style, blending clarity with authenticity, performs well with professional audiences seeking thought leadership and practical insights. AI-powered tools can also streamline content creation, assisting with drafting captions, hooks, and platform-specific variations, enabling brands to stretch one video concept across multiple channels efficiently.
Measuring Return: Calculating Social Video ROI
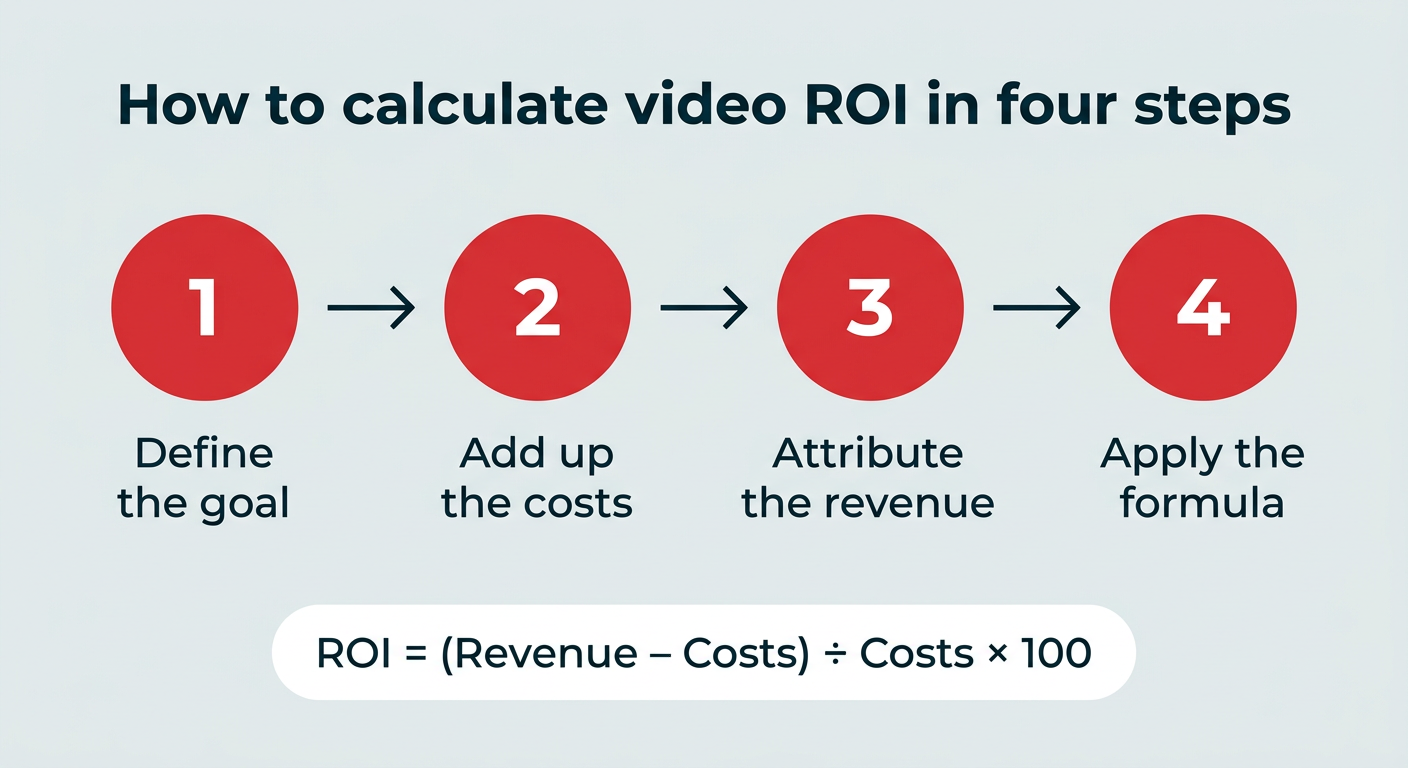
Calculating the Return on Investment (ROI) for social video is essential for demonstrating its value to stakeholders. This often-challenging task can be broken down into four key steps:
- Define Your Costs: This includes all expenses related to video production (equipment, talent, editing), paid media spend (promotions, ads), and tooling (analytics platforms, software subscriptions). Accurately aggregating these costs is foundational.
- Identify Attributed Revenue: This is the most complex step. Revenue needs to be directly linked to video content. This is typically achieved through UTM (Urchin Tracking Module) links for tracking website traffic, and platform-specific pixels (e.g., Meta Pixel, TikTok Pixel, LinkedIn Conversions API) for tracking on-site actions like purchases or sign-ups that originate from video views.
- Apply the ROI Formula: The standard formula is: (Revenue – Cost) / Cost 100 = ROI%. For example, if a campaign cost $8,000 and generated $26,000 in attributed revenue, the ROI would be ((26,000 – 8,000) / 8,000) 100 = 225%.
- Interpret and Report: Not all videos directly drive revenue. For top-of-funnel awareness content, ROI might be measured in terms of cost per thousand impressions (CPM), cost per view (CPV), or cost per engaged viewer. It is crucial to be explicit about which videos are measured by direct revenue and which by awareness metrics to maintain credibility in reporting. A holistic view often combines hard conversions with softer signals like reach and engagement.
Navigating the Data Landscape: Tools and Best Practices for Tracking
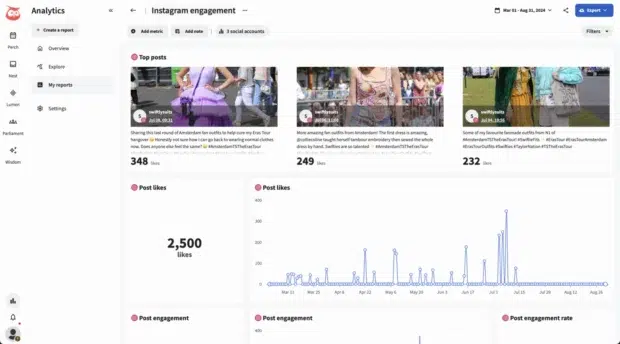
The inherent challenge in social video analytics stems from the disparate reporting mechanisms across platforms. Each network offers its own set of metrics, often with varying definitions, making cross-channel reporting cumbersome and time-consuming.
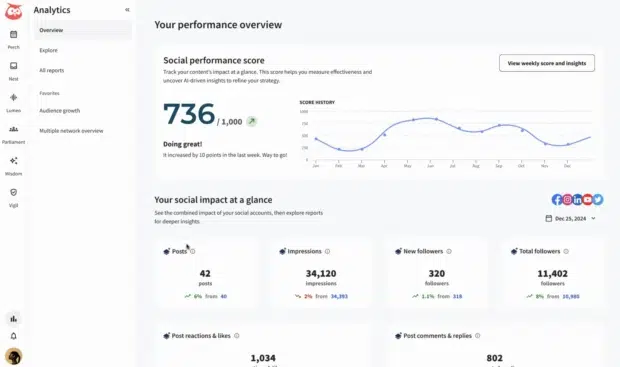
Hootsuite Social OS provides a unified dashboard that consolidates video metrics from multiple platforms into a single view. This allows marketers to track performance trends, benchmark against competitors, and generate presentation-ready reports efficiently. Integrated insights and listening apps like Lumen further enrich analysis by providing context on conversation and sentiment around video campaigns.
Utilizing a Social Media Analytics Report Template ensures consistency in reporting. A standardized template simplifies the process of collecting, organizing, and presenting data, making it easier to identify patterns, evaluate strategy effectiveness, and communicate results to stakeholders without getting bogged down in manual data reconciliation.

While Native Platform Tools (e.g., YouTube Studio, Instagram Insights, TikTok Analytics, LinkedIn Page Analytics, Facebook Creator Studio, X Analytics) offer the most granular and up-to-date data directly from each network, their siloed nature makes holistic analysis difficult. They are excellent for deep-diving into individual platform performance but less effective for comparing strategies across a multi-channel presence. Combining native data with a unified analytics platform and consistent reporting templates represents the most efficient and effective approach to social video performance management.
In conclusion, mastering social video metrics is no longer optional but a critical component of a successful digital marketing strategy. By meticulously tracking key performance indicators, aligning them with specific business objectives, and continuously refining content based on data-driven insights, brands can unlock the full potential of social video to build awareness, drive engagement, and ultimately, achieve measurable business growth. The landscape of social video is dynamic, and a data-first approach is the compass that guides marketers through its ever-evolving currents.

 Asro

 Iffa Jayyana