

Statistical power represents the probability that a controlled experiment will detect a true effect of a specific magnitude when such an effect actually exists. In the landscape of digital experimentation and conversion rate optimization (CRO), statistical power serves as the primary measure of a test’s sensitivity. While much of the industry’s focus remains on statistical significance—the protection against false positives—statistical power is the critical safeguard against false negatives, or Type II errors. Without adequate power, organizations risk discarding viable product improvements, leading to significant unrealized revenue and a fundamental misunderstanding of user behavior.
The Fundamental Mechanics of Statistical Power
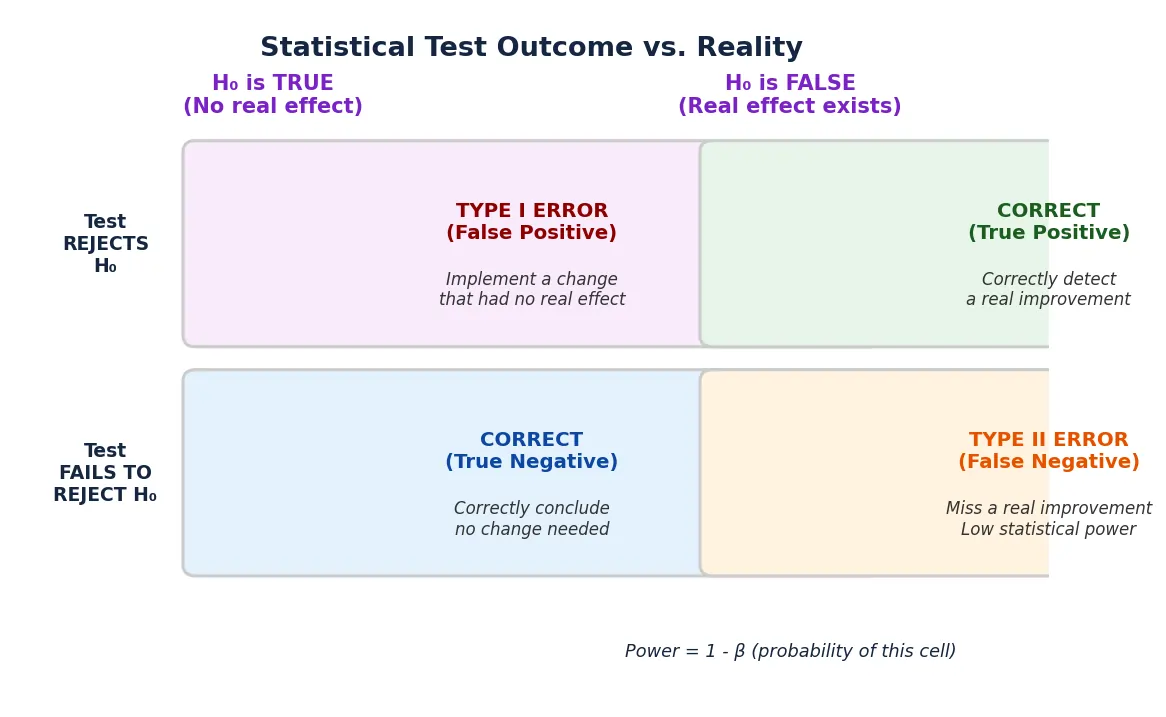
At its core, statistical power is mathematically defined as 1 minus beta (1 – β), where beta is the probability of committing a Type II error. A Type II error occurs when an experiment fails to reject a null hypothesis that is, in fact, false. In practical terms, if an A/B test variation truly improves conversions by a margin equal to the study’s design effect, the power of the test dictates the likelihood that the experiment will return a statistically significant result.

The industry standard for statistical power is typically set at 0.80, or 80%. This threshold implies that if a true effect exists at the specified Minimum Detectable Effect (MDE), the test has an 80% chance of identifying it and a 20% chance of missing it. While 80% is the conventional benchmark, high-stakes experiments involving core infrastructure or major revenue drivers often require power levels of 90% or higher to minimize the risk of overlooking a beneficial change.
Distinguishing Power from Statistical Significance
A common misconception in data analysis is the conflation of power with significance. These two metrics protect against opposite risks. Significance, or alpha (α), controls the false positive rate—the probability of claiming a "winner" when there is no real difference between variations. Power controls the false negative rate—the probability of failing to see a "winner" that actually exists.
A test can be designed with high statistical rigor regarding significance (e.g., a 95% confidence level) but remain fundamentally underpowered. In such scenarios, a "non-significant" result is frequently misinterpreted as proof that a variation had no impact. In reality, an underpowered test simply lacks the data volume necessary to distinguish a small but real lift from random noise.

The Four Pillars of Experimental Sensitivity
The power of any statistical test is determined by the interplay of four primary factors. Adjusting any one of these variables necessitates a corresponding shift in the others to maintain the same level of sensitivity.
1. Sample Size (N)
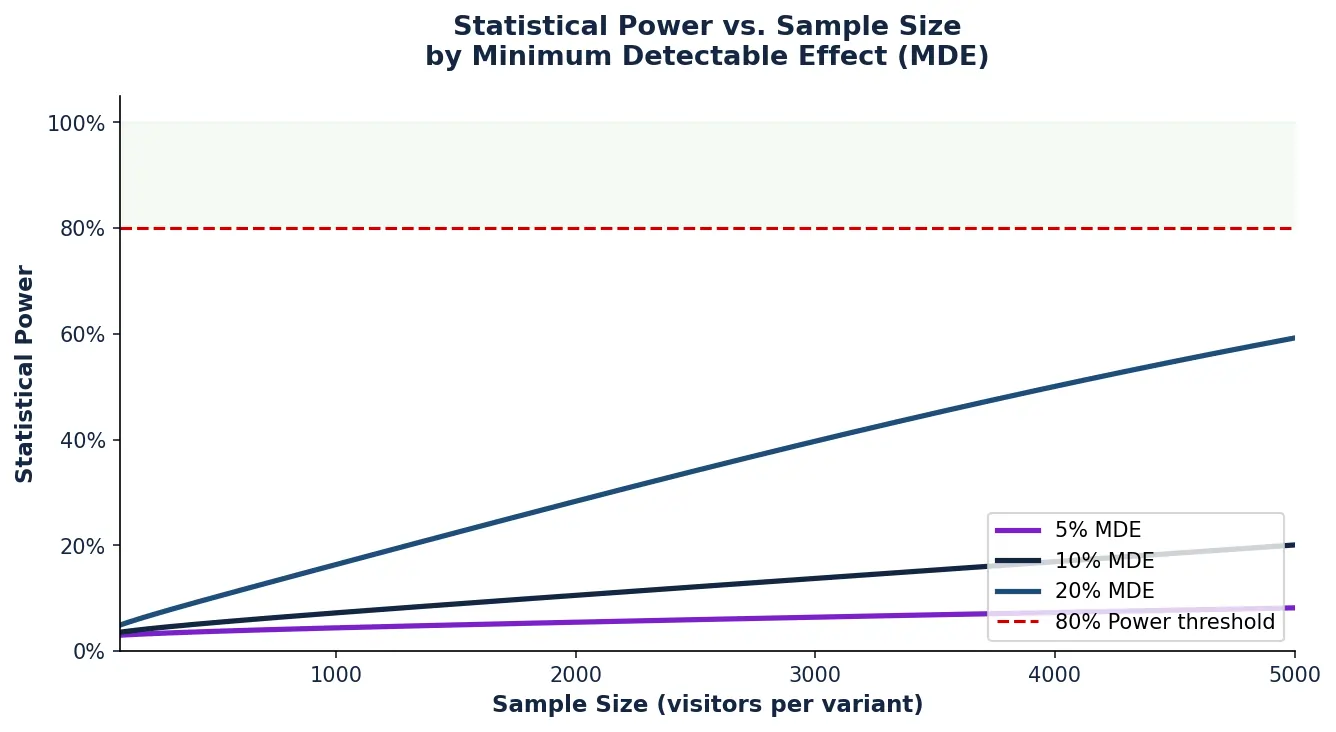
The sample size is the total number of independent units, typically unique visitors, included in the experiment. As the sample size increases, the standard error decreases, allowing the test to more easily identify smaller deviations from the baseline. Consequently, larger samples directly correlate with higher statistical power.
2. Minimum Detectable Effect (MDE)
The MDE is the smallest relative or absolute lift an experiment is designed to detect reliably. There is an inverse relationship between MDE and power: larger effects are easier to spot with less data, whereas smaller, more subtle effects require significantly larger sample sizes to achieve the same power threshold. Setting an unrealistically low MDE can lead to "evergreen" tests that never reach conclusion, while an excessively high MDE may cause the team to miss profitable, incremental gains.
3. Significance Level (Alpha)
The significance level determines the burden of proof required to declare a result valid. By tightening the significance level (e.g., moving from a 5% alpha to a 1% alpha), the test becomes more conservative. This increased caution regarding false positives naturally reduces the power of the test, as the threshold for evidence becomes harder to reach.
4. Data Variability (Variance)
Variance represents the natural fluctuation or "noise" within the dataset. In conversion testing, variance is often tied to the baseline conversion rate. In revenue-based testing, variance is influenced by the spread of order values. High-variance environments—such as e-commerce stores with products ranging from $10 to $5,000—require more data to achieve the same power as low-variance environments, such as subscription services with a fixed monthly fee.
Chronology of a Professional Power Analysis
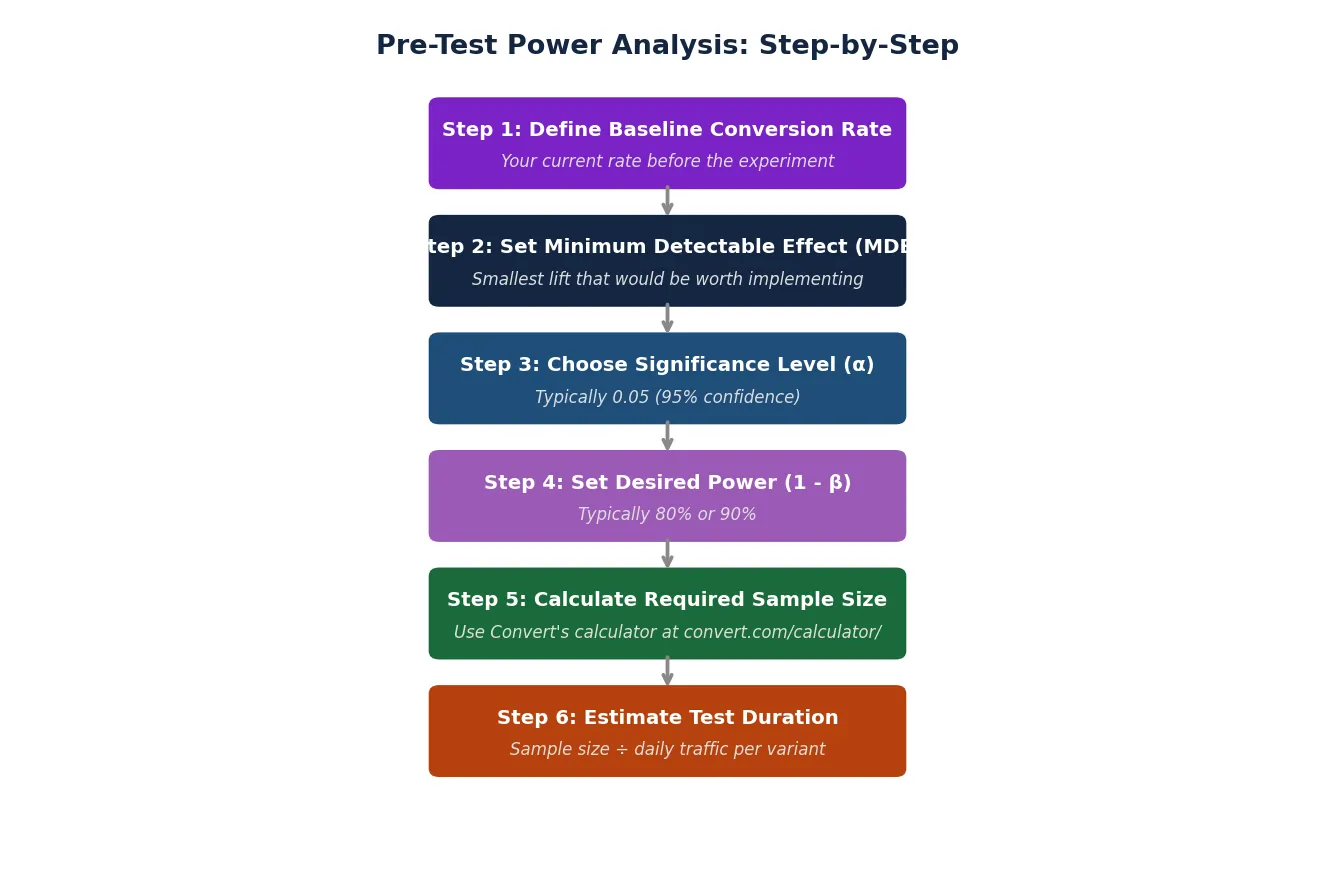
To ensure data integrity, a power analysis must be conducted during the experimental design phase, prior to the deployment of any code. The following chronology outlines the standard protocol for preparing a statistically sound A/B test.
Phase I: Baseline Establishment
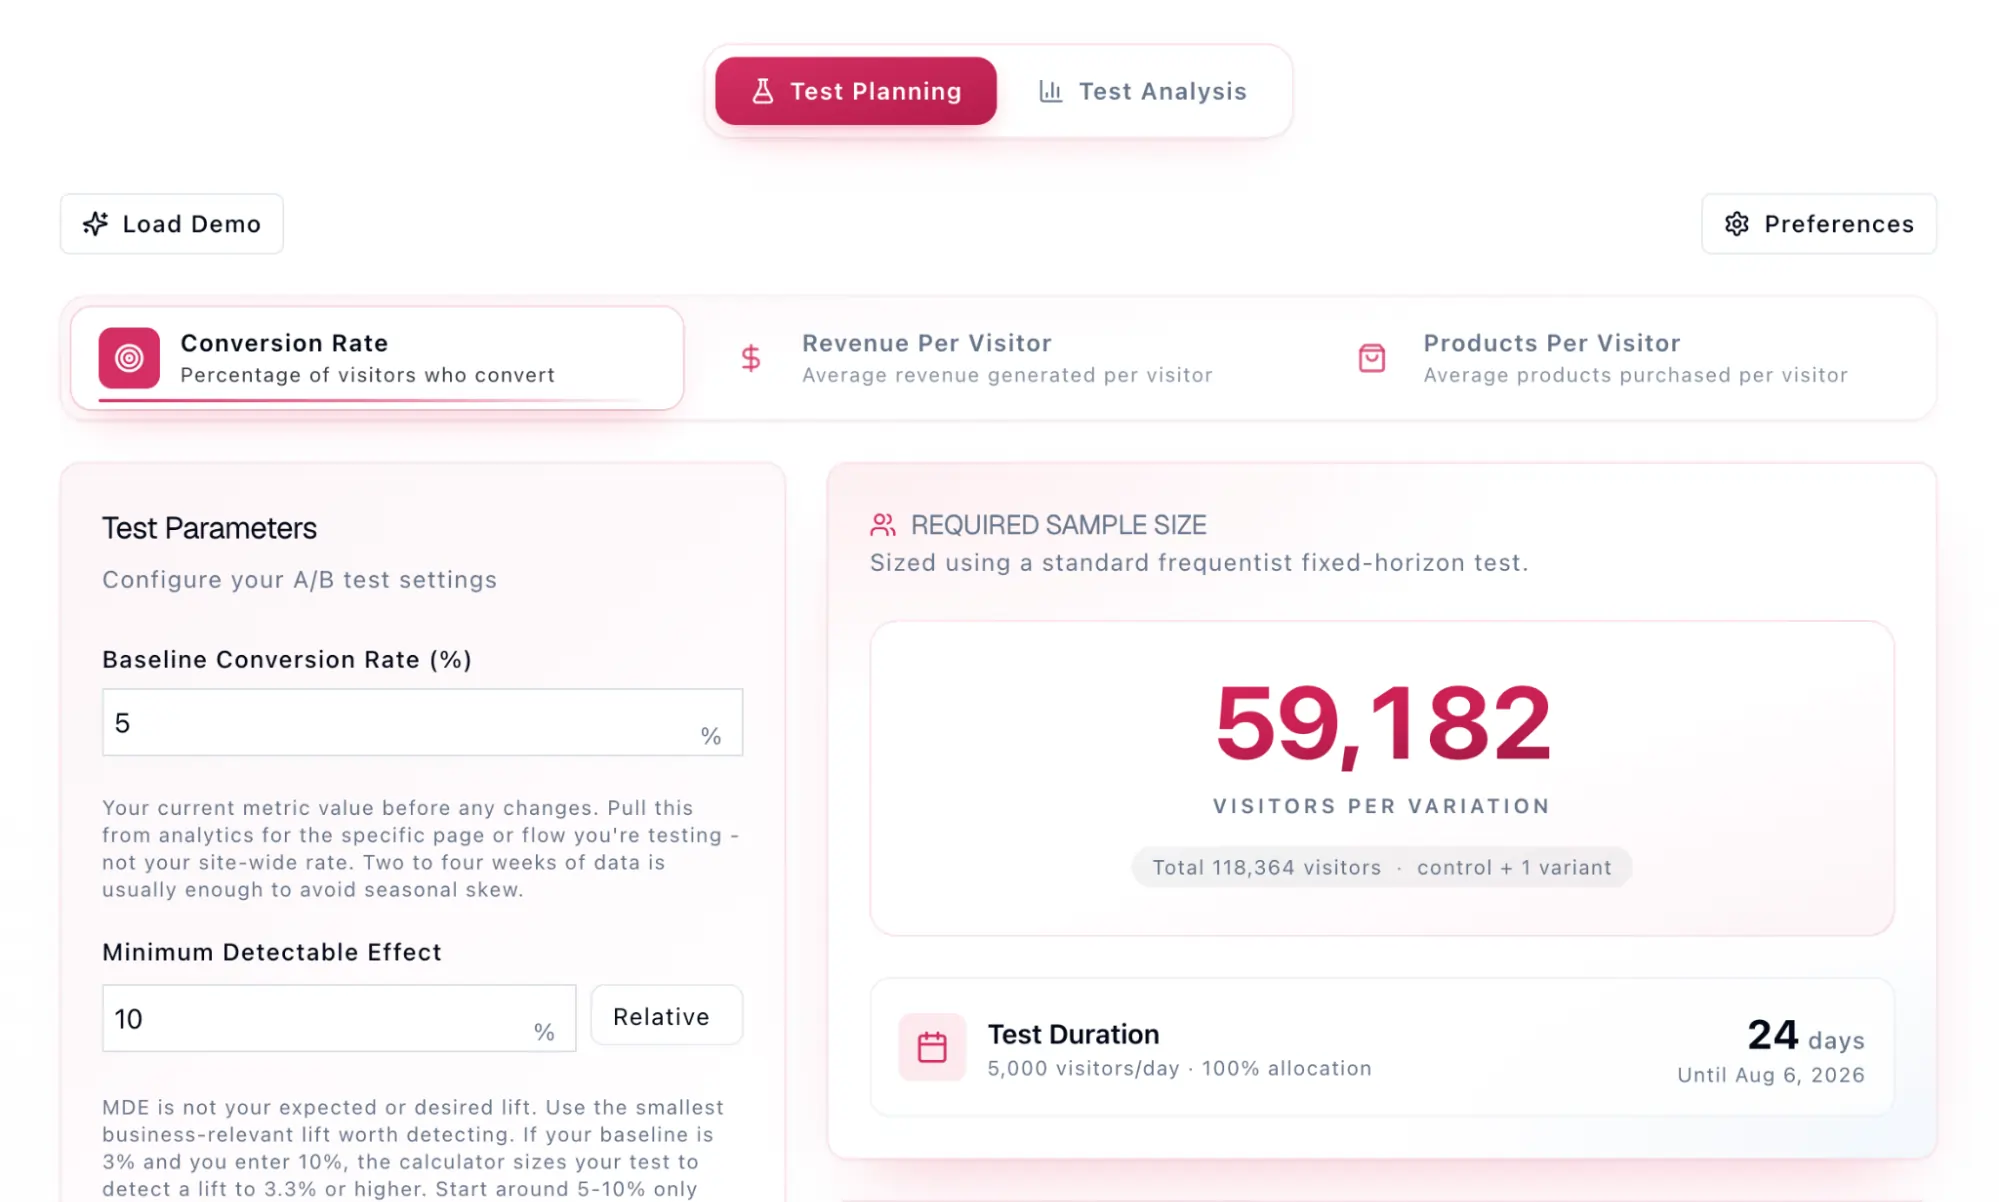
The analyst first determines the current performance of the control variation using historical data from a recent and representative window (typically 30 to 90 days). For a conversion-based test, this is the Baseline Conversion Rate (CVR).
Phase II: Business Logic and MDE Selection
The team determines the MDE based on business requirements. This is not a "guess" of what the lift will be, but rather a calculation of what lift is required to justify the cost of implementation or the risk of the change.
Phase III: Parameter Configuration
The significance level (usually 0.05) and the target power (usually 0.80) are locked in. If multiple variations are being tested against a single control, the alpha is often adjusted using corrections like the Bonferroni or Dunnett’s test to prevent "alpha inflation."
Phase IV: Sample Size Calculation
Using the baseline, MDE, alpha, and power, a statistical formula calculates the required sample size per variation.
Phase V: Duration Estimation
The total required sample is divided by the average daily traffic to the tested page. This provides an estimated runtime. If the runtime exceeds a reasonable window (e.g., more than four to six weeks), the experiment design must be revisited to avoid "sample pollution" from returning users or external seasonal factors.
The Financial and Scientific Cost of Underpowered Testing
The implications of ignoring statistical power are both economic and methodological. Underpowered tests lead to what is known in the scientific community as the "Winner’s Curse" or "Effect Size Overestimation."
The Revenue Gap
Consider a SaaS enterprise generating $1,000,000 in monthly recurring revenue (MRR) with a 5% baseline conversion rate. If the product team launches an underpowered test designed only to catch a 10% lift, but the new feature actually provides a 2% lift, the test will likely return a non-significant result. The team will discard the feature, losing $20,000 in additional monthly revenue. Annually, this single failure to account for power costs the organization $240,000 in unrealized growth.
The False Discovery Rate
Low power also undermines the credibility of significant results. When power is low, the few results that do cross the significance threshold are often those where the random noise happened to swing in the same direction as the effect. This leads to a high False Discovery Rate (FDR). In a scenario where 100 tests are run at 10% power and a 10% significance level, approximately half of the "winning" results could be false positives. This contamination of the "winner’s circle" leads to "Twyman’s Law," which states that any data that looks interesting or unusual is likely wrong.
Methodological Variations: Frequentist, Sequential, and Bayesian
Modern experimentation platforms handle power differently based on their underlying statistical frameworks.
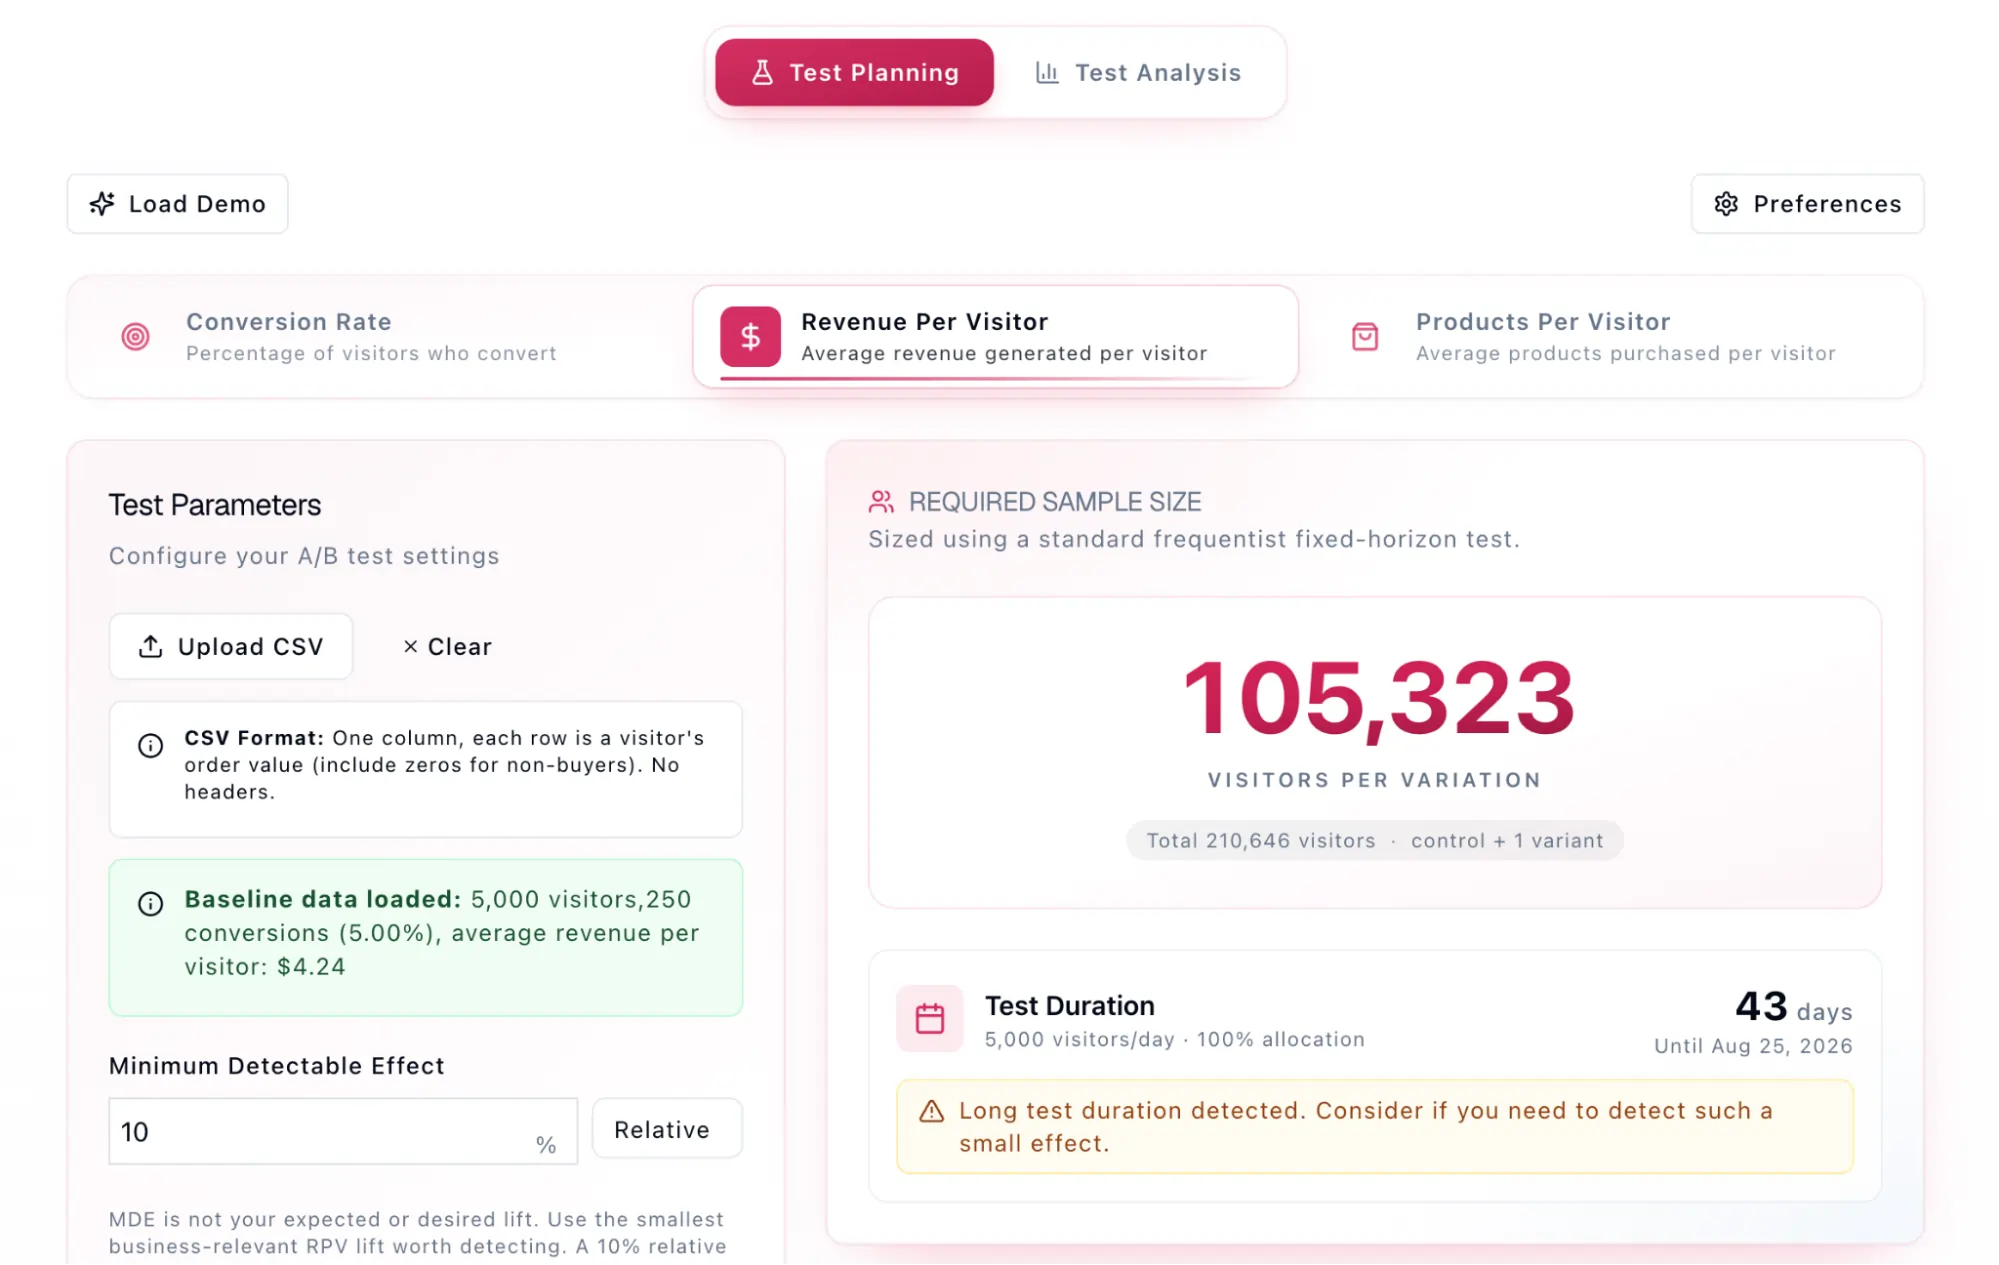
- Fixed-Horizon Frequentist: This is the traditional approach where the sample size is fixed in advance. Power is a binary state: the test is either sufficiently powered for the MDE at the end of the sample, or it is not.
- Sequential Testing: This method allows for continuous monitoring of data. It uses "alpha spending functions" to adjust significance boundaries. While sequential testing can allow for early stopping if an effect is massive, it still requires a power-based "horizon" to ensure that the test does not run indefinitely in search of a tiny effect.
- Bayesian Inference: Bayesian models do not use "power" in the frequentist sense. Instead, they focus on the "probability of beating the control" and "expected loss." However, the concept of sensitivity remains; a Bayesian test with low data volume will simply have a high "uncertainty" or a wide credible interval, serving the same functional purpose as a power analysis.
Advanced Considerations for Revenue Metrics
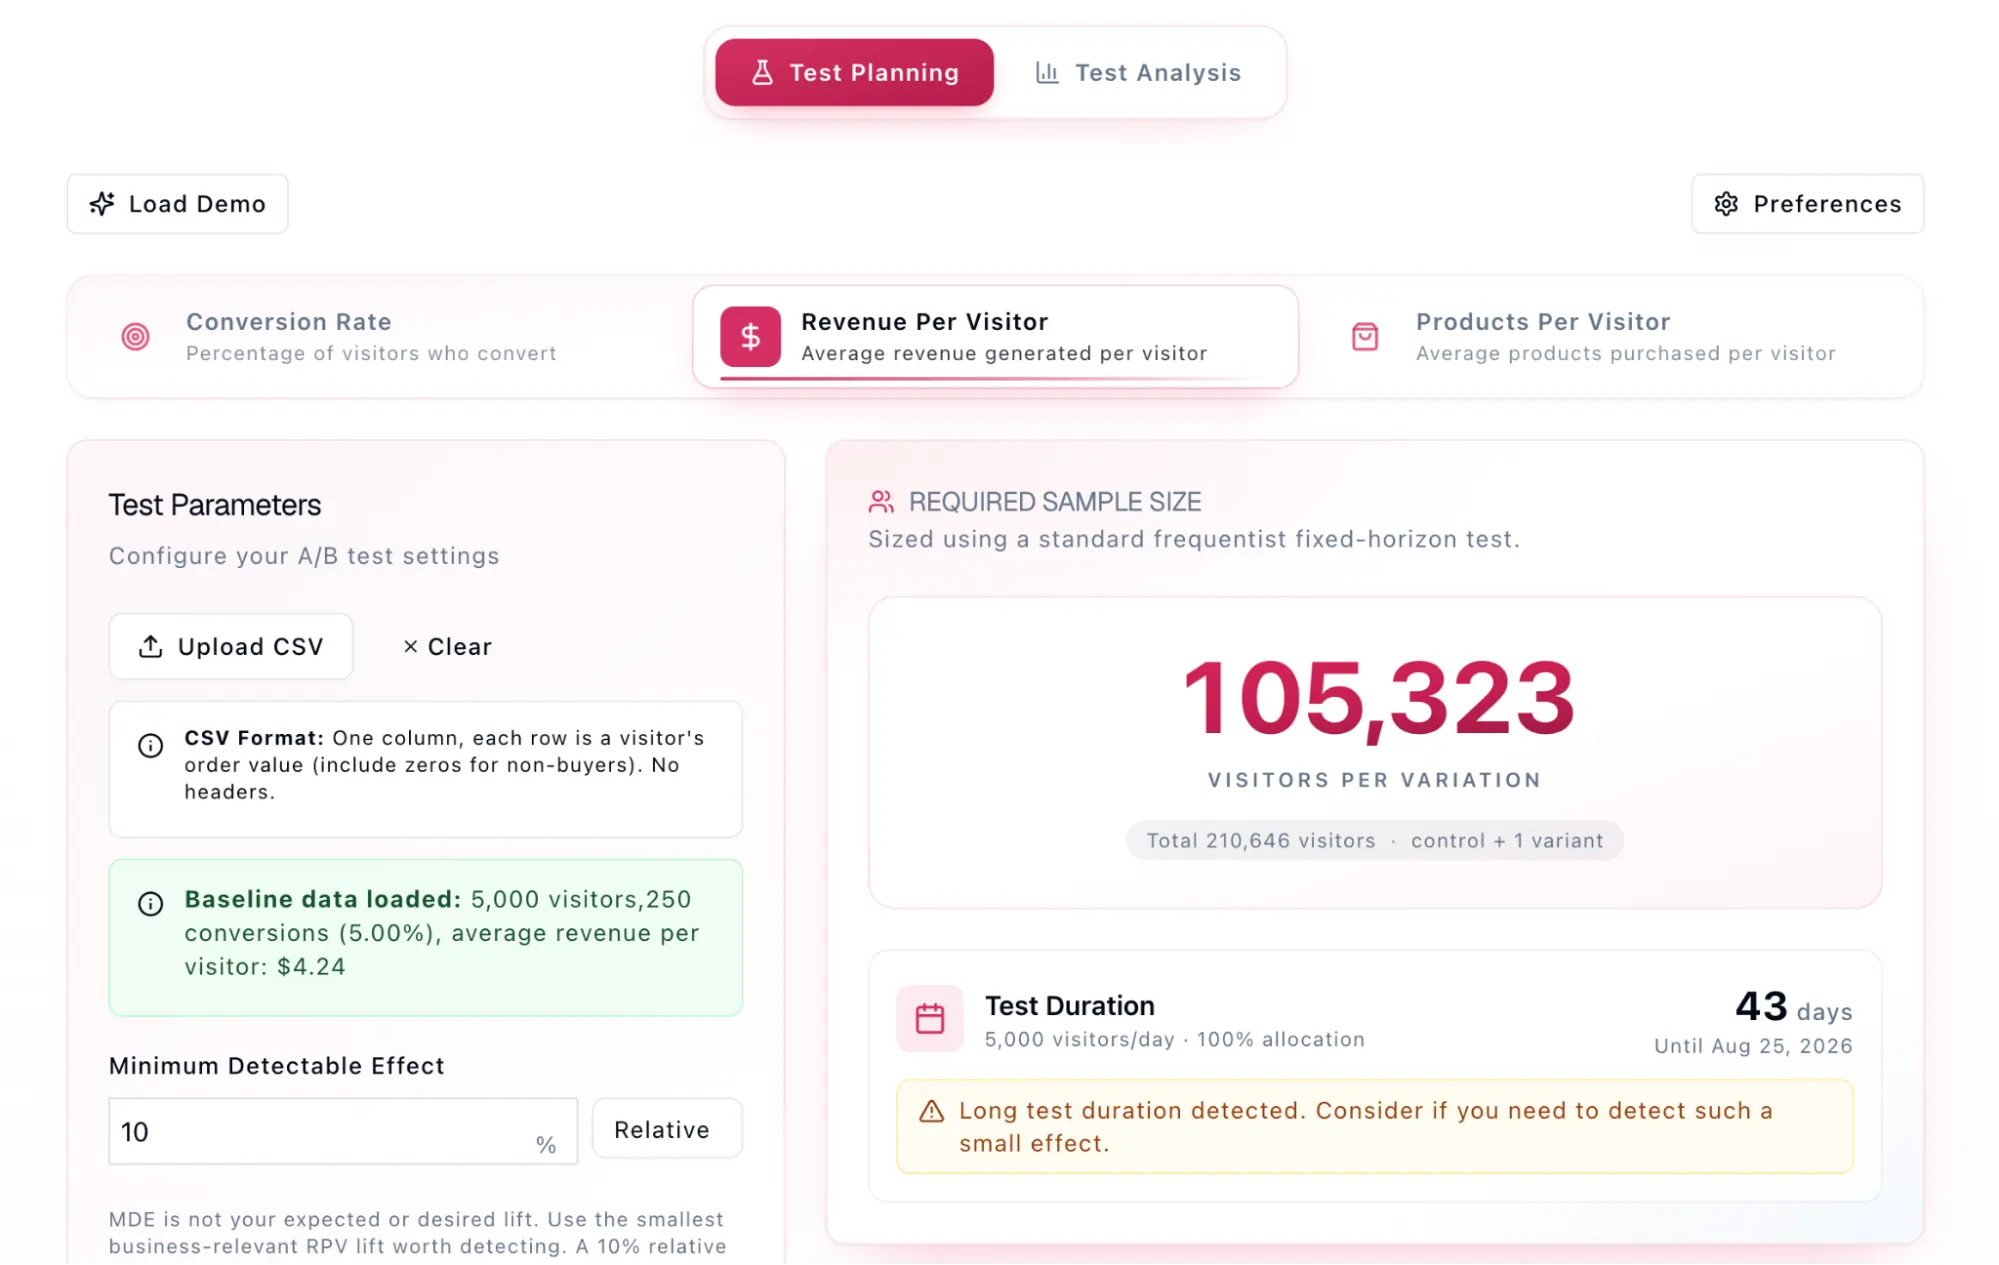
Testing for Revenue Per Visitor (RPV) is significantly more complex than testing for binary conversion rates. Because conversion is a "yes/no" outcome, its variance is mathematically capped. RPV, however, involves both the conversion rate and the Average Order Value (AOV).
Data from recent industry benchmarks suggests that RPV tests often require nearly double the sample size of conversion tests to reach the same power level. This is due to the "long tail" of e-commerce spending, where a single large purchase can skew the mean. To power these tests correctly, analysts must calculate the standard deviation of their revenue data, a step often overlooked by novice experimenters.
Strategic Adaptations for Low-Traffic Environments
Not every organization has the traffic volume of a global retailer. When a power analysis indicates that a test would take months to conclude, teams must adopt alternative strategies:

- Macro-Conversion vs. Micro-Conversion: If "Purchases" are too infrequent to power a test, teams may test against "Add to Cart" or "Checkout Start" to increase the baseline conversion rate and reduce the required sample.
- Increased MDE: The team may decide they are only interested in "home run" wins (e.g., 20% lift) and accept that they will miss smaller, incremental gains.
- Sequential Monitoring: Utilizing frameworks that allow for valid early stopping can help capture strong signals faster, though it does not solve the problem of detecting subtle effects.
- Audience Segmentation: Focusing the test on a high-intent segment (e.g., mobile users only) can sometimes reduce variance and provide a cleaner signal, provided the findings are not over-generalized to the entire population.
Conclusion and Broader Implications
Statistical power is the silent engine of a mature experimentation program. In an era where data-driven decision-making is a competitive necessity, the ability to distinguish between "no effect" and "insufficient data" is paramount. By prioritizing power analysis during the design phase, organizations protect themselves from the financial drain of missed opportunities and the strategic danger of false discoveries. Ultimately, a commitment to statistical power is a commitment to the reliability of the entire product roadmap, ensuring that every "winner" is a genuine step forward and every "inconclusive" result is a prompt for more sensitive investigation.







