

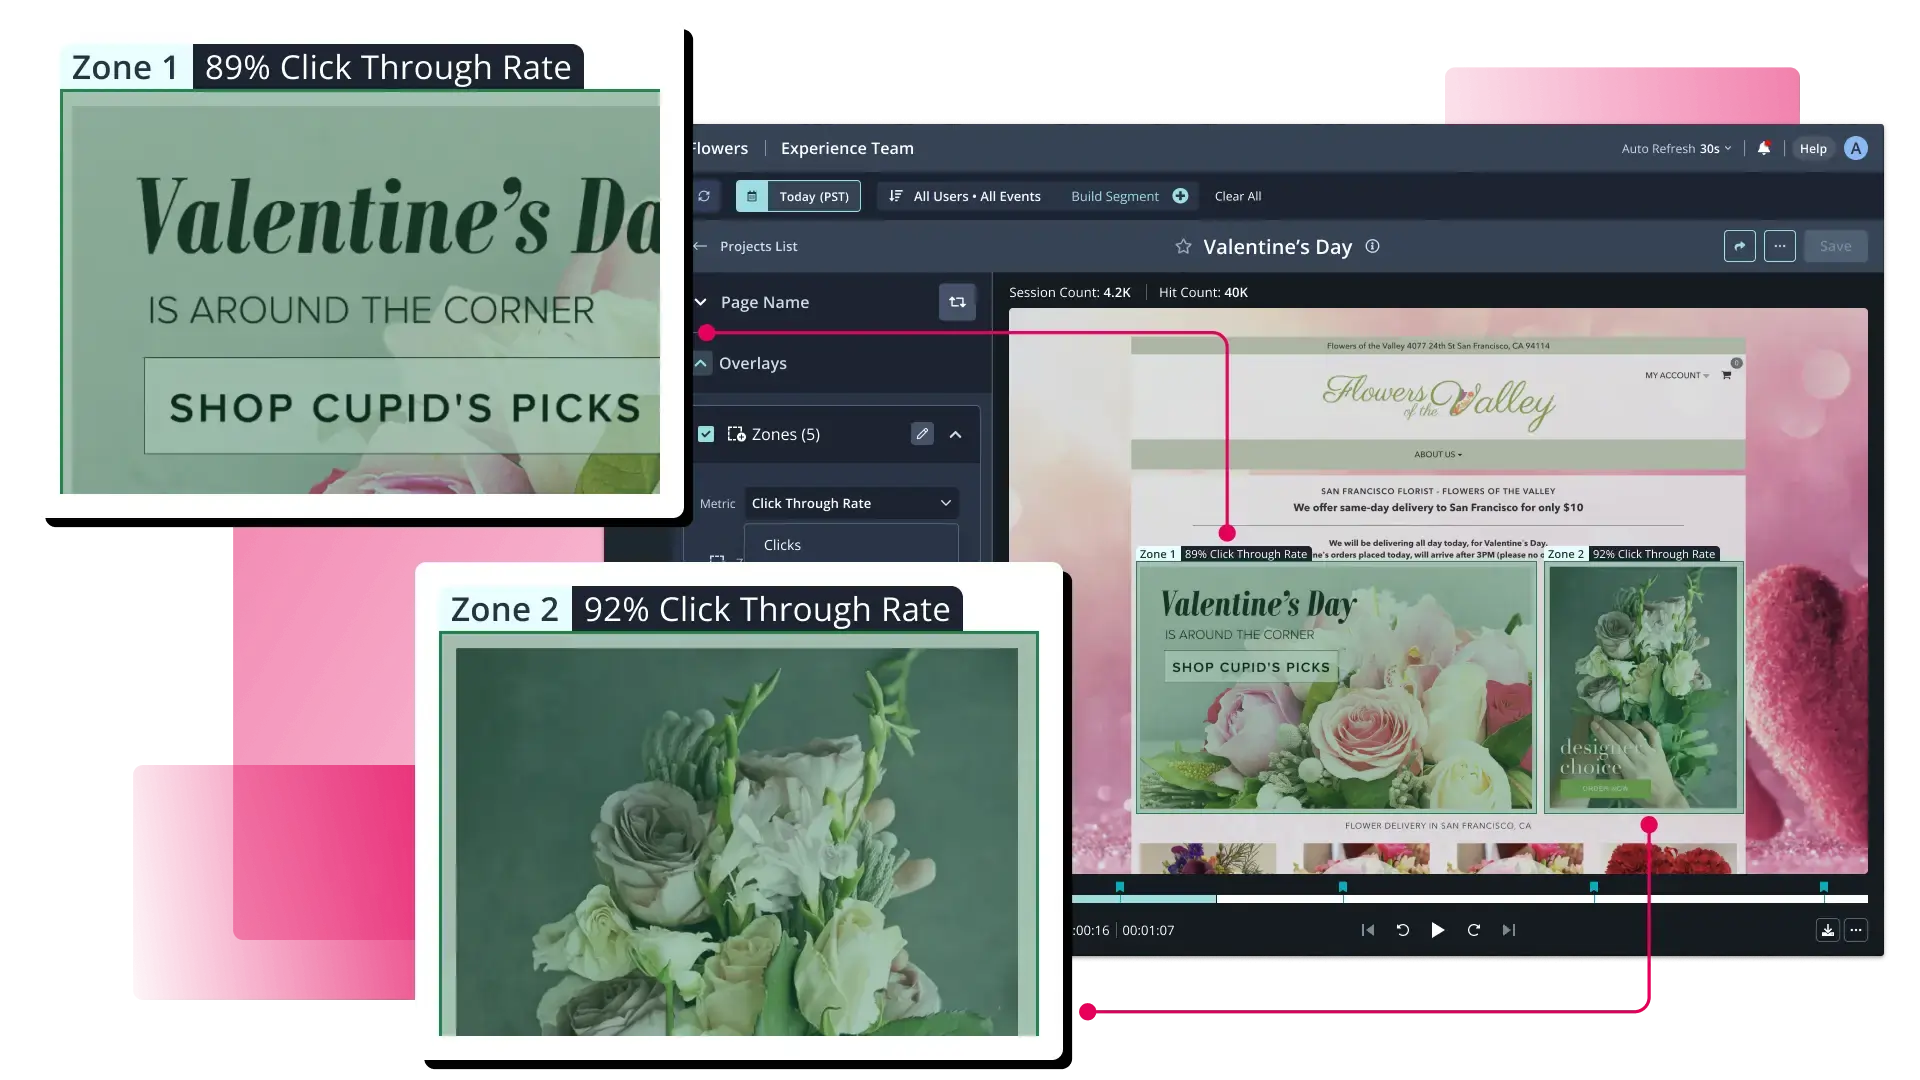
Top 14 Heatmap Tools to Optimize Website User Experience and Drive Conversion Growth in 2025 represents a critical evaluation of the digital analytics landscape, where visual behavior data has become the cornerstone of modern conversion rate optimization (CRO) strategies. As global digital advertising costs continue to rise, businesses are shifting their focus from raw traffic acquisition to the scientific optimization of existing site visitors. Heatmapping software, once a niche visualization tool, has evolved into a sophisticated suite of behavioral intelligence platforms that allow in-house testers and specialized agencies to identify friction points, visualize user intent, and justify design changes with empirical data.
The Evolution of Behavioral Analytics and Heatmapping Technology
The digital experience monitoring market has undergone a significant transformation over the last decade. Early iterations of heatmapping tools relied on static screenshots and basic click-tracking scripts. Today, the industry has matured into a multi-billion dollar sector characterized by real-time data processing, AI-driven frustration detection, and seamless integration with A/B testing frameworks.
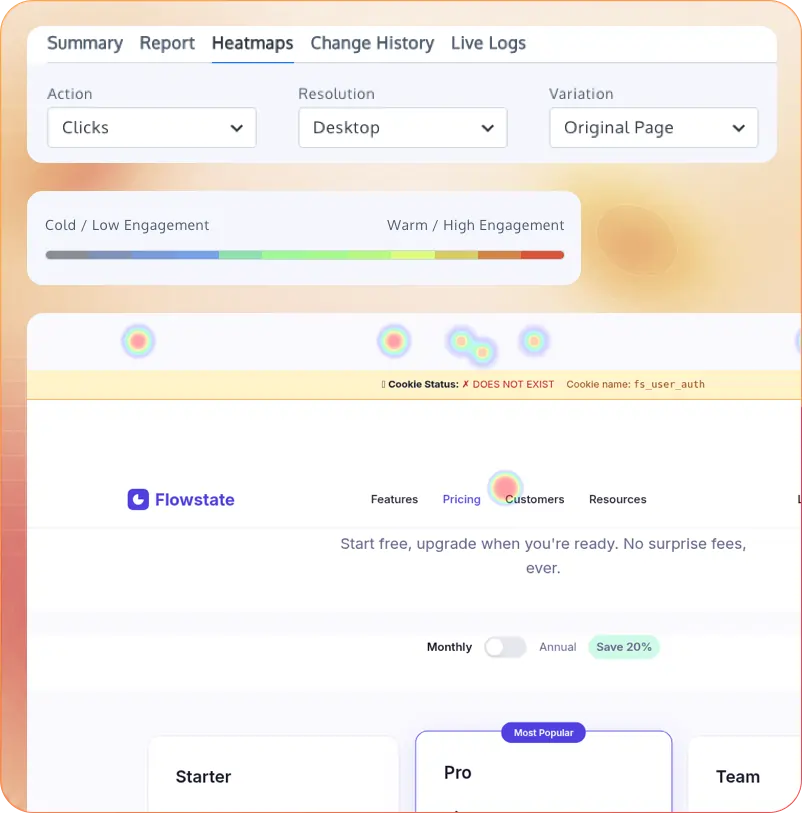
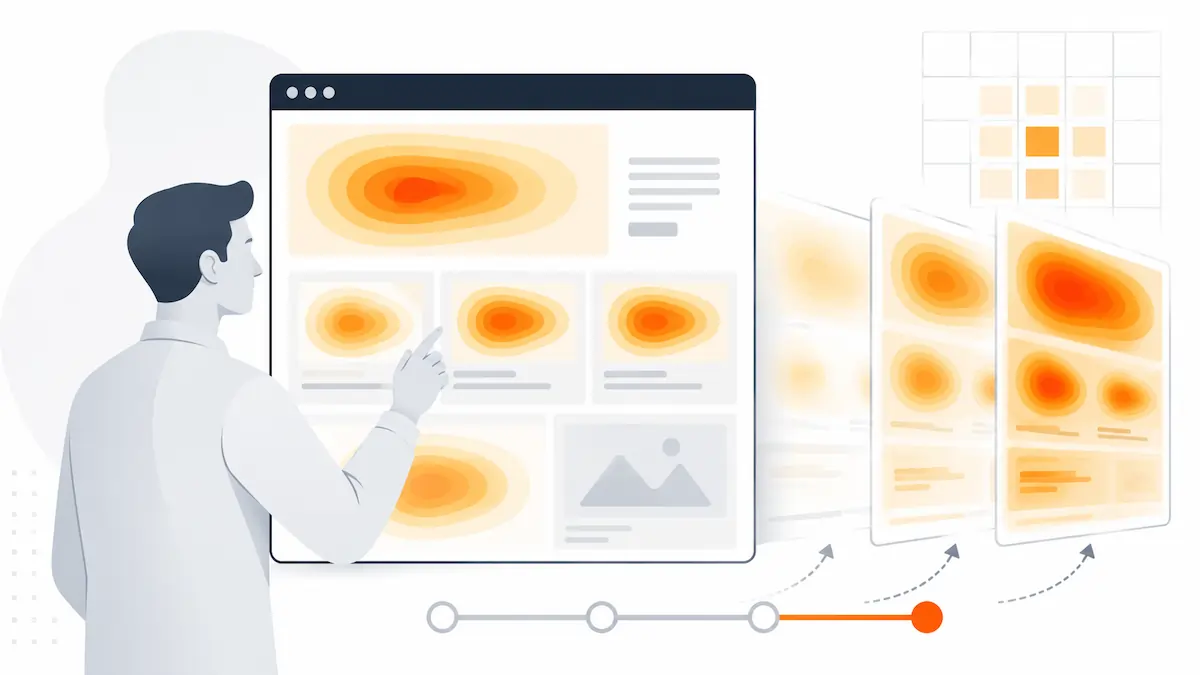
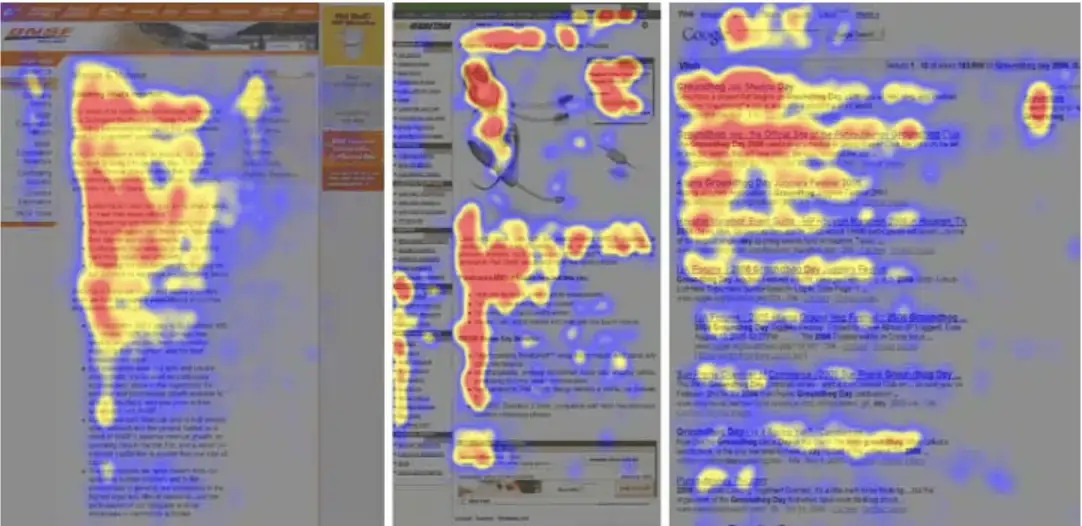
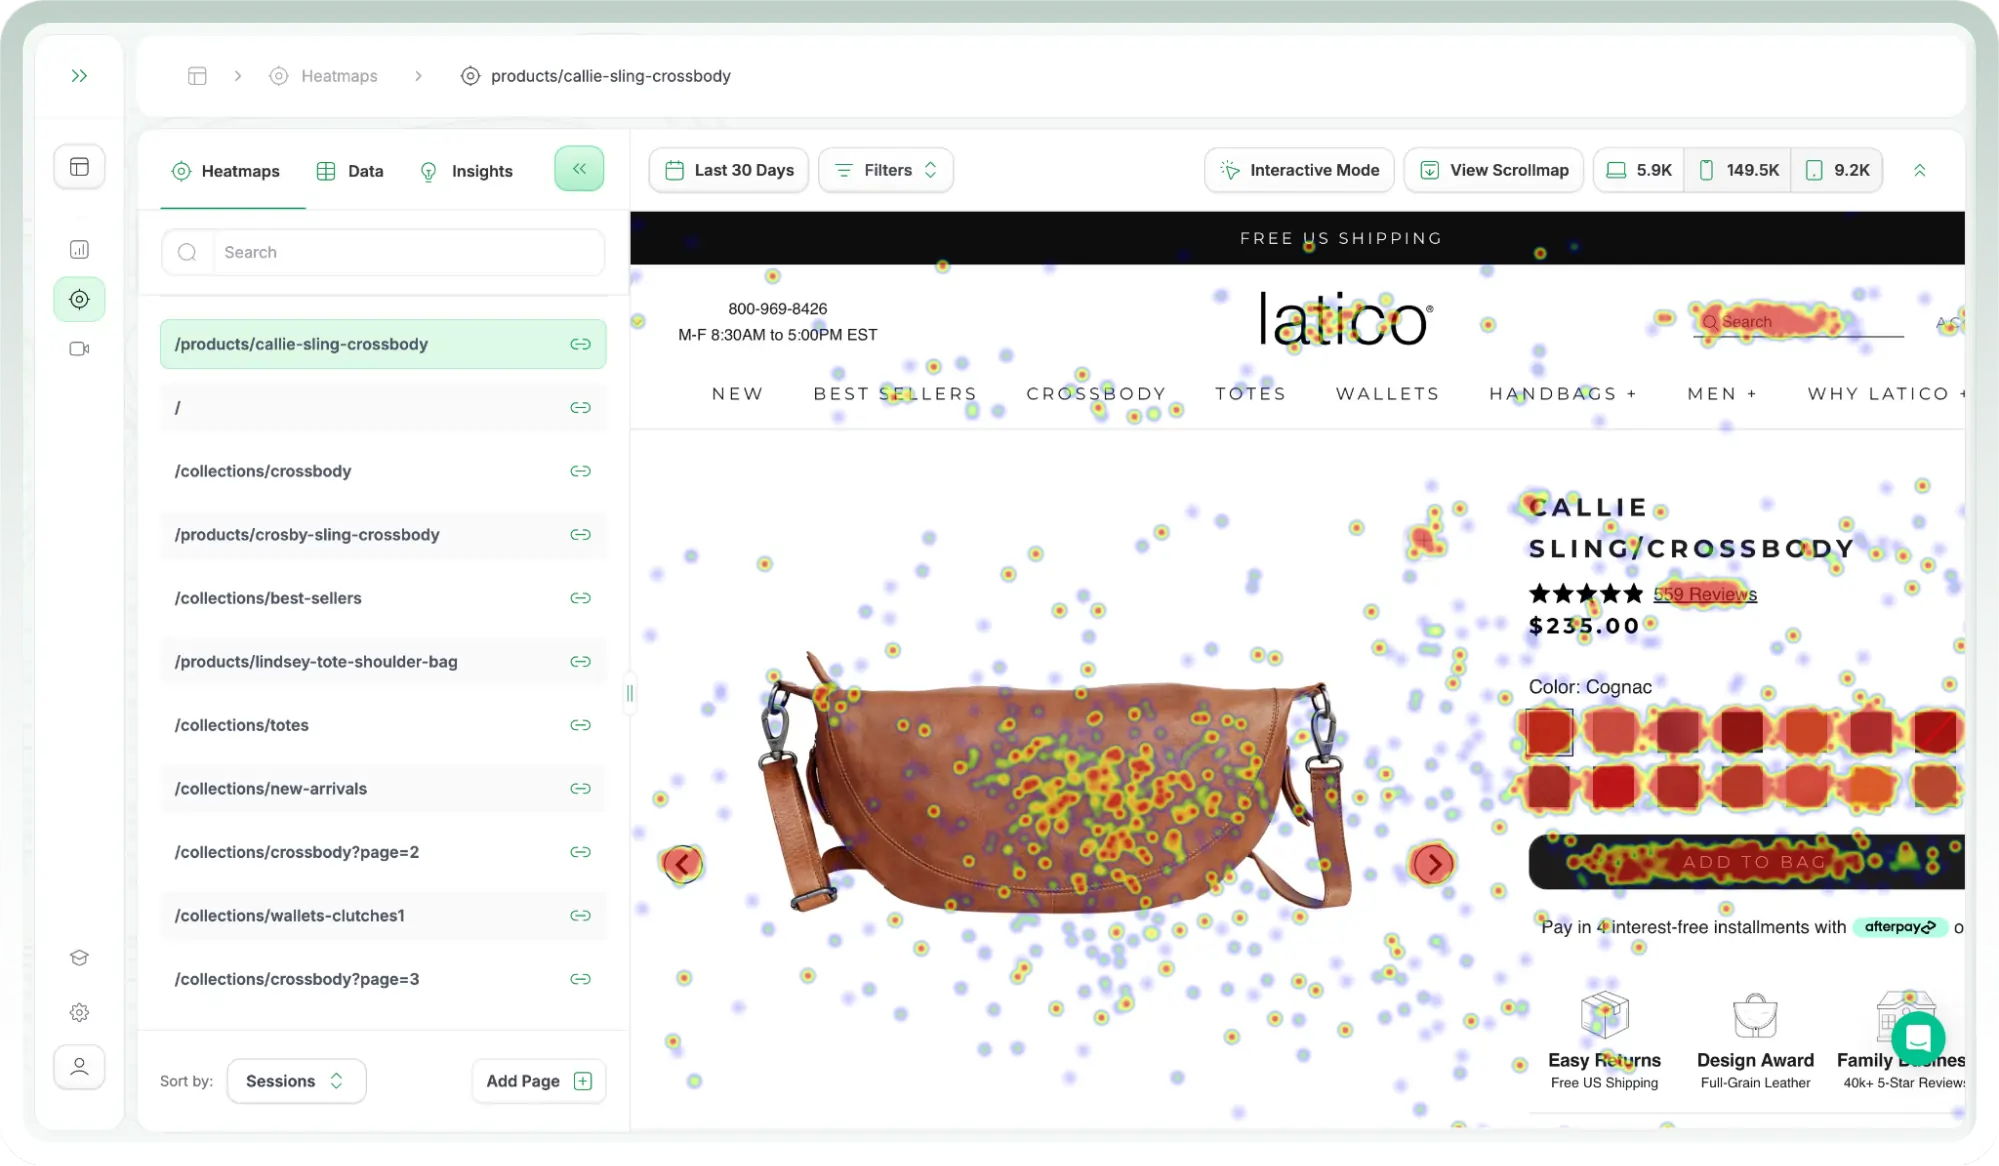
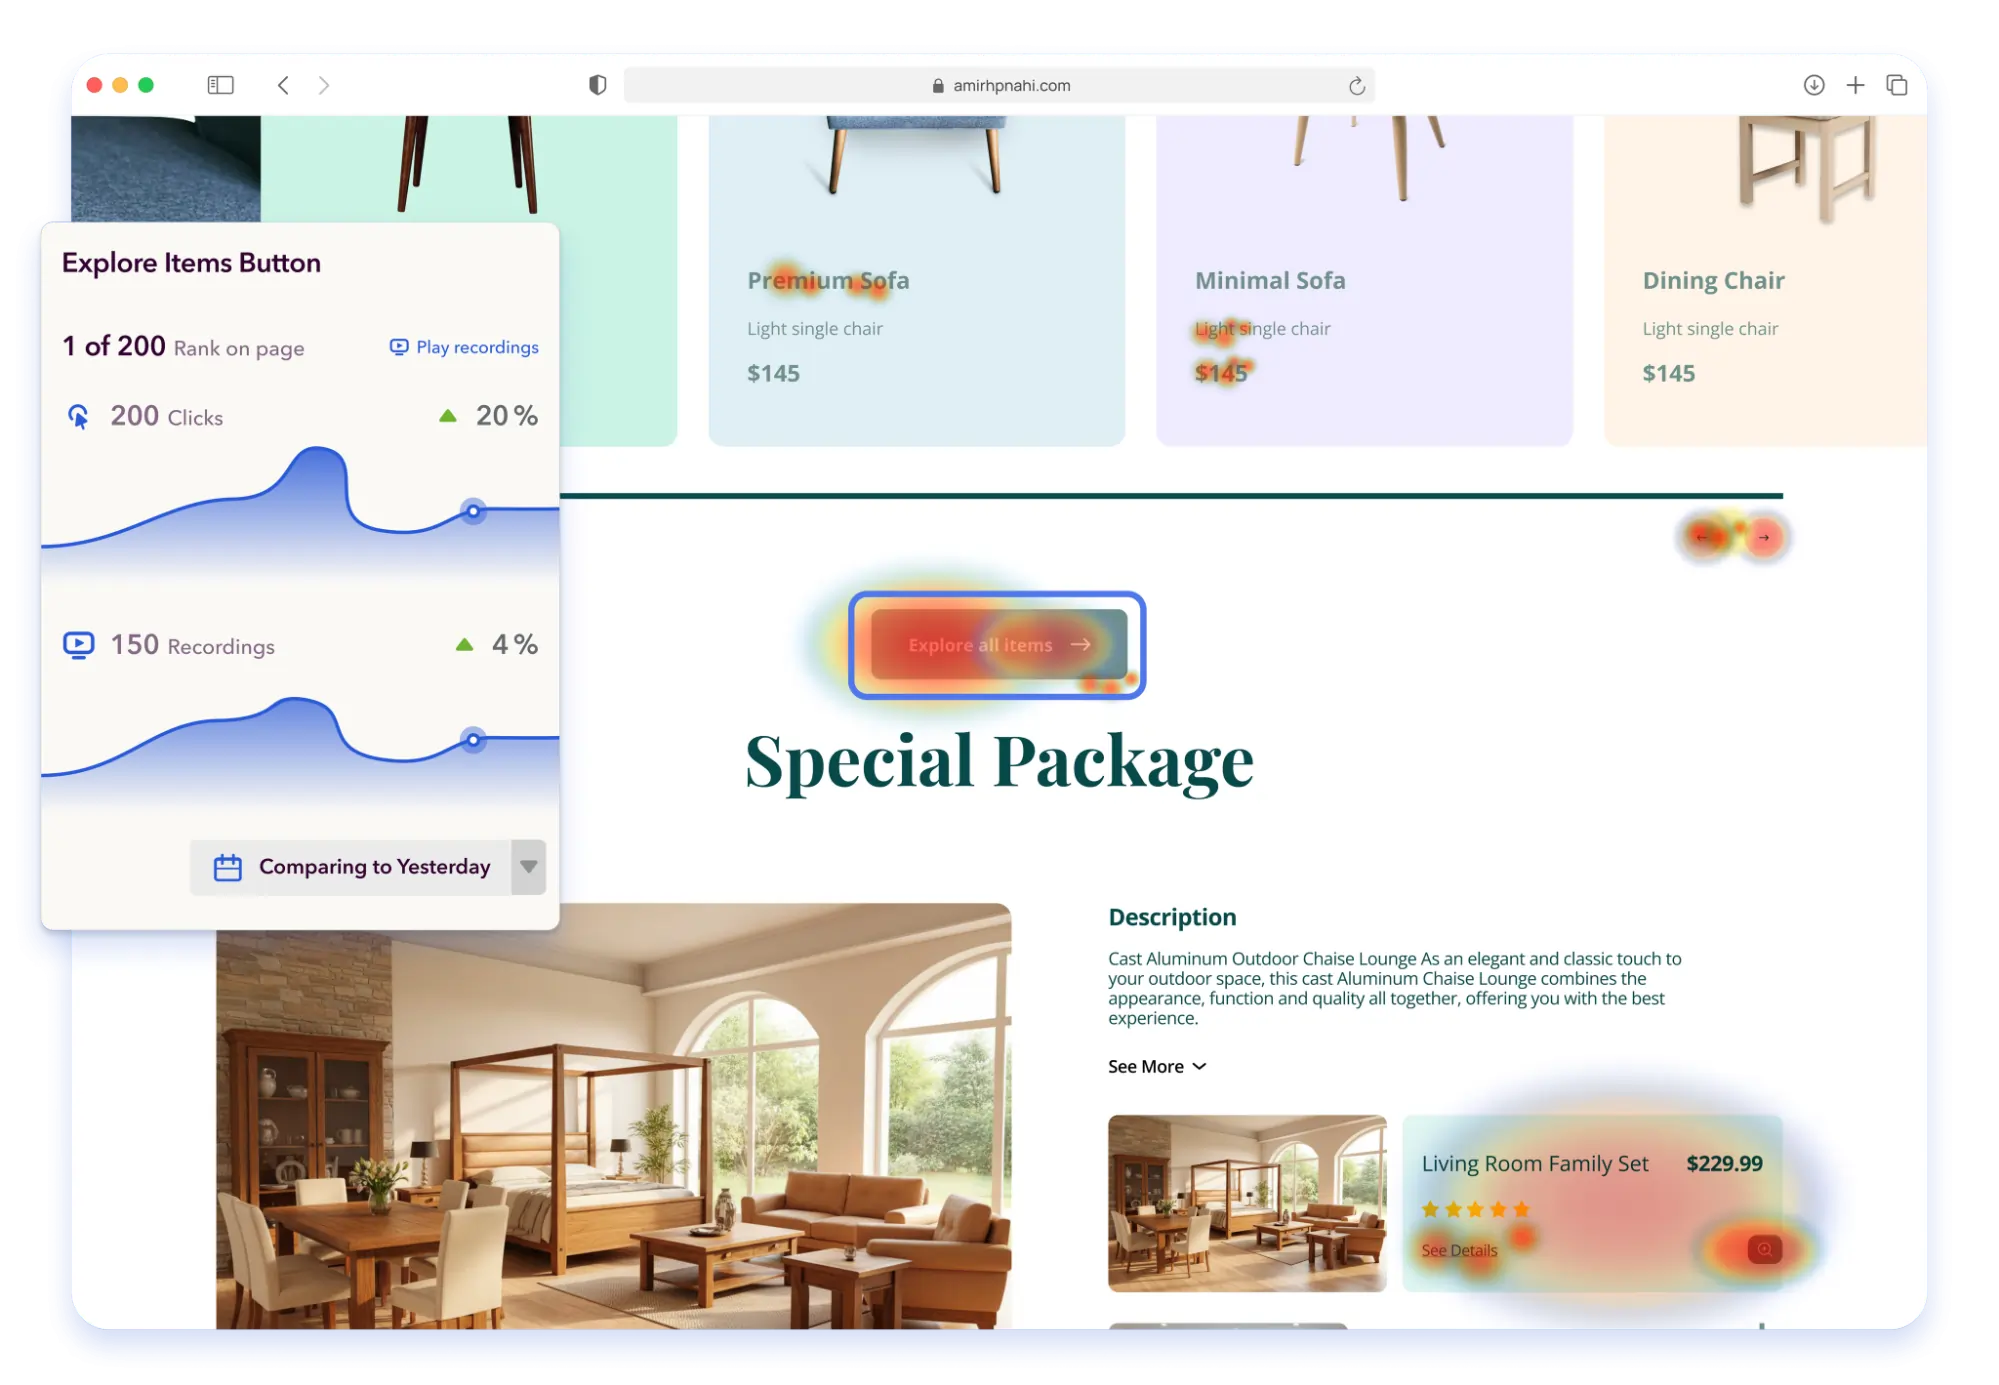
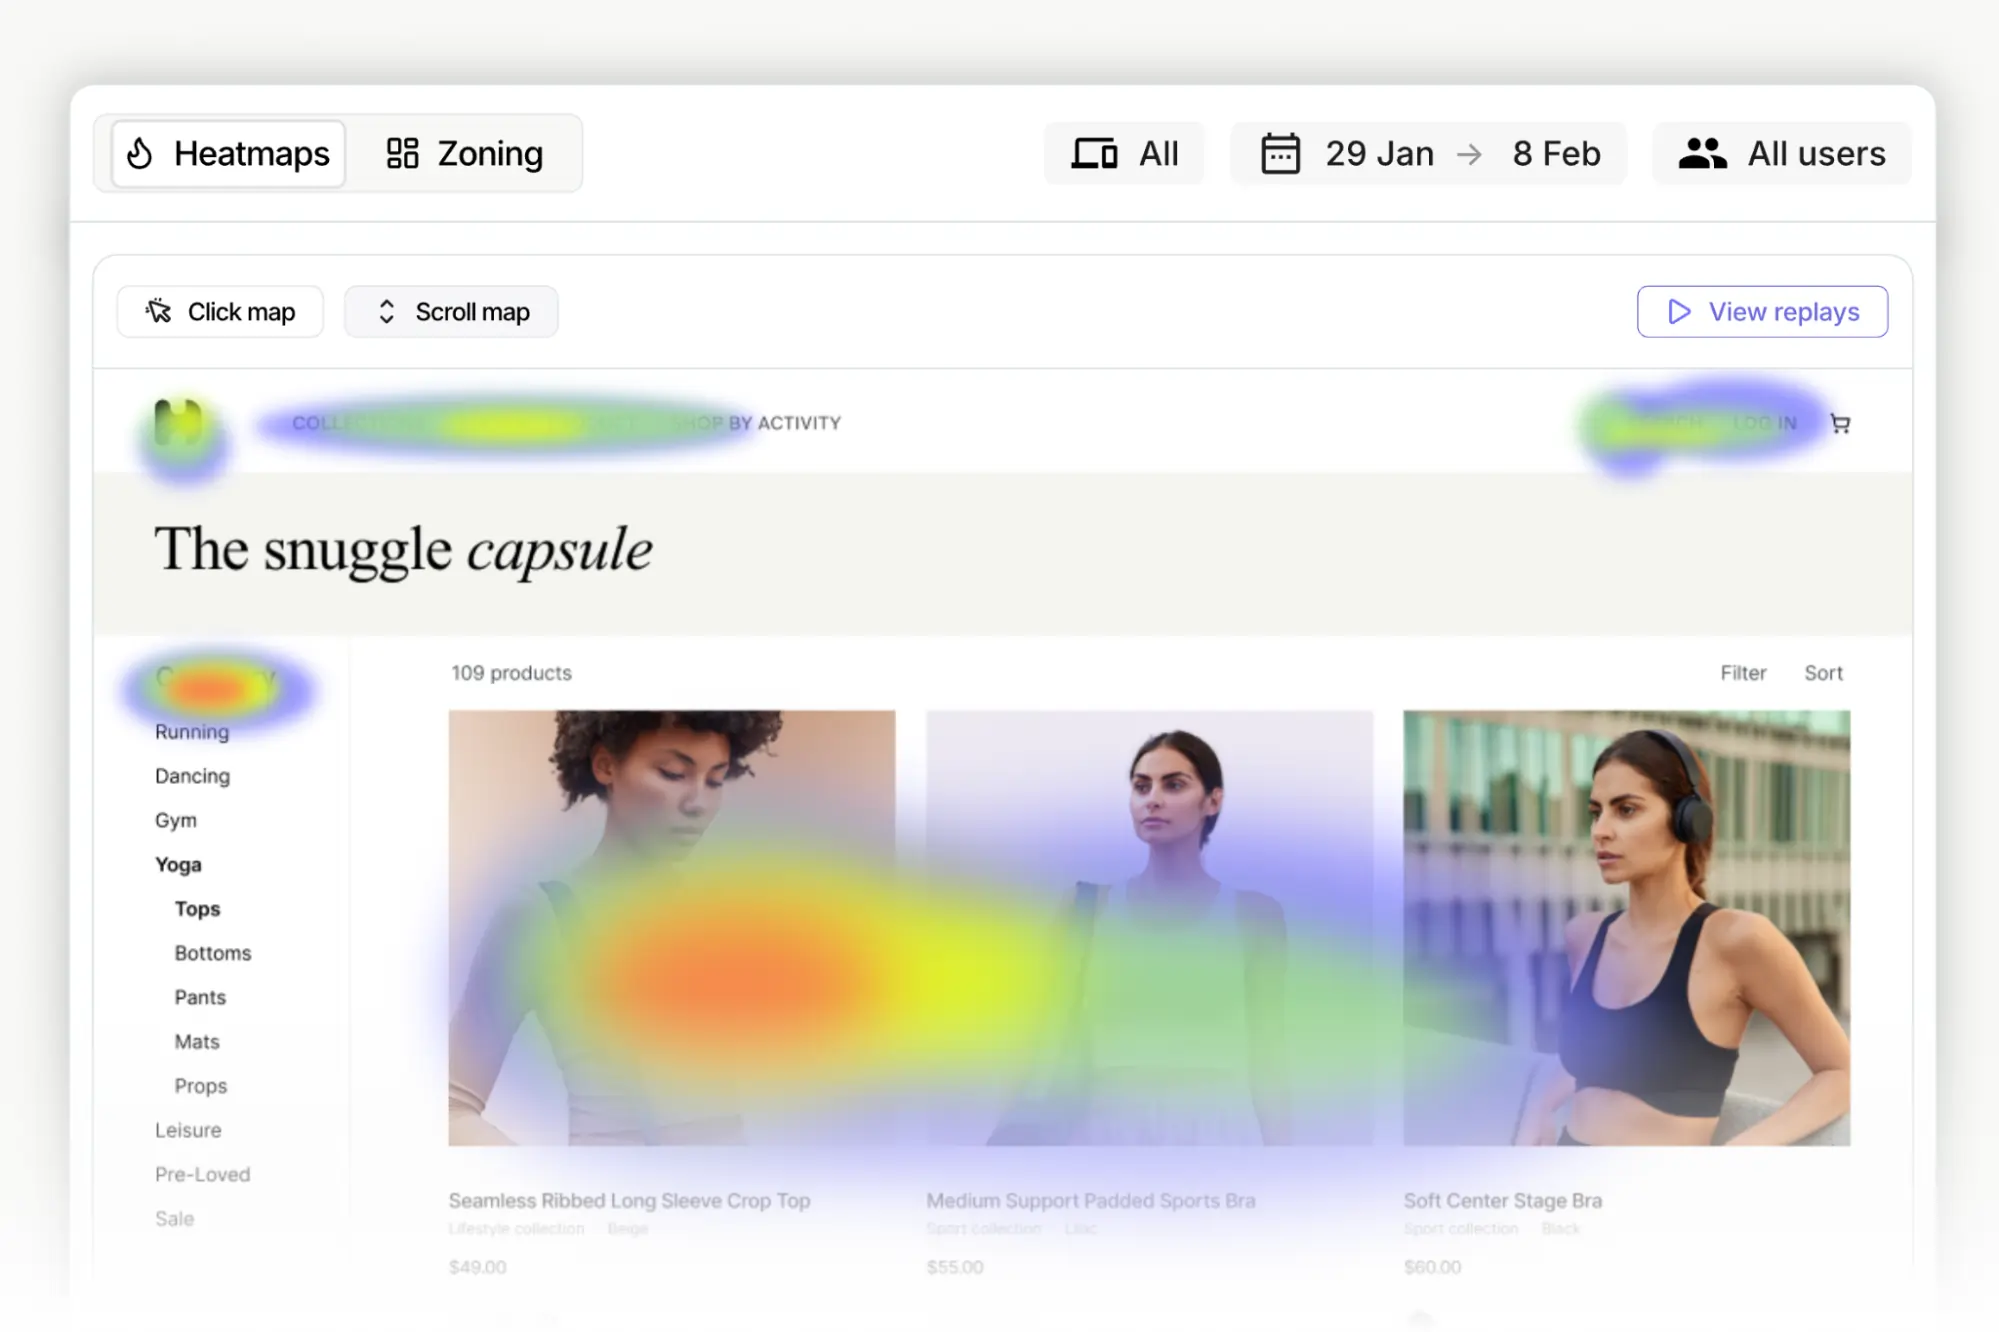
The core technology behind these tools involves lightweight JavaScript snippets that capture Document Object Model (DOM) interactions. By recording mouse coordinates, scroll depth, and element-level clicks, these platforms aggregate thousands of individual sessions into a color-coded "thermal" overlay. This visualization allows stakeholders to see "hot" areas of high engagement and "cold" zones where critical content is being ignored.
The 2025 Competitive Landscape: Top Heatmap Solutions
The current market is divided into three primary segments: enterprise-grade experience platforms, specialized optimization suites, and accessible tools for small-to-medium businesses (SMBs).
Enterprise-Level Experience Intelligence
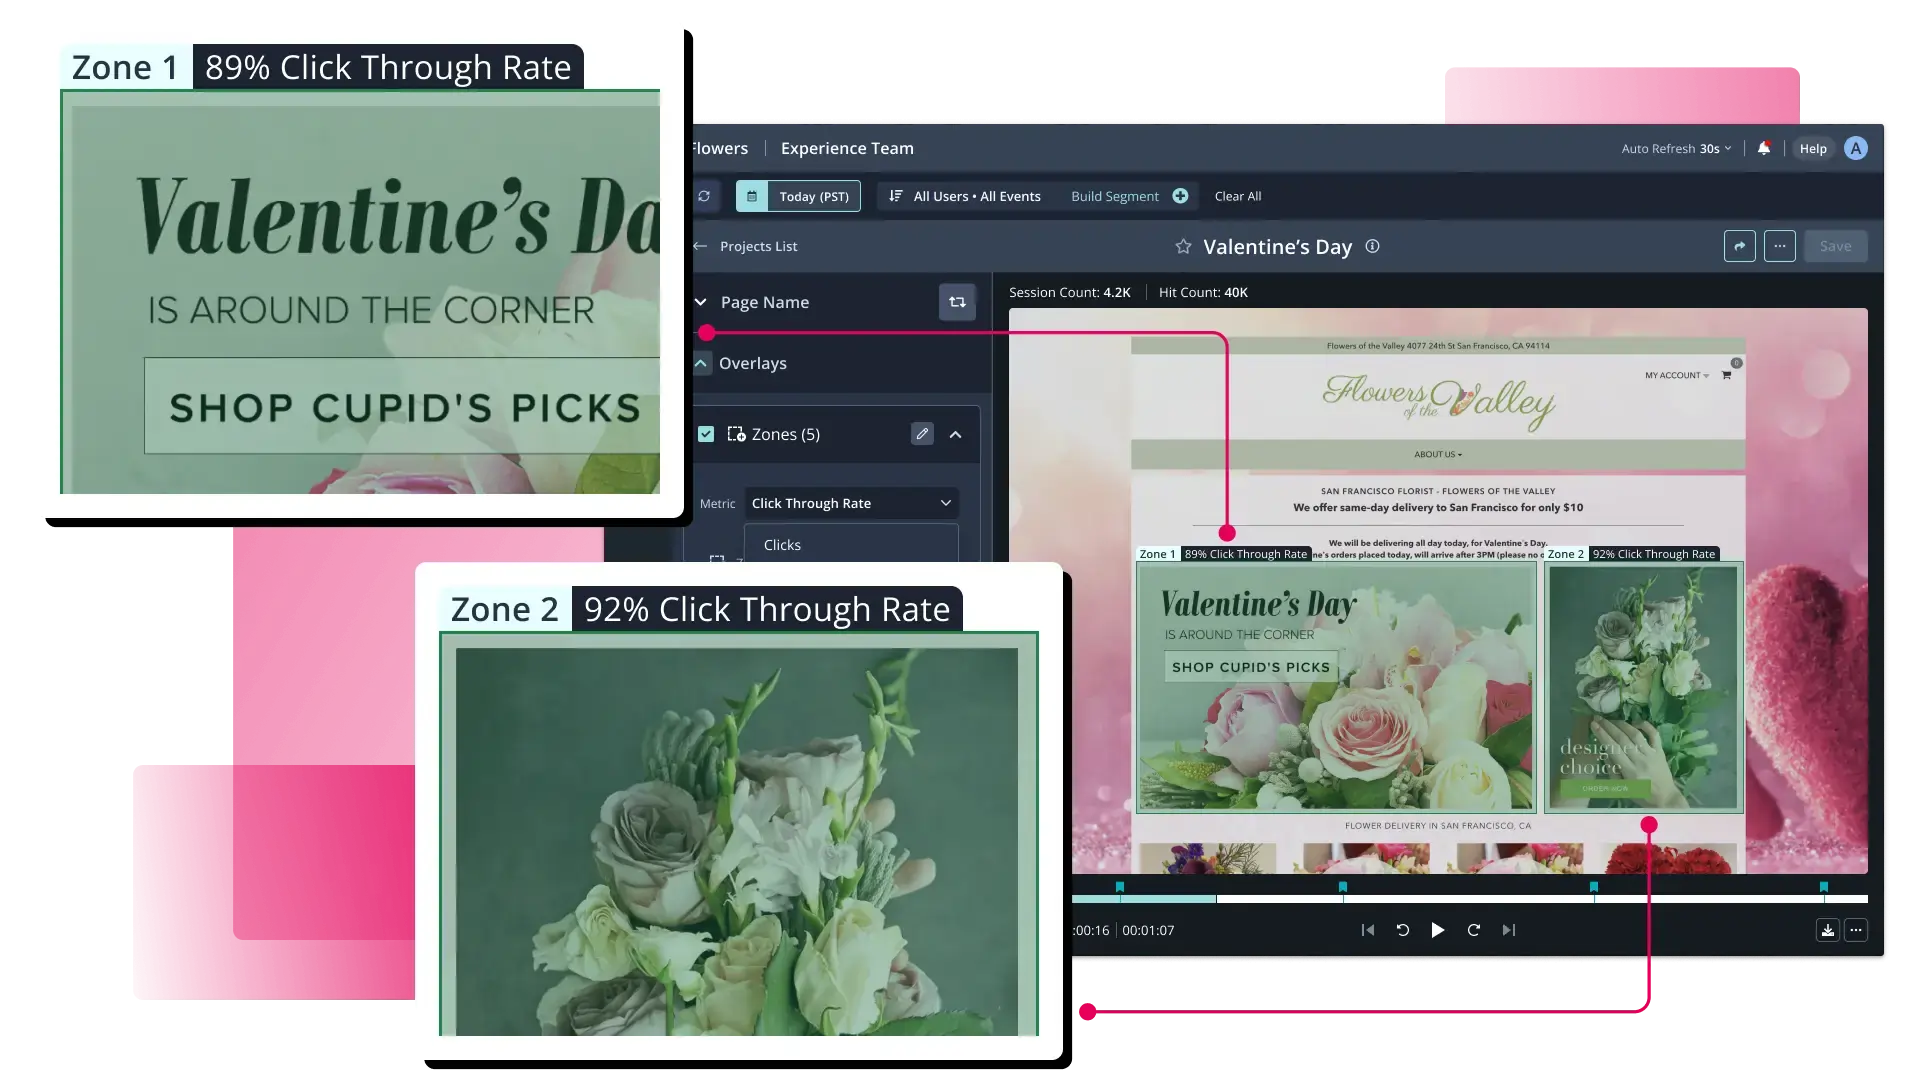
For large organizations managing complex digital ecosystems, platforms like Glassbox and Quantum Metric provide more than just visual overlays. Glassbox specializes in the analysis of complex conversion funnels, utilizing AI to highlight technical errors and UI friction in real-time. Similarly, Quantum Metric has introduced "Felix AI," a generative intelligence feature that summarizes user insights from thousands of session replays, allowing product managers to bypass manual footage review.
FullStory remains a dominant force in this category, offering a "no-code" analytics approach. Its primary value proposition lies in its ability to detect "frustration signals," such as rage clicks (repeatedly clicking a non-responsive element) and dead clicks, which are then quantified to show the potential revenue impact of fixing a specific UX flaw.
Integrated Optimization and A/B Testing Suites
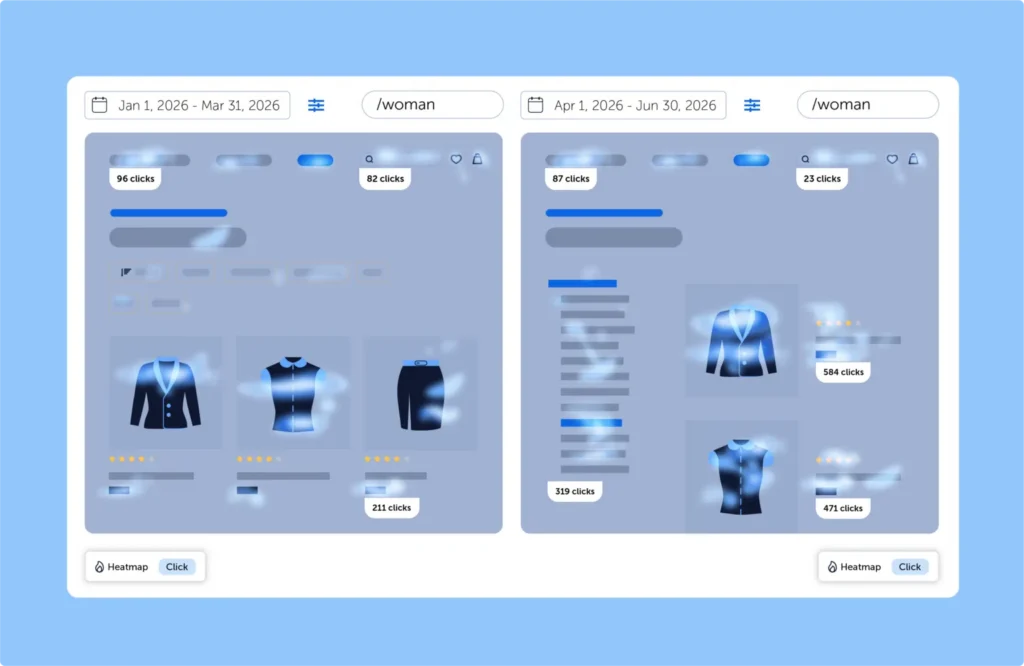
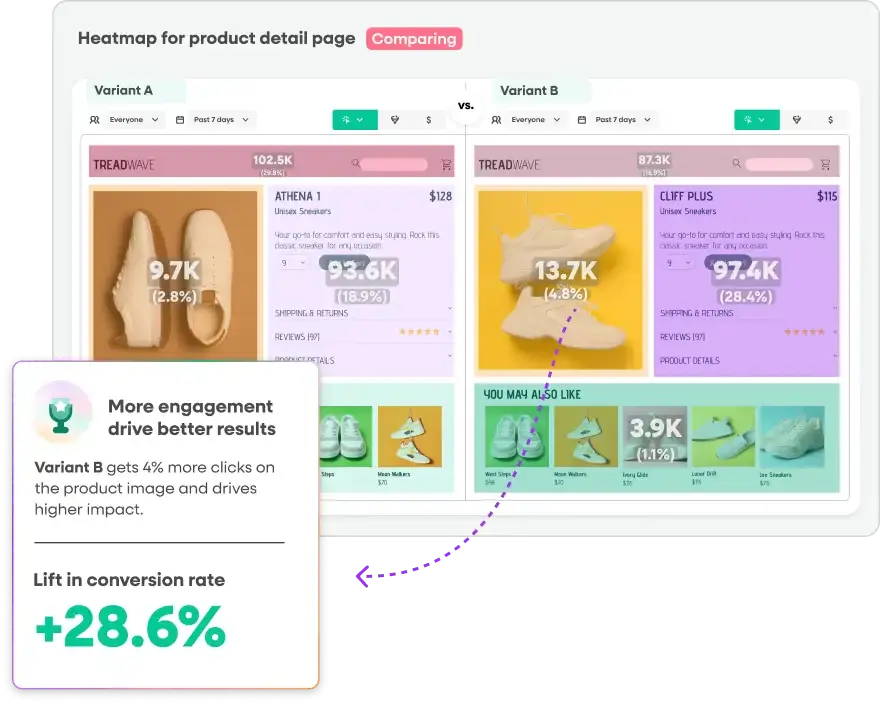
A growing trend in the industry is the consolidation of heatmapping and experimentation. Convert Experiences has positioned itself as a leader for conversion teams who require behavioral insights within their testing platform. By offering native heatmaps per experiment variation, it allows researchers to see exactly how user behavior changes between a control page and a new design variant.

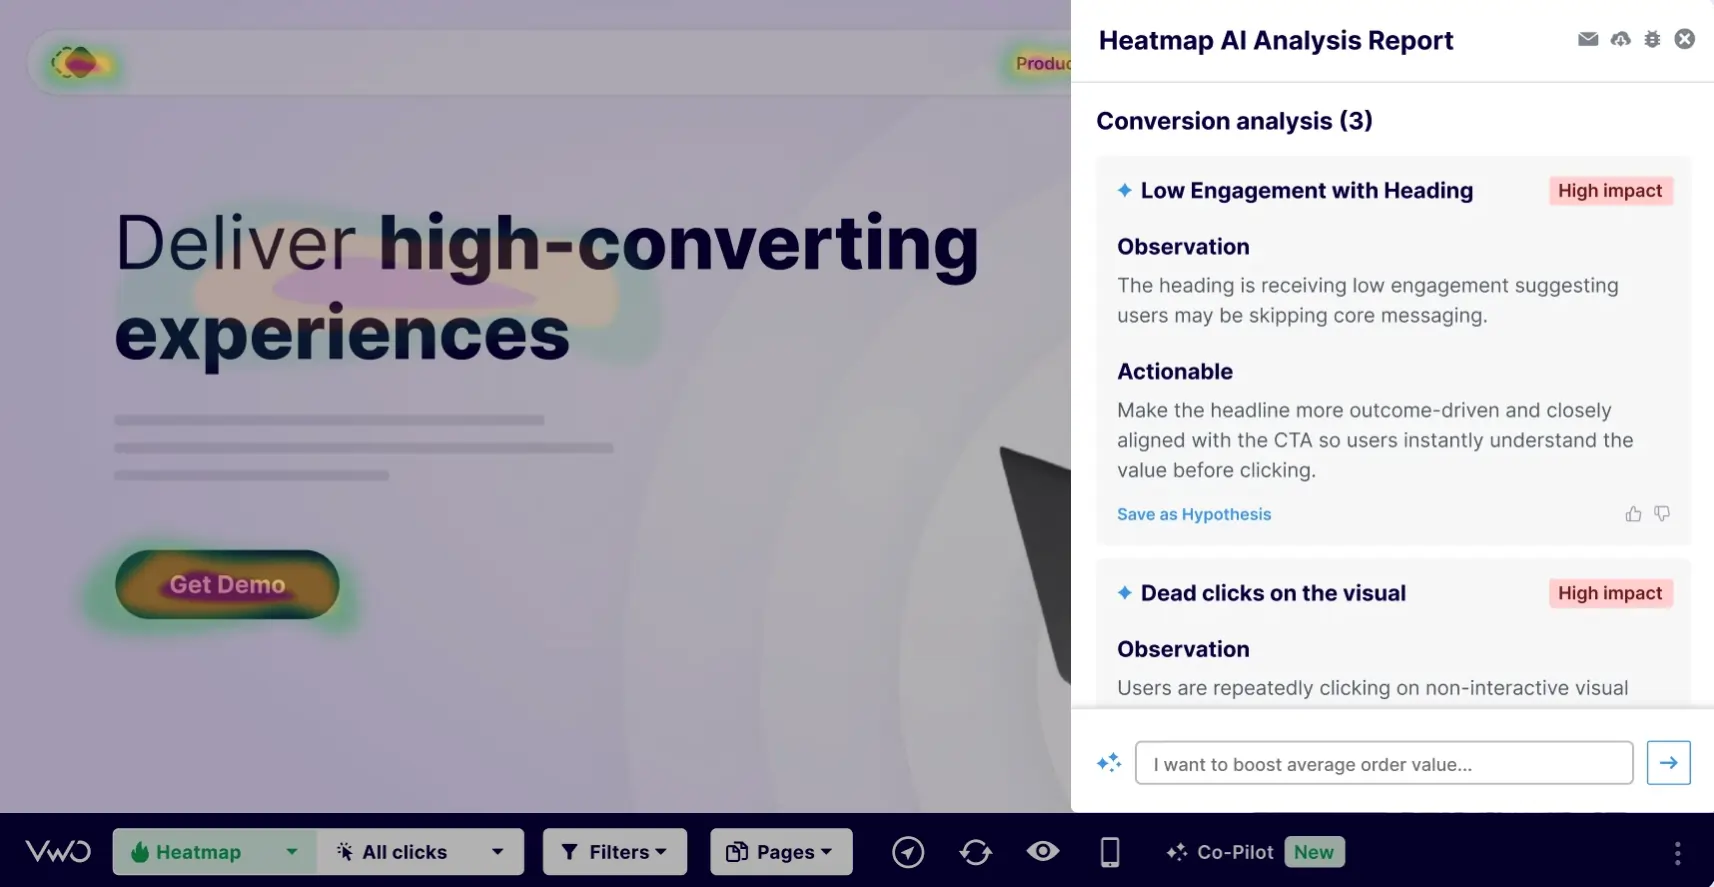
VWO Insights and Contentsquare (which officially integrated the popular tool Hotjar into its group as of July 2025) follow a similar philosophy. These tools provide a "full-stack" approach, combining heatmaps with session recordings, form analytics, and voice-of-customer (VoC) surveys. The July 2025 merger of Hotjar’s features into the Contentsquare platform marks a pivotal moment in the industry, signaling a shift toward unified "all-in-one" experience monitoring.
Specialized and Revenue-Focused Tools
Some platforms have carved out niches by focusing on specific business models. Heatmap.com, for instance, differentiates itself by attributing revenue directly to on-page elements. Instead of simply showing where users click, it calculates "Revenue Per Session" (RPS) for specific buttons and sections, making it a favorite for Direct-to-Consumer (DTC) and e-commerce brands.
Instapage focuses on post-click optimization for ad campaigns, integrating heatmaps directly into its landing page builder. This allows performance marketers to optimize their advertising spend by seeing how traffic from specific sources interacts with promotional pages.
High-Accessibility and Free Solutions
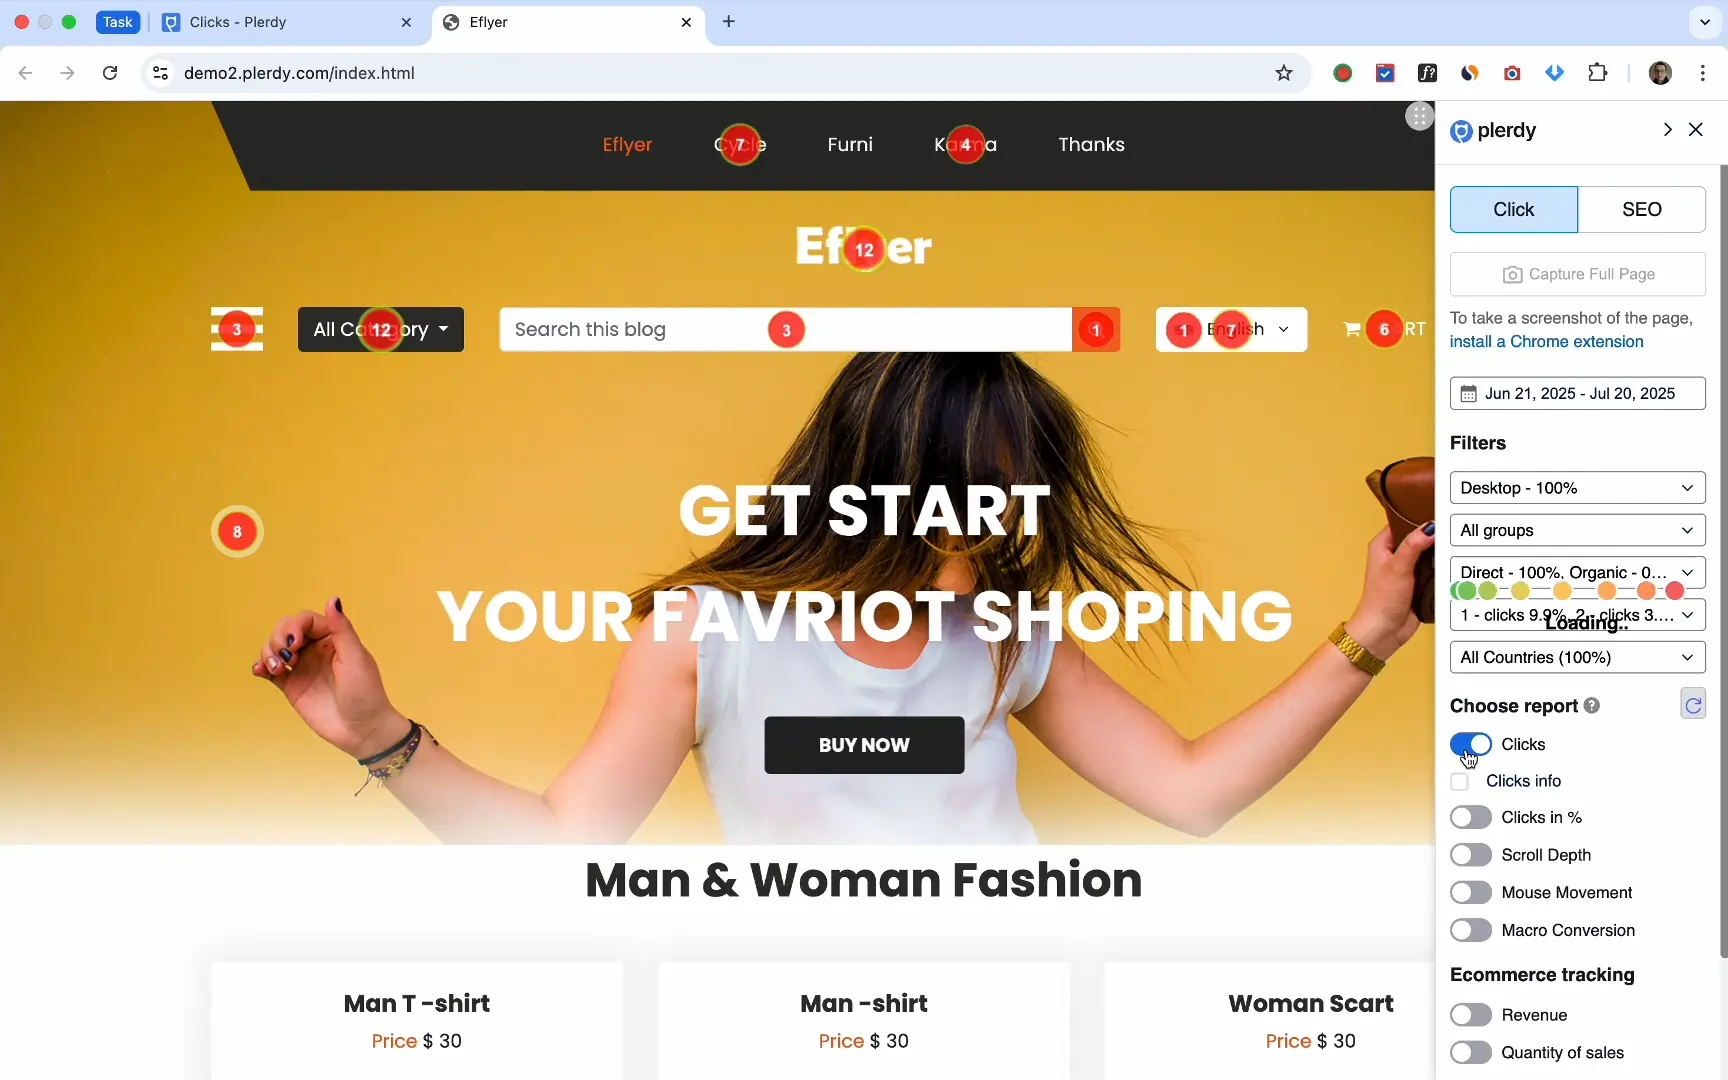
The entry of Microsoft Clarity into the market disrupted the traditional pricing models of behavioral analytics. By offering a free, "forever" plan with unlimited traffic tracking, Clarity has become the go-to solution for startups and SMBs. Despite being free, it includes robust features such as rage-click detection and Google Analytics integration. Other tools like Mouseflow, Plerdy, and Lucky Orange offer competitive entry-level pricing, often starting between $20 and $40 per month, providing a middle ground for businesses that need more support than a free tool but aren’t ready for enterprise contracts.
Comparative Data: Pricing and Feature Overview
To assist in the selection process, the following data summarizes the current market offerings as of mid-2025:
| Product | Starting Price (Annual) | Key Feature Set | Target Audience |
|---|---|---|---|
| Convert Experiences | $299/mo | Native heatmaps per variation, frustration detection | Experimentation teams |
| Microsoft Clarity | Free | Rage click detection, GA integration | Budget-conscious SMBs |
| Glassbox | Custom | Technical error detection, journey mapping | Enterprise UX researchers |
| Heatmap.com | $20/mo | Revenue-based element attribution | E-commerce/DTC brands |
| Lucky Orange | $32/mo | Dynamic heatmaps, AI discovery, surveys | Product page optimization |
| Crazy Egg | $29/mo | Snapshot reporting, segmented click analysis | Small e-commerce teams |
Technical Chronology: From Click Tracking to AI Detection
The timeline of heatmapping development reflects the broader evolution of the web:
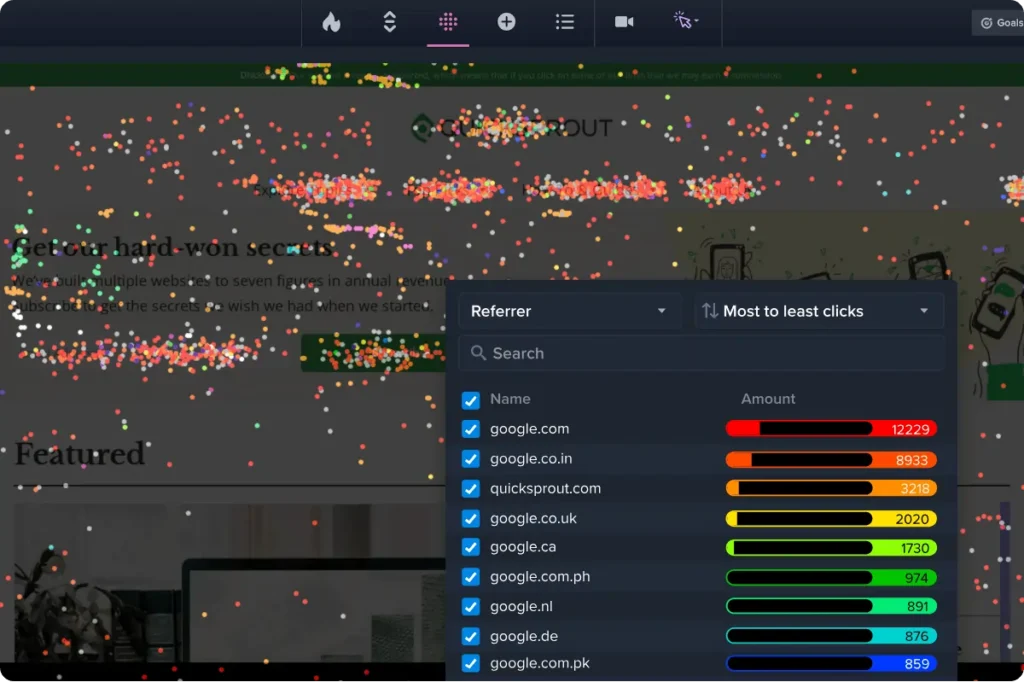
- 2005–2010: The era of "Static Snapshots." Tools like Crazy Egg pioneered the visualization of clicks on static images of webpages.
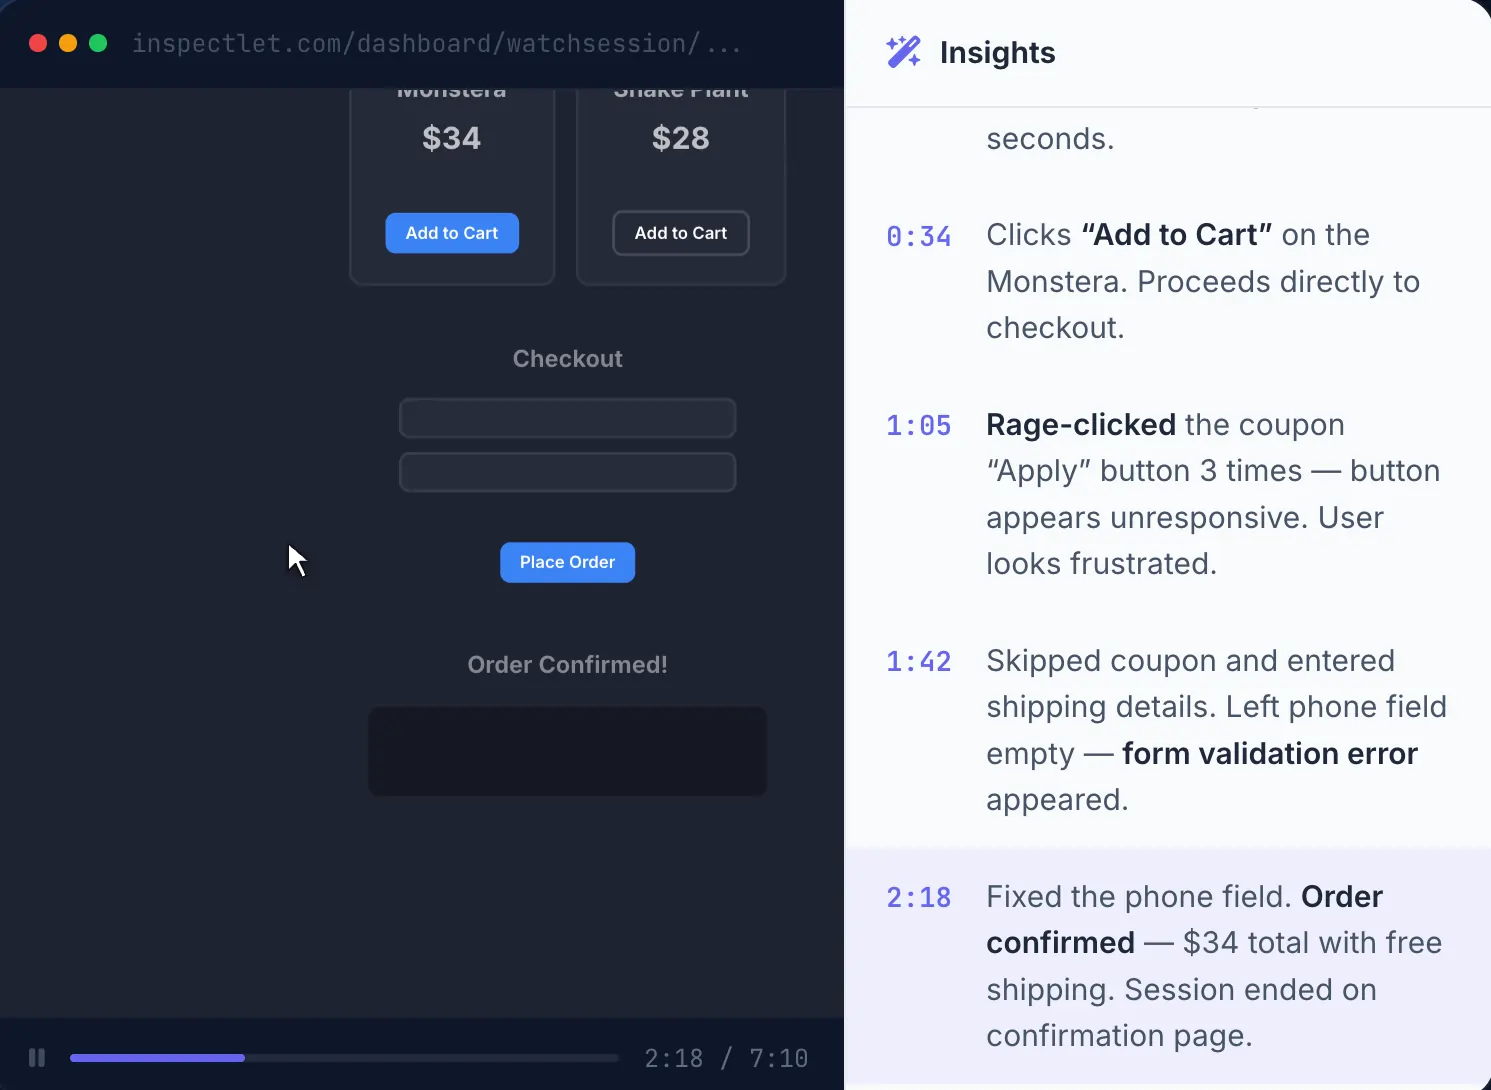
- 2011–2017: The rise of "Dynamic Heatmapping." As websites moved toward JavaScript-heavy frameworks (AJAX, SPAs), tools like Inspectlet and Hotjar developed methods to render heatmaps within iframes to account for moving elements.
- 2018–2023: The "Frustration Detection" phase. Platforms began using machine learning to identify behavioral patterns like "mouse thrashing" or "scrolling stalls."
- 2024–Present: The "AI & Revenue Attribution" era. Current leaders are integrating LLMs to summarize findings and connecting behavioral data directly to financial outcomes (RPS).
Industry Implications and Economic Impact
The adoption of heatmap tools is no longer optional for competitive digital enterprises. Industry data suggests that even minor friction in the user journey can have outsized financial consequences. According to research from the Aberdeen Group, a one-second delay in page load time can result in a 7% reduction in conversions. Heatmap tools allow teams to see the visual manifestation of these delays—such as users abandoning a page before the "Buy" button renders.
Furthermore, the shift toward privacy-first browsing (the deprecation of third-party cookies) has made first-party behavioral data more valuable. Since heatmaps rely on first-party interaction data on a company’s own domain, they provide a compliant way to understand user intent without infringing on cross-site privacy boundaries.
Official Responses and Expert Analysis
Market analysts suggest that the "tool sprawl" within marketing departments is leading to a preference for integrated solutions. "The market is moving away from standalone heatmapping," says a lead analyst in the CRO space. "Organizations now want their behavioral data to sit directly alongside their A/B testing and their revenue data. The integration of Hotjar into Contentsquare is a primary example of this consolidation."

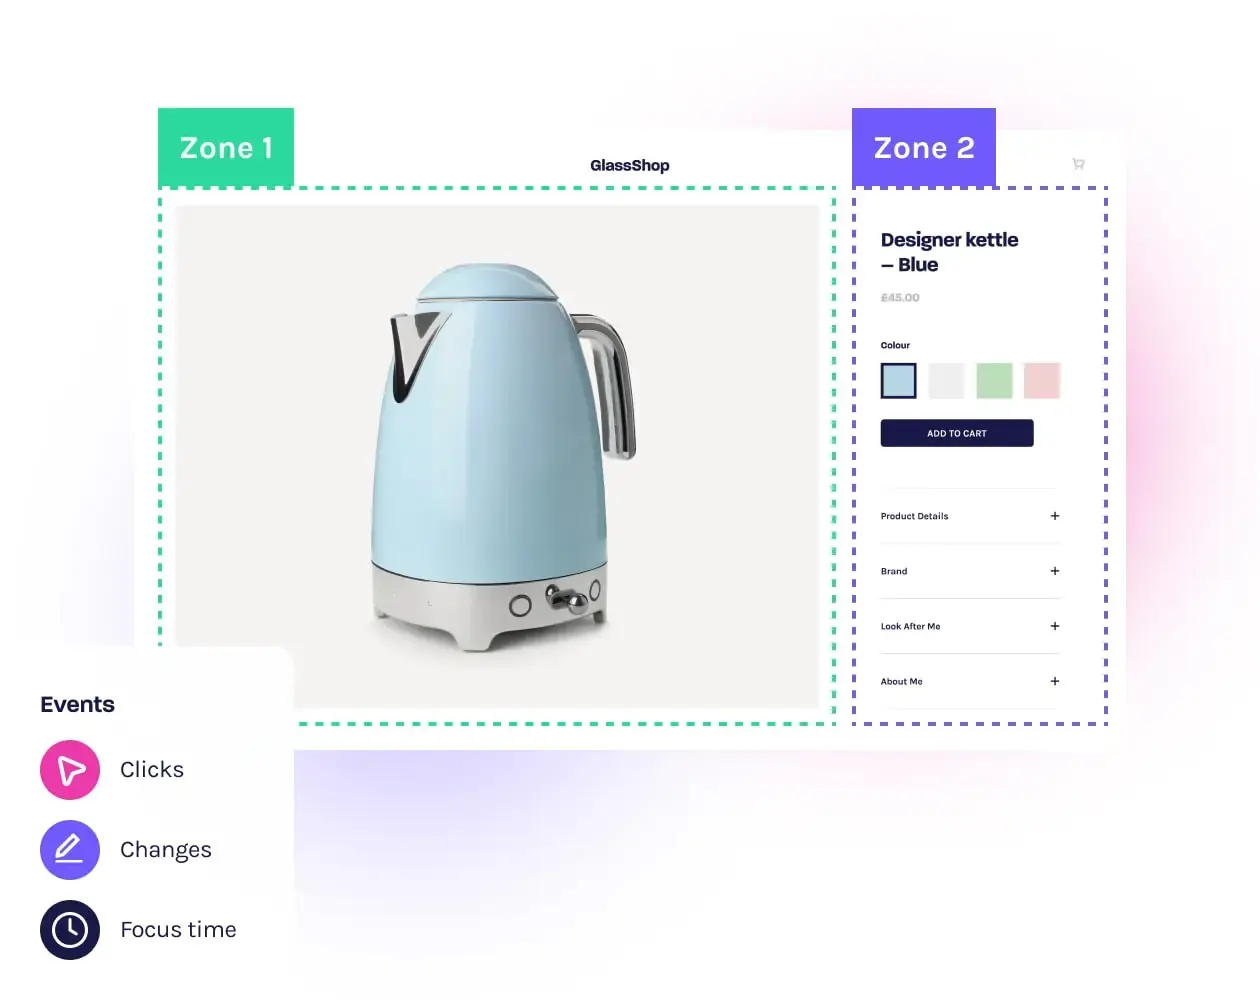
Experts also highlight the importance of "Element-Level Analysis." Unlike early heatmaps that just showed "blobs" of color, modern tools like Inspectlet allow researchers to see the exact click count for every individual ID or class in the CSS, providing the granular detail needed for modern web development.

Conclusion: Strategic Selection for 2025
Choosing a heatmap tool in 2025 requires a balance of technical capability, scalability, and budgetary alignment. For enterprise organizations, the focus remains on AI-driven efficiency and technical error detection. For growth-stage companies, the priority is often the integration of behavioral insights with experimentation tools like Convert Experiences to ensure that every design change is backed by visual evidence.

Ultimately, heatmapping software has transcended its role as a simple visualization tool to become a vital component of the digital "truth" stack. By transforming abstract clicks into visual stories, these tools empower businesses to build more intuitive, frictionless, and high-converting digital experiences. As the market continues to consolidate and AI capabilities expand, the ability to interpret and act on visual behavioral data will remain a primary differentiator between digital leaders and laggards.







