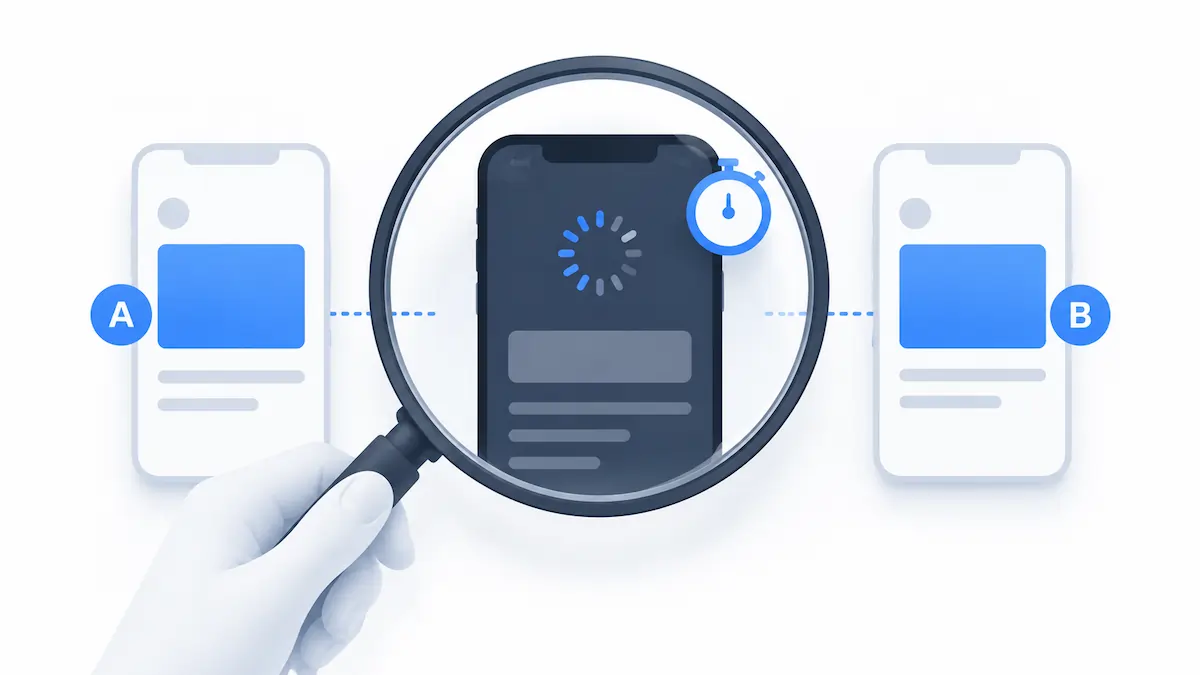
The persistent challenge of data reconciliation remains one of the most significant hurdles for digital marketers and conversion rate optimization (CRO) specialists. When conducting A/B tests, practitioners frequently observe that the metrics reported by their testing tools—such as Convert Experiences, VWO, or Optimizely—rarely align perfectly with the figures recorded in Google Analytics 4 (GA4). While minor variances are often dismissed as statistical noise, significant discrepancies can undermine the integrity of an entire optimization program, leading stakeholders to question which platform serves as the “source of truth.”
Recent research into these discrepancies suggests that the root causes are rarely found in simple configuration errors. Instead, the gap is often the result of fundamental differences in how tracking scripts interact with browser resources, network latency, and device performance. Understanding these technical nuances is essential for any organization that relies on data-driven decision-making to drive revenue and user experience improvements.
The Evolution of Web Tracking: From Universal Analytics to GA4
To understand the current state of data mismatch, one must first consider the historical context of web analytics. For over a decade, Universal Analytics (UA) served as the industry standard, utilizing a session-based model that was relatively predictable. However, the transition to Google Analytics 4 introduced an event-based tracking model designed to prioritize user privacy and cross-platform journeys.
GA4’s architecture is built to be “asynchronous” by design. This means that the tracking code is instructed to wait for the browser to have available resources before firing. While this approach is beneficial for a website’s perceived performance and Core Web Vitals, it introduces a level of fragility in data collection. If a user has a poor connection or a low-powered device, the “event” may be queued but never actually transmitted to Google’s servers before the user navigates away or closes the tab.
In contrast, A/B testing tools often require “synchronous” execution. To prevent the “flicker effect”—where a user briefly sees the original version of a page before the variation loads—the testing script must fire immediately in the document’s <head> tag. This fundamental difference in execution timing creates a natural window for data to diverge.
The Network Latency Factor: A Global Perspective on Connectivity
While many developers work on high-speed fiber connections, a significant portion of the global web-browsing population operates under suboptimal network conditions. Data from 2024 and 2025 highlights a surprising reality: even in technologically advanced markets like the United States, cellular demand and infrastructure limitations persist.
According to reports from RCR Wireless and Opensignal, while 5G marketing is ubiquitous, only about 50% of active connections in the U.S. were consistently on 5G networks as of late 2024. The remainder of users rely on LTE (4G) or even 3G in rural or congested urban areas. Furthermore, “being on 5G” does not guarantee high-speed data transfer; signal congestion in public spaces like coffee shops, hotels, or transit hubs often reduces effective speeds to 4G levels or lower.
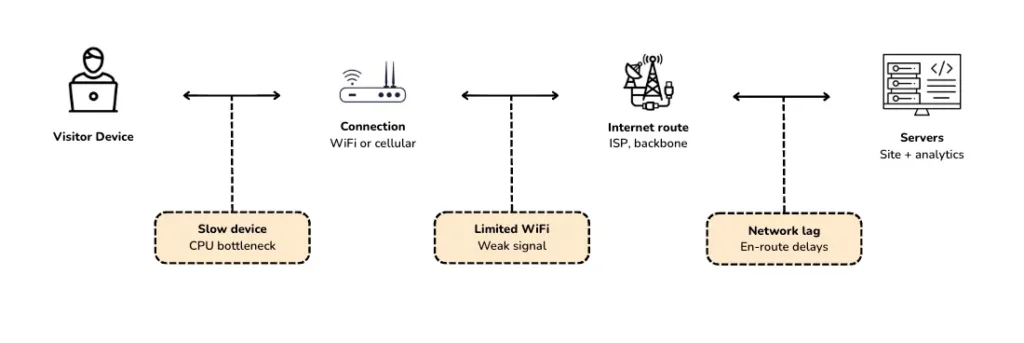
These network impact points are critical. When a visitor with a slow connection hits a landing page, the synchronous A/B testing script logs their presence almost instantly. However, the GA4 beacon, which is lower in the priority queue, may experience a delay. If the network is congested, the analytics beacon may be partially delivered, delayed by several seconds, or dropped entirely.
The 20-Second Bottleneck: A Chronology of a Lost Session
In a two-year longitudinal study conducted by technical analysts at Convert, researchers tracked the behavior of GA4 events under simulated “slow network” conditions (3G and throttled 4G). The findings revealed a specific pattern of data loss that is largely undocumented in official Google support literature.
The study followed a specific chronology of events during a typical user visit on a slow device:
- 0-2 Seconds: The user clicks a link. The browser begins fetching the HTML. The A/B testing script, located in the
<head>, executes and buckets the user into a variation. - 5-10 Seconds: The page becomes visually readable, but the browser is still busy processing CSS and primary JavaScript.
- 15-20 Seconds: On a slow connection, the GA4 “page_view” event finally attempts to fire.
- The Departure: If the user finds the information they need or becomes frustrated and leaves the site before the 20-second mark, the A/B testing tool has recorded a “Visitor,” but GA4 has recorded nothing.
This “20-second delay” is the primary driver of the gap between testing platforms and analytics. It creates a segment of “ghost visitors” who exist in the testing data but are invisible to the primary analytics suite.

Identifying the “Signature” of Data Loss
Data analysts have identified a specific “funnel shape” that indicates when network conditions are the culprit for a mismatch. If data loss were random—caused by things like ad blockers or cookie rejections—the discrepancy would likely be uniform across the entire conversion funnel. For example, if there were a 10% gap in total visitors, there would also be a 10% gap in “add-to-cart” events and “purchases.”
However, research shows that in network-driven loss, the gaps are most pronounced at the very top and very bottom of the funnel. The middle of the funnel often appears remarkably consistent between the two tools.
This occurs because GA4 ties every event to a session, and every session is anchored by the initial page_view. If that first event fails to fire, none of the subsequent events from that user are recorded. Conversely, visitors who stay on the site long enough to reach the middle of the funnel (such as viewing a product detail page) have, by definition, already cleared the initial loading bottleneck. Therefore, their downstream events are recorded accurately by both systems. This “frayed ends” signature is a definitive signal that technical performance, rather than configuration error, is the primary cause of the discrepancy.
The Conflict Between SEO and Data Accuracy
A significant complicating factor in modern web development is the push for optimized Core Web Vitals (CWV). Google’s search algorithms reward sites that load quickly and efficiently. To achieve high scores in metrics like Largest Contentful Paint (LCP) and First Input Delay (FID), many developers use Google Tag Manager (GTM) to fire tags on the “Window Loaded” trigger rather than the “Page View” trigger.

While this practice improves a site’s performance score, it exacerbates the data mismatch. By waiting until the entire window has loaded before firing GA4, the site effectively doubles the risk of missing a session from a visitor on a slow network. Analysts are increasingly warning that the trade-off for a slightly better SEO score may be a significant loss in the reliability of the data used to make business decisions.
A Framework for Diagnostic Action
When an organization identifies a discrepancy exceeding the industry-standard 5% to 10% threshold, a systematic diagnostic approach is required. Experts recommend the following seven-step framework to isolate the cause:
1. Metric Alignment
The most common error is comparing “Sessions” in GA4 to “Visitors” in a testing tool. Convert and other platforms count unique individuals, whereas GA4 Sessions can count the same person multiple times if they return after 30 minutes of inactivity. Analysts must ensure they are comparing “Users” to “Visitors” to achieve an apples-to-apples comparison.
2. Segmented Integration
Organizations should utilize GA4’s audience building features to isolate only those users who were exposed to a specific experiment. Without this segmentation, the comparison includes the entire site’s traffic, making it impossible to identify experiment-specific drift.

3. Temporal Consistency
GA4 can take up to 72 hours to fully process and populate data. Comparing day-by-day results in real-time is prone to “processing noise.” Analysts should wait for the data to settle and compare week-over-week trends rather than daily fluctuations.
4. Device and Network Segmentation
By filtering reports by device category (Desktop vs. Mobile), analysts can often see the network condition theory in action. If the gap is negligible on desktop but substantial on mobile, the issue is almost certainly related to network latency and mobile device processing power.
5. Script Placement Audit
The physical order of code in the website’s HTML is paramount. A/B testing scripts must be placed as high as possible in the <head>. If the testing script is placed below the GA4 tag or loaded through a container that delays its execution, the risk of data misalignment increases.
6. Funnel Disparity Analysis
As previously noted, checking the percentage gap at each stage of the conversion funnel allows analysts to determine if the loss is concentrated at the point of entry. This is the “cleanest signal” for diagnosing network-related loss.

7. Server-Side Verification
For high-stakes experiments, cross-referencing client-side data with server-side logs or CRM records provides a third-party perspective. Server-side data does not rely on browser execution, making it the ultimate arbiter of whether a conversion actually occurred.
Implications for the Industry
The realization that data will never perfectly match has profound implications for how organizations calculate ROI and set KPIs. If GA4 is consistently undercounting visitors on slow connections, it may be inadvertently underreporting the conversion rate of mobile users. This can lead to a “false negative” in A/B testing, where a variation that actually performs well on mobile appears to be failing because its most successful interactions weren’t captured by the analytics suite.
Industry experts suggest that rather than chasing 100% accuracy, the goal should be “directional confidence.” If both the testing tool and the analytics suite show the same variation as the winner, the business can move forward with confidence. If they disagree, it is a signal that the test result is within the “margin of technical error” and may require a longer run-time or a larger sample size.
Ultimately, the gap between GA4 and A/B testing tools is a reflection of the diverse and often fragmented nature of the modern internet. As long as there are variations in device power, network speed, and browser behavior, data discrepancies will remain a permanent fixture of the digital landscape. The most successful organizations will be those that stop fighting the mismatch and start understanding the patterns within it.