

Conversion Rate Optimization (CRO) Key Performance Indicators (KPIs) represent the fundamental metrics utilized by organizations to quantify the efficacy of website modifications and their subsequent impact on overarching business objectives. In an era where digital acquisition costs continue to escalate, the ability to discern whether a UI/UX adjustment, a simplified form, or a headline variation translates into tangible revenue is paramount. CRO KPIs provide the empirical evidence required to validate these changes, moving beyond vanity metrics to focus on outcomes such as purchase volume, lead quality, and demo bookings.
To function effectively, a CRO KPI must adhere to a specific standard of utility. It should be directly aligned with high-level business goals, offer actionable insights that dictate future testing iterations, and remain sensitive enough to reflect changes in user behavior accurately. Without these three pillars, data remains descriptive rather than prescriptive.
The Critical Distinction: CRO Metrics vs. CRO KPIs
A common pitfall in digital marketing is the conflation of general metrics with strategic KPIs. While every KPI is a metric, not every metric qualifies as a KPI. Digital platforms allow for the tracking of an exhaustive array of data points, including scroll depth, click-through rates, pageviews, and “add-to-cart” actions. These are diagnostic metrics—they describe how a visitor interacts with a site but do not necessarily indicate business success.
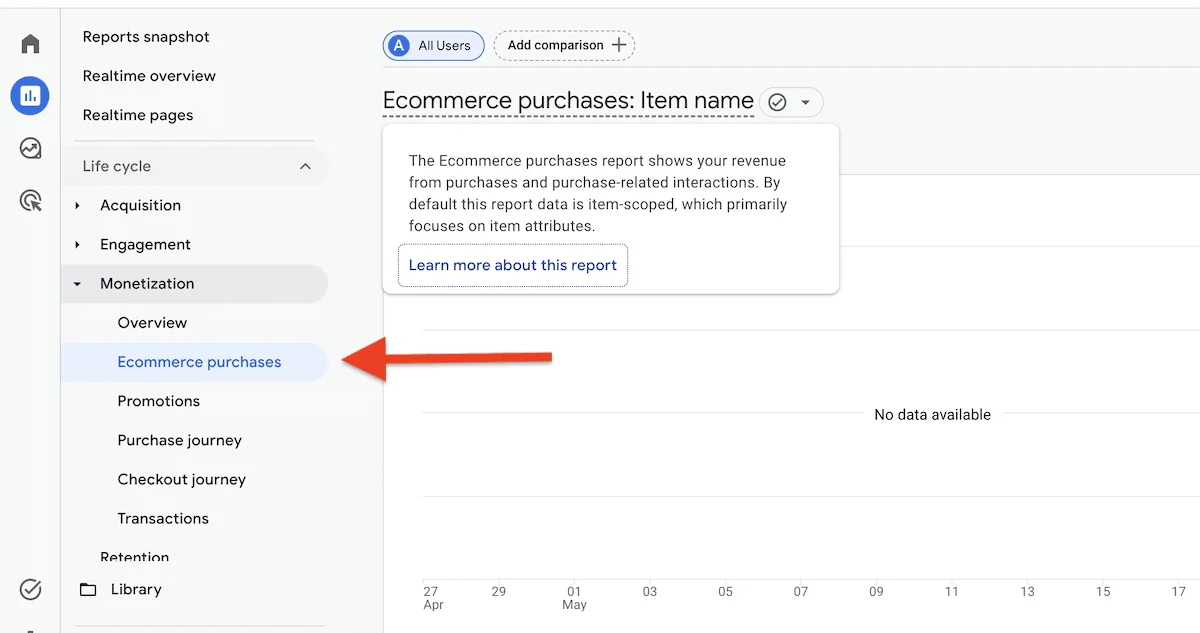
Conversely, a KPI is a selective metric used to judge whether a site is improving a specific business outcome. For instance, if an organization’s primary goal is revenue growth, the relevant KPIs would include purchase conversion rate, revenue per visitor (RPV), and average order value (AOV). If the objective is SaaS expansion, the focus shifts to trial activation rates and trial-to-paid conversion percentages.
The distinction is best understood through the lens of intent. Metrics help practitioners spot behavioral trends, such as where users drop off in a funnel or which elements they ignore. KPIs help executives and stakeholders measure the finality of an experiment—did the redesign result in more qualified leads or higher revenue? Metrics diagnose problems; KPIs judge solutions.
The Evolution of Tracking: From Universal Analytics to GA4
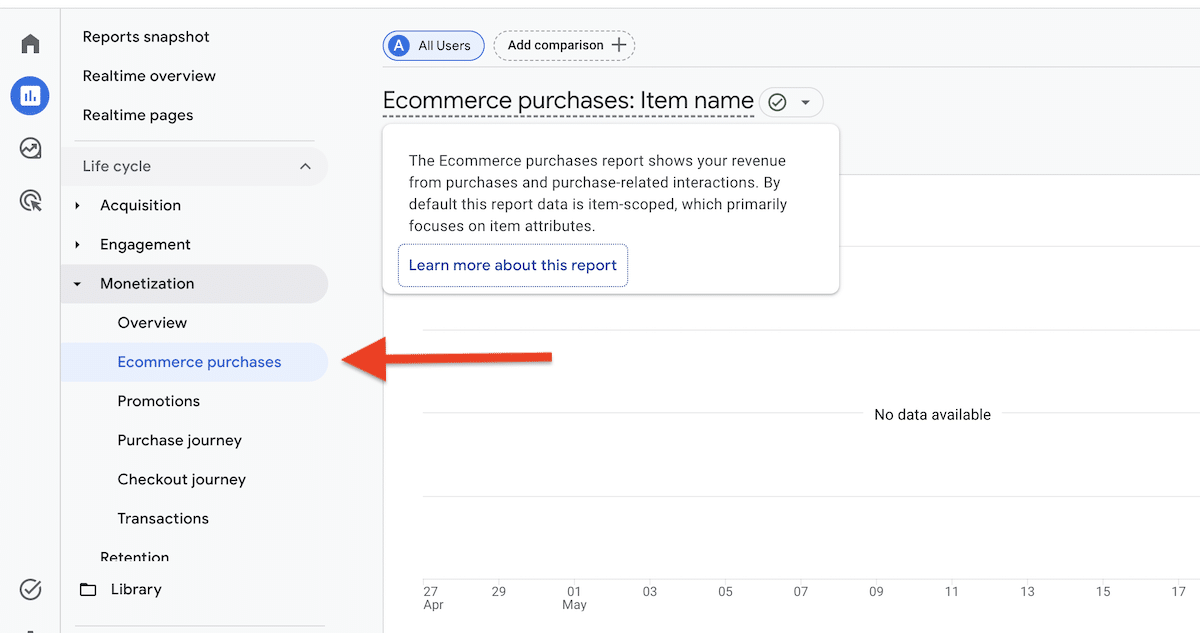
The landscape of CRO measurement underwent a significant shift with the transition from Google Universal Analytics to Google Analytics 4 (GA4). This chronological shift changed how “conversions” are defined, moving away from session-based tracking toward event-based modeling. This evolution allows CRO specialists to track more nuanced user journeys but requires a more rigorous definition of KPIs to avoid data fragmentation.
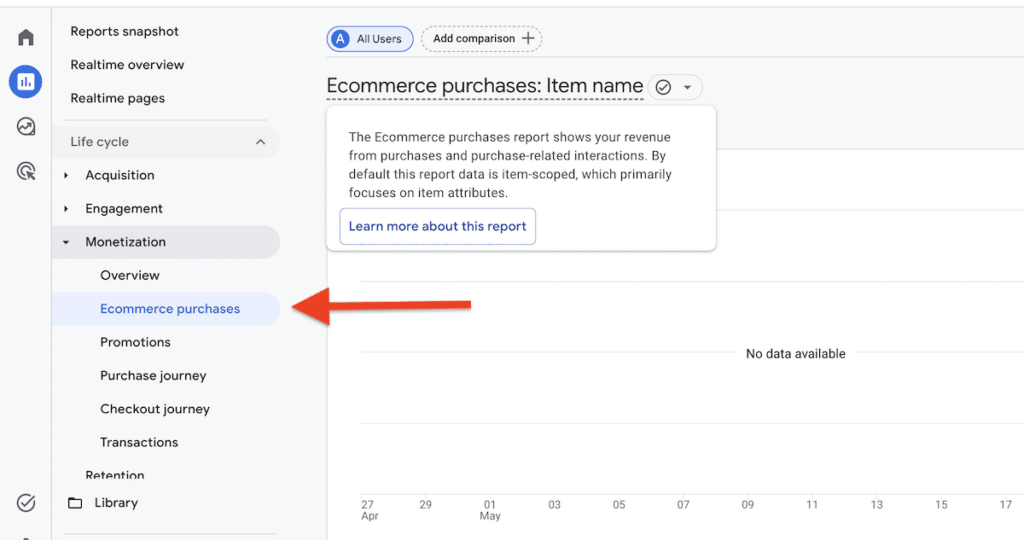
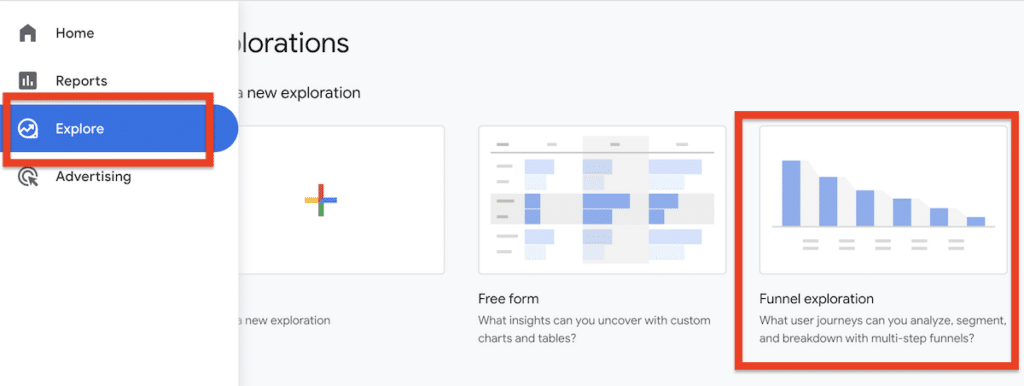
In the current data environment, tracking the “Purchase” event or “Lead_Form_Submit” event has become the industry standard. This shift emphasizes the importance of the “Funnel Exploration” report in GA4, which allows teams to visualize exactly where users exit the conversion path, providing the necessary context to select the right KPI for a specific test.
Analysis of the 11 Essential CRO KPIs for Business Growth
To build a robust optimization program, organizations must focus on KPIs that reflect different stages of the customer journey and various business models.
1. Conversion Rate (CR)
The conversion rate remains the most foundational KPI. It is calculated by dividing the number of successful conversions by the total number of visitors, multiplied by 100. While simple, its power lies in its clarity. It serves as the primary “temperature check” for any landing page or checkout sequence. For example, if a page receives 10,000 visitors and 200 complete a purchase, the 2% conversion rate provides a baseline for all future A/B testing.
2. Revenue per Visitor (RPV)
RPV is often considered a “truer” metric for e-commerce than conversion rate alone. It accounts for both the frequency of purchases and the value of those purchases. If a test increases the conversion rate but significantly lowers the average spend, the RPV will reveal that the test was actually a net negative for the business.
Formula: Total Revenue ÷ Total Visitors.
3. Average Order Value (AOV)
AOV measures the average dollar amount spent each time a customer places an order. This KPI is vital when testing bundles, upsells, or “free shipping” thresholds. It answers the question: “Are we convincing customers to buy more per transaction?”
4. Lead Conversion and Quality Rate
For B2B and SaaS organizations, total lead volume can be a misleading metric. The focus must remain on the “Qualified Lead Rate.” This KPI filters out spam and low-intent submissions, ensuring that the CRO efforts are assisting the sales team rather than overwhelming them with low-value data.
5. Demo Booking and Trial Signup Rate
In the SaaS sector, the transition from a “visitor” to a “user” is the most critical micro-conversion. Tracking the rate at which visitors move from a homepage to a demo or a free trial provides a direct look at the effectiveness of the value proposition and the friction within the signup flow.
6. Cart Abandonment Rate
This KPI identifies the percentage of users who add items to a cart but exit before completing the transaction. High abandonment rates often point to technical friction, hidden costs (like shipping), or a lack of trust in the payment gateway.
7. Form Completion Rate
Often overlooked, the granularity of form completion—measuring the drop-off between individual fields—allows CRO teams to simplify lead capture. A high “Form Start” rate coupled with a low completion rate is a definitive signal that the form is too intrusive or complex.
8. Customer Lifetime Value (CLV)
While harder to track in short-term A/B tests, CLV is a long-term CRO KPI. It measures the total revenue a business can expect from a single customer account. Optimization efforts should ideally attract high-value customers who return, rather than one-time discount seekers.
9. Churn Rate
Specific to subscription models, the churn rate measures the percentage of customers who cancel. CRO is not just about the first sale; it is about optimizing the user experience to ensure retention.
10. Click-to-Lead Ratio
This KPI measures the effectiveness of the initial call-to-action (CTA) in driving users toward a lead capture event. It bridges the gap between engagement and intent.
11. Return on Ad Spend (ROAS) Improvement
While often seen as a marketing metric, CRO’s primary job is to improve ROAS. By increasing the conversion rate of paid traffic, CRO specialists directly lower the cost per acquisition, making every advertising dollar work harder.
Selecting the Right KPI: A Strategic Framework
Choosing a KPI for a specific initiative requires a structured approach to ensure the data collected is relevant to the stakeholders. Industry experts suggest a “Primary, Diagnostic, and Guardrail” framework.
The Primary KPI: This is the single number that defines success. If the goal is to increase sales, the primary KPI is the purchase conversion rate or RPV. Attempting to “win” on every metric simultaneously often leads to conflicting data and paralysis.
Diagnostic KPIs (2–4): These metrics explain why the primary KPI moved. If the conversion rate increased, diagnostic metrics like “Average Time on Page” or “Scroll Depth” can help determine if users are more engaged or simply moving through the funnel faster.
Guardrail KPIs (1–3): These are essential for preventing “downstream damage.” For example, if you optimize a lead form to be extremely short, your conversion rate might skyrocket, but your “Lead Quality” (the guardrail) might plummet. Guardrail KPIs ensure that optimization in one area does not break another part of the business.
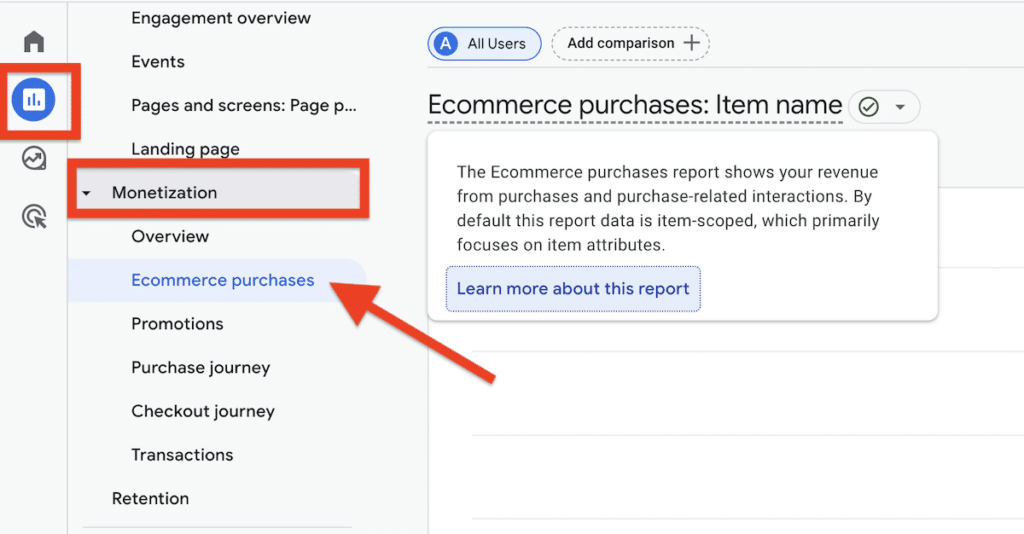
Implementation and Reporting to Stakeholders
The final stage of a CRO program is the communication of results to executives and product teams. Data must be presented in a way that relates back to the bottom line. Professional reporting typically utilizes a centralized dashboard that segments data by traffic source (Organic vs. Paid) and device type (Mobile vs. Desktop).
Segmentation is critical because a site-wide conversion rate often hides the truth. A 5% conversion rate on desktop might be masking a broken 0.5% conversion rate on mobile devices. By segmenting CRO KPIs, teams can identify specific bottlenecks that require targeted interventions.
Broader Impact and Industry Implications
The shift toward data-driven CRO KPIs marks a move away from “gut-feeling” web design. As artificial intelligence and machine learning begin to automate parts of the testing process, the human role in CRO is shifting toward strategic KPI selection and ethical data interpretation.
Organizations that master the alignment of CRO KPIs with business goals gain a significant competitive advantage. They are able to iterate faster, spend marketing budgets more efficiently, and create user experiences that are not only aesthetically pleasing but commercially potent. In the current economic climate, where efficiency is prioritized over raw growth, the rigorous tracking of these 11 KPIs is no longer optional—it is a prerequisite for digital survival.







