Digital marketing professionals and data analysts have long grappled with a persistent technical challenge: the statistical variance between A/B testing platforms and web analytics suites. While minor discrepancies are considered an industry norm, significant gaps in data often lead to internal friction, questioning the integrity of conversion rate optimization (CRO) efforts. Recent research into the mechanics of Google Analytics 4 (GA4) and synchronous testing scripts reveals that the primary culprit behind these mismatches is not necessarily misconfiguration, but rather the complex interplay between network conditions and hardware performance.
The Foundation of Data Variance in Modern Analytics
The transition from Universal Analytics to Google Analytics 4 introduced a paradigm shift in how user interactions are recorded. GA4 operates on an event-based model designed to be flexible and privacy-centric. However, this flexibility comes with technical trade-offs regarding data synchronicity. In a standard testing environment, an A/B testing tool, such as Convert Experiences, typically fires its script synchronously within the <head> tag of a website. This ensures that the experiment variations are applied before the user sees the page, preventing “flicker” or “flash of original content” (FOOC).
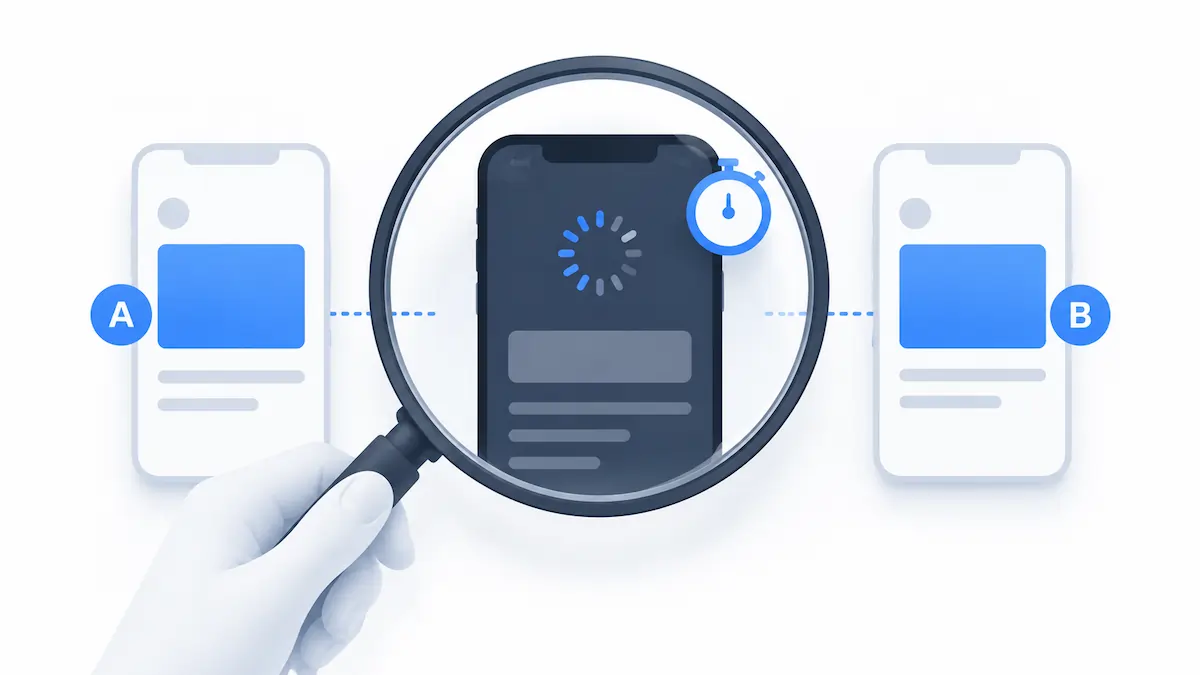
In contrast, GA4 is designed to load asynchronously. This means the browser prioritizes the rendering of visual elements and the execution of critical site scripts before allowing the analytics beacon to fire. While this approach benefits Core Web Vitals and overall user experience, it creates a “timing window” where data can be lost. Industry experts, including veteran analyst Ryan Levander, suggest that a variance of up to 5% in bottom-of-funnel conversion tracking—such as purchases, lead generations, or trial sign-ups—is acceptable. When the discrepancy exceeds this threshold, it indicates a deeper systemic issue that requires a technical audit.
A Two-Year Investigation into Data Attrition
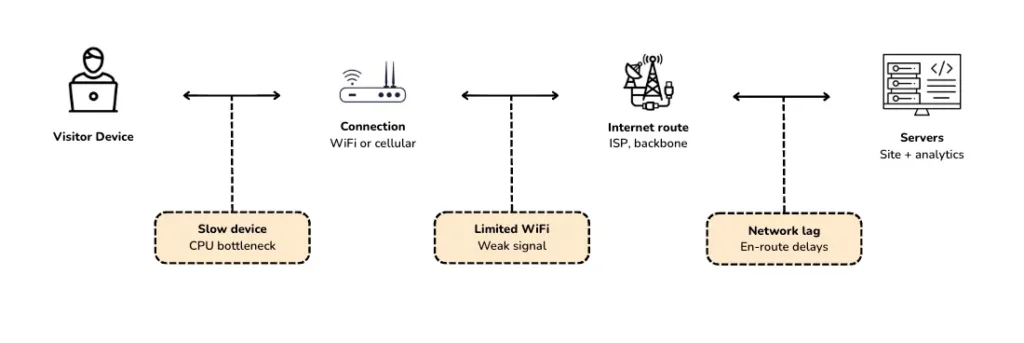
To understand the root causes of these discrepancies, technical teams at Convert conducted a comprehensive two-year study, debugging GA4 implementations across dozens of high-traffic enterprise sites. The methodology involved simulating various network environments, ranging from high-speed fiber connections to throttled 3G and 4G signals, while monitoring how different hardware—from high-end workstations to aging mobile devices—processed JavaScript.
The research focused on three primary variables: script placement, browser resource prioritization, and network stability. The findings contradicted several long-held beliefs in the digital marketing space, particularly the efficacy of certain Google Tag Manager (GTM) “best practices.” The study concluded that the “gap” is not a single error but a cumulative result of how GA4 manages its event queue under duress.
The 20-Second Latency Phenomenon
One of the most significant discoveries from the investigation is what researchers termed the “20-second first-pageview delay.” On slow 3G or 4G connections, GA4’s initial page_view event frequently fails to fire for up to 20 seconds after the initial request. In the fast-paced environment of mobile browsing, 20 seconds is an eternity.
Data suggests that a significant portion of users—particularly those browsing on public WiFi or in areas with poor cellular reception—will interact with a page and navigate away or close the browser before the 20-second mark. Because the A/B testing tool fires synchronously at the start of the session, it records the visitor immediately. GA4, however, never registers the session because the initial page_view event remained in the browser’s queue when the user exited. This creates a scenario where a visitor is counted as a participant in an experiment but never appears in the analytics suite, leading to an artificial inflation of conversion rates in one tool and an undercounting of traffic in the other.
The Impact of Global Connectivity Standards
Despite the global push toward 5G technology, actual network performance remains highly variable. According to a 2025 report by RCR Wireless, only about half of cellular connections in the United States are currently utilizing 5G. Furthermore, data from Opensignal indicates that even users with 5G-capable devices and plans spend a significant amount of time on LTE or slower networks due to signal penetration issues and network congestion.

This “connectivity debt” means that a substantial slice of any given website’s audience is operating on “slow” connections. When these users visit a site running an A/B test, the discrepancy between the synchronous testing script and the asynchronous GA4 beacon becomes pronounced. The hardware also plays a critical role; a five-year-old smartphone processes JavaScript much slower than a modern flagship device, further delaying the execution of analytics tags and widening the data gap.
Identifying the “Network-Loss Signature” in Conversion Funnels
The research identified a specific pattern in data loss that allows analysts to diagnose network-related issues. If data loss were random or caused by a simple configuration error, the discrepancy would likely be uniform across the entire conversion funnel. However, network-induced loss follows a distinct “funnel shape.”
The largest gaps typically appear at the funnel entry (initial visits) and the final conversion (purchases). The middle of the funnel—events like view_item or add_to_cart—often appears more consistent between tools. This occurs because users who survive the initial 20-second loading bottleneck have, by definition, a stable enough connection to continue the session. Once the initial GA4 script has loaded and the session is established, subsequent events fire with higher reliability. However, because GA4 ties all downstream events to that initial, potentially lost page_view, the entire session and the final conversion are often erased from the analytics record if the start was not captured.

The Technical Trap of “Window Loaded” Triggers
For years, a common piece of advice within the SEO and web performance community has been to fire non-critical tags, including analytics, on the “Window Loaded” event rather than the “Page View” event. The logic was to ensure that the browser has finished loading all images, sub-frames, and scripts before processing analytics, thereby improving Core Web Vitals scores like Largest Contentful Paint (LCP).
The Convert study highlights that this is a “performance trap.” While it may marginally improve lab-based speed scores, it significantly degrades data integrity. By waiting for the entire window to load, the site owner is intentionally extending the period during which a user can leave without being tracked. On a slow network, the “Window Loaded” event might fire a full minute after the user has already begun interacting with the content. For organizations that prioritize data-driven decision-making, the trade-off of slightly better SEO metrics for significantly worse data accuracy is often a net negative.
A Strategic Framework for Diagnosing Discrepancies
To resolve these issues, organizations are encouraged to follow a structured diagnostic process. This framework moves beyond simple configuration checks and looks at the behavioral and technical data flow.

- Metric Alignment: Analysts must ensure they are comparing “Users” in GA4 to “Visitors” in the testing tool. Comparing GA4 “Sessions” to testing tool “Visitors” is a common error, as a single visitor can initiate multiple sessions, leading to an apples-to-oranges comparison.
- Segmented Analysis: By filtering GA4 reports to only include visitors exposed to a specific experiment (using integration events like
experience_impression), analysts can isolate the data. Comparing experiment-specific data to total site traffic is a frequent source of perceived mismatches. - Device and Network Segmentation: Comparing the delta between desktop and mobile visitors is the most effective way to identify network-related loss. If the gap is negligible on desktop but exceeds 15% on mobile, the issue is almost certainly related to network latency and device performance.
- Funnel Audit: Mapping the percentage gap at each stage of the journey allows teams to see if the “network-loss signature” is present. High variance at the start and end of the funnel with stability in the middle is the smoking gun for connectivity issues.
- Server-Side Validation: The ultimate “source of truth” is often found in server logs or backend CRM data. Because server-side recording does not depend on a client-side JavaScript beacon firing in the browser, it provides a stable reference point to determine which client-side tool is closer to reality.
Broader Implications for the CRO Industry
The realization that network conditions are a primary driver of data variance has significant implications for how A/B tests are interpreted. It suggests that many experiments may be suffering from “survivorship bias,” where the data collected primarily represents users with high-end devices and stable internet connections.
If GA4 is consistently undercounting users on slow networks, and these users behave differently than those on fast networks (e.g., they are more frustrated or less likely to convert), the experiment results could be skewed. This reinforces the necessity of using A/B testing platforms that fire synchronously and, where possible, incorporating server-side tracking to ensure that the most vulnerable segments of the audience are represented in the data.
The objective for digital teams should not be to achieve 0% variance—an impossible task given the current architecture of the web—but to understand the nature of the gap. By recognizing that device performance and network latency are inherent variables, organizations can move away from fruitless troubleshooting and toward a more nuanced, sophisticated approach to data analysis. As the web becomes increasingly mobile-first and global, the ability to account for these “invisible” technical factors will distinguish successful data-driven organizations from those chasing ghosts in their analytics suites.