

The modern digital marketing landscape is defined by an era of unprecedented data collection, yet a growing divide has emerged between the reported success of optimization programs and the actual revenue reflected on corporate balance sheets. While most conversion rate optimization (CRO) teams can present an extensive list of "wins" through A/B testing and segmented targeting, few can effectively demonstrate to a Chief Financial Officer (CFO) how these interventions translate into tangible profit. Industry analysis suggests that the primary obstacle is not a lack of data, but rather a fundamental misunderstanding of how to identify which customer data is worth acting upon. Personalization only generates value when it alters a decision that would have otherwise remained static, and when the resulting outcome exceeds the operational costs of implementation and maintenance.
The Personalization Paradox: Correlation Versus Causation
The drive toward hyper-personalization is often justified by high-level industry benchmarks. A prominent study by McKinsey & Company revealed that fast-growing companies generate approximately 40% more of their revenue from personalization than their slower-growing counterparts. While frequently cited as proof of the efficacy of personalization, econometricians argue that this finding identifies a correlation rather than a direct causal link. High-growth organizations typically possess superior data infrastructure, larger budgets, and more sophisticated talent pools; personalization may be a symptom of their success rather than its primary driver.
The risk of misinterpreting such data was famously illustrated by researchers at Yahoo. In a study examining whether display advertisements increased brand-related searches, observational data suggested an massive lift ranging from 870% to 1,200%. However, when a randomized controlled trial (RCT) was conducted using a holdout group, the actual lift was discovered to be a mere 5.4%. This discrepancy, highlighted by experimentation experts Ron Kohavi and Stefan Thomke in the Harvard Business Review, underscores the "personalization paradox": customer data is exceptionally proficient at describing past behavior but often fails to predict how those same customers will respond to a modified digital experience.
The Evolution of Digital Experimentation: A Chronology
To understand the current state of personalization, it is necessary to trace the evolution of digital experimentation over the last two decades:

- 2000–2010: The Era of Basic A/B Testing. Organizations focused on "global" winners—changing button colors or headlines to see what worked best for the average user.
- 2010–2015: The Rise of Segmentation. With the advent of more sophisticated analytics, marketers began slicing data by device, geography, and referral source, leading to the first wave of manual personalization.
- 2015–2020: The CDP Boom and Algorithmic Targeting. The emergence of Customer Data Platforms (CDPs) allowed for the unification of online and offline data, while machine learning began automating the delivery of content.
- 2020–Present: The Accountability Crisis. As personalization costs have scaled, organizations are now facing pressure to prove incremental ROI, leading to the development of rigorous frameworks like the "Crossover Test."
The Crossover Test: A Framework for Strategic Personalization
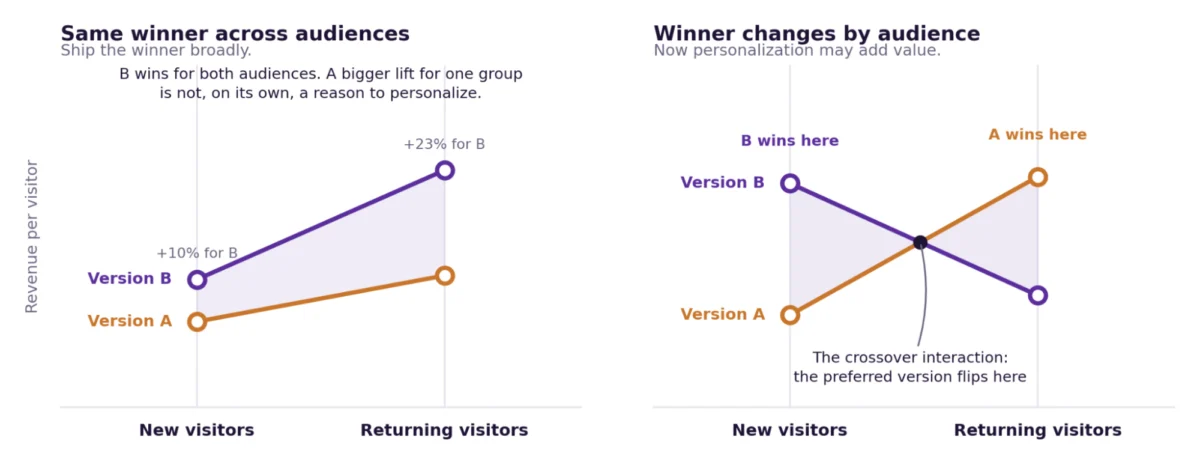
The core of the "Crossover Test" lies in identifying whether different customer segments actually require different experiences. In many optimization scenarios, a specific variation (Version B) may outperform the control (Version A) across all segments. For instance, if Version B yields a 3% lift for new visitors and a 9% lift for returning customers, the logical business decision is to deploy Version B to everyone. Creating a unique experience for returning customers in this scenario adds unnecessary operational complexity without providing incremental benefit over the global rollout.
True personalization opportunities exist only when a "crossover interaction" occurs—where Version B wins for Segment X, but Version A remains superior for Segment Y. If the same version wins for everyone, any additional targeting strategy operates at a disadvantage, burdened by the costs of managing multiple rules, creative variations, and technical maintenance.
Recent academic research from the Wharton School supports this distinction. Researchers Anya Shchetkina and Ron Berman conducted field studies across two similar environments using identical personalization methods. In the first study, personalization outperformed a global rollout by 18%. In the second, the gain was only 4%. The variance was not attributed to the sophistication of the technology, but to whether the customer data successfully identified groups that responded differently to the stimuli.
The Financial Reality: Calculating the Minimum Lift Needed
To bridge the gap between marketing and finance, optimization teams are increasingly adopting a "Minimum Lift" formula. This calculation determines the break-even point required to justify the overhead of a personalized experience.
The formula is defined as:
Minimum Lift Needed = Annualized Incremental Cost of Personalization ÷ Annual Profit Generated by the Eligible Group.

Consider a scenario where a personalization rule targets a specific segment representing 12% of a site’s 2,000,000 annual visits. If this group generates $960,000 in annual revenue at a 40% profit margin ($384,000), and the cost to maintain the personalization (including QA, content updates, and platform fees) is $18,000 per year, the minimum lift required is 4.7%. If a test shows only a 3% lift, the personalization actually results in a net loss of $6,500 annually, despite being a "winning" test in isolation.
Practical Application: The Four-Question Diagnostic
Before committing resources to a new personalization initiative, industry practitioners recommend a four-point diagnostic check to ensure the project aligns with financial goals:
- Does the winner change? Teams must look for a "flip" in the winning variation between segments, not merely a difference in the magnitude of the lift.
- Was the segment pre-defined? To avoid "data dredging," segments must be identified as hypotheses before the test begins. Post-hoc discoveries should be treated as new hypotheses for future testing, not as immediate deployment orders.
- Is the signal actionable? The data used to identify the segment must be available early enough in the customer journey to influence the experience. Identifying a "high-value" customer only after they have completed a checkout is useless for top-of-funnel personalization.
- Does the math clear the bar? The projected incremental profit must exceed the total cost of ownership (TCO) for the life of the personalization rule.
Case Study: The Travel and Hospitality Sector
A practical example of this rigor was seen in a recent project involving a major travel and hospitality brand. The company developed a personalized landing page for repeat visitors who had previously viewed premium properties. The personalized experience featured recently viewed properties and tailored package offers.
Initial testing showed a 6% revenue lift, which the marketing team viewed as a significant success. However, a deeper financial analysis revealed that the target audience generated $900,000 in annual revenue, making the 6% lift worth approximately $54,000. At a 25% profit margin, the incremental profit was $13,500. When the team accounted for the $15,000 annual cost of managing seasonal creative updates and cross-device QA for that specific rule, it became clear the project would lose $1,500 per year. Consequently, the brand chose to shelve the personalization and instead invested those resources into improving the global booking path, which offered a higher total upside.
Measuring Long-Term Impact Through Persistent Holdouts
Even when individual tests pass the Crossover Test, the cumulative effect of an optimization program can be difficult to quantify. Statistics suggest that adding up the "reported lift" from every winning experiment often leads to an overestimation of total value, as some winners are inevitably the result of random variation.
To combat this, leading tech organizations such as Airbnb have implemented "persistent holdout groups." In this model, a small percentage of total traffic (e.g., 1% to 5%) is never exposed to the optimizations shipped by the program. By comparing the long-term performance of this holdout group against the "optimized" group, organizations can provide the CFO with a definitive, credible estimate of the program’s total contribution to the bottom line.
Broader Implications for the Data Industry
The shift toward the Crossover Test signifies a maturing of the digital experience industry. For years, the narrative focused on the "volume" of data—the number of attributes in a CDP or the number of segments available for targeting. The focus is now shifting toward the "quality of signal."
Platforms like the Wingify Data Platform and the Wingify Personalization Suite are responding to this shift by prioritizing unified customer profiles that allow for more rigorous hypothesis testing. The goal is no longer to create as many personalization rules as possible, but to identify the specific instances where customer behavior is divergent enough to warrant a unique intervention.
For most organizations, this means the list of validated personalization opportunities will be shorter than expected. However, experts argue that a short list of high-impact, financially viable interventions is infinitely more valuable than a long list of marginal rules that drain operational resources. By focusing on genuine crossover interactions and maintaining a strict eye on the "Minimum Lift," companies can transform their optimization programs from cost centers into verifiable engines of incremental growth.







