

Statistical power serves as the primary determinant of whether an experimental framework possesses the necessary sensitivity to detect meaningful changes in user behavior. In the competitive landscape of digital commerce, organizations frequently deploy A/B tests to optimize conversion funnels, yet many of these experiments fail not due to a lack of creative innovation, but due to a fundamental misunderstanding of experimental sensitivity. When a testing team concludes that a variation has failed to outperform a control group because the results did not reach statistical significance, they often overlook the possibility that the variation was, in fact, superior. If a test is not designed with sufficient statistical power, a true 3% or 5% lift may remain invisible, leading companies to discard profitable improvements and settle for a suboptimal status quo.
The Foundational Principles of Statistical Power
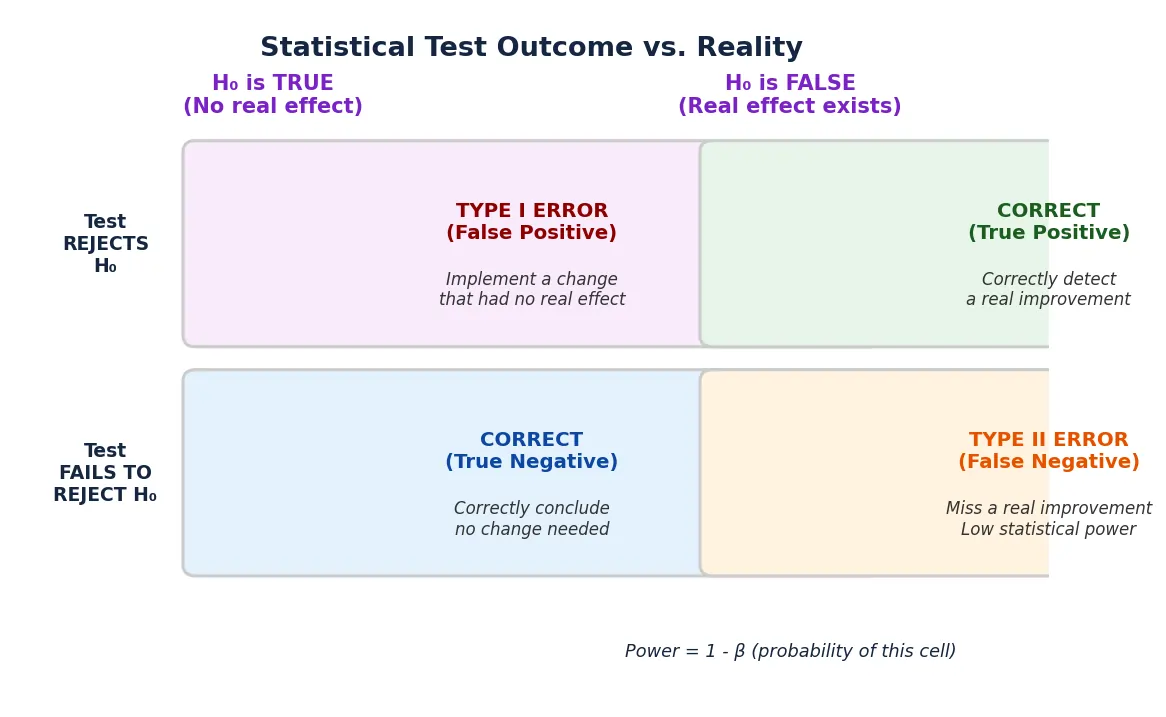
In the realm of statistical analysis, power is defined as the probability that a test will correctly reject a null hypothesis when a true effect of a specific size exists. While statistical significance (alpha) is designed to protect against false positives—instances where a change is implemented based on random noise—statistical power (1 minus beta) protects against false negatives. A false negative occurs when a variation provides a genuine improvement, but the experiment lacks the data or design precision to confirm it.

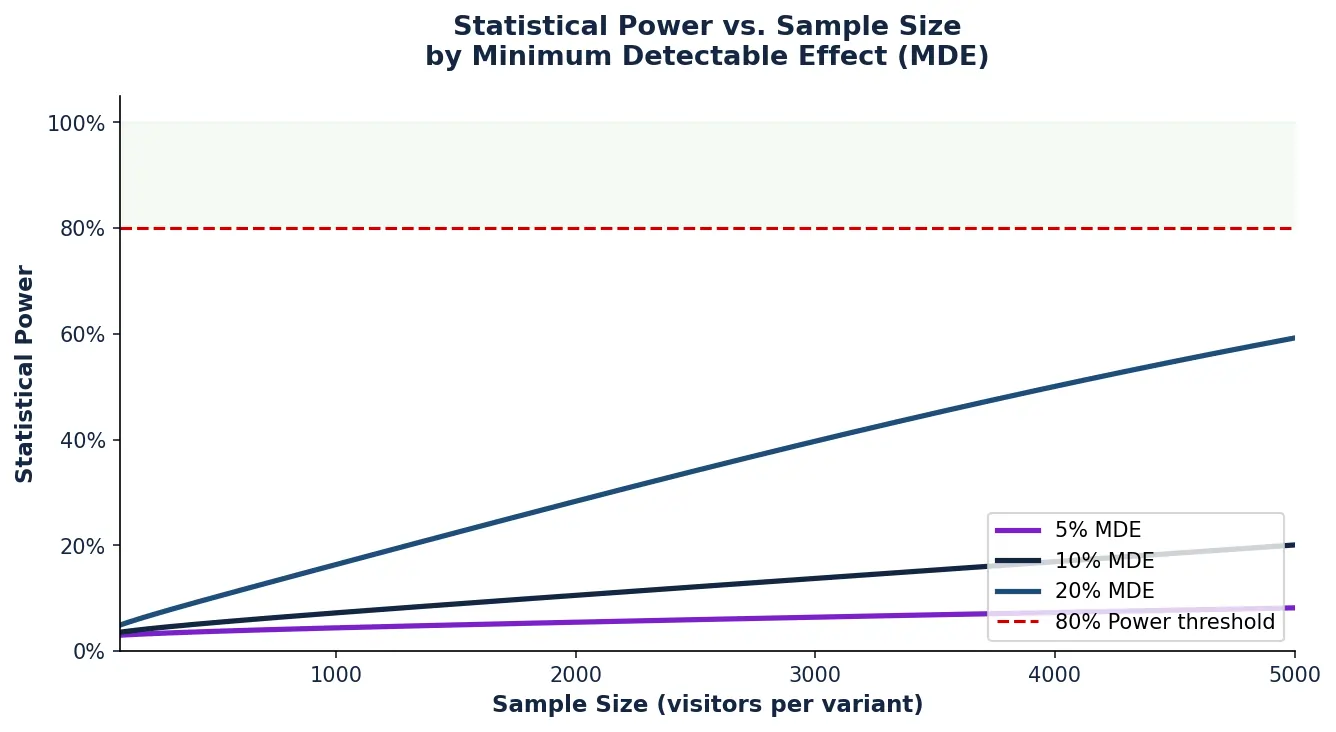
Standard industry practice typically dictates a target power of 80%. This means that if a variation truly delivers an improvement equal to or greater than the Minimum Detectable Effect (MDE) used in the test design, the experiment has an 80% chance of successfully detecting that lift. Conversely, there remains a 20% risk (beta) that the test will return a non-significant result despite the existence of a real benefit.
The distinction between significance and power is critical for executive decision-making. A result that is "not statistically significant" does not prove that a variation had no effect; rather, it often indicates that the experiment was underpowered. For high-stakes business decisions, relying on underpowered tests is equivalent to using a low-resolution lens to view microscopic data; the detail is there, but the equipment is incapable of capturing it.
The Four Determinants of Experimental Sensitivity
To achieve a rigorous experimental design, data scientists and optimization experts must balance four interdependent factors. Adjusting any one of these variables necessitates a shift in the others to maintain the integrity of the power analysis.

1. Sample Size (N)
The volume of independent randomized units—typically unique visitors—is the most direct lever for increasing power. As the sample size grows, the influence of random fluctuations and outliers diminishes, allowing the true performance of the variation to emerge. In large-scale enterprise environments, achieving a massive sample size is often a matter of time. However, for smaller platforms, the requirement for a large sample can extend test durations beyond practical limits.
2. Minimum Detectable Effect (MDE)
The MDE represents the smallest relative or absolute lift that the business deems worth detecting. There is an inverse relationship between the MDE and the required sample size: detecting a massive 20% lift requires relatively little data, whereas detecting a subtle 2% improvement requires a vast amount of traffic. Setting an MDE too low can lead to impractically long experiments, while setting it too high risks missing incremental gains that could aggregate into significant annual revenue.
3. Significance Level (Alpha)
The significance level defines the threshold of evidence required to declare a "winner." A standard alpha of 5% (reflecting a 95% confidence level) is the benchmark for most digital experiments. If a business demands higher certainty—such as a 99% confidence level—the test becomes more "cautious." This increased caution directly reduces statistical power unless the sample size is increased to compensate.
4. Data Variability and Variance
Variance refers to the natural "noise" within the data set. In conversion rate optimization, variance is tied to the baseline conversion rate. In metrics like Revenue Per Visitor (RPV), variance is often much higher because individual purchase amounts can fluctuate wildly. High-variance metrics require significantly more power and larger samples because it is mathematically harder to distinguish a true trend from a series of random, high-value transactions.
Chronology of a Rigorous Pre-Test Power Analysis
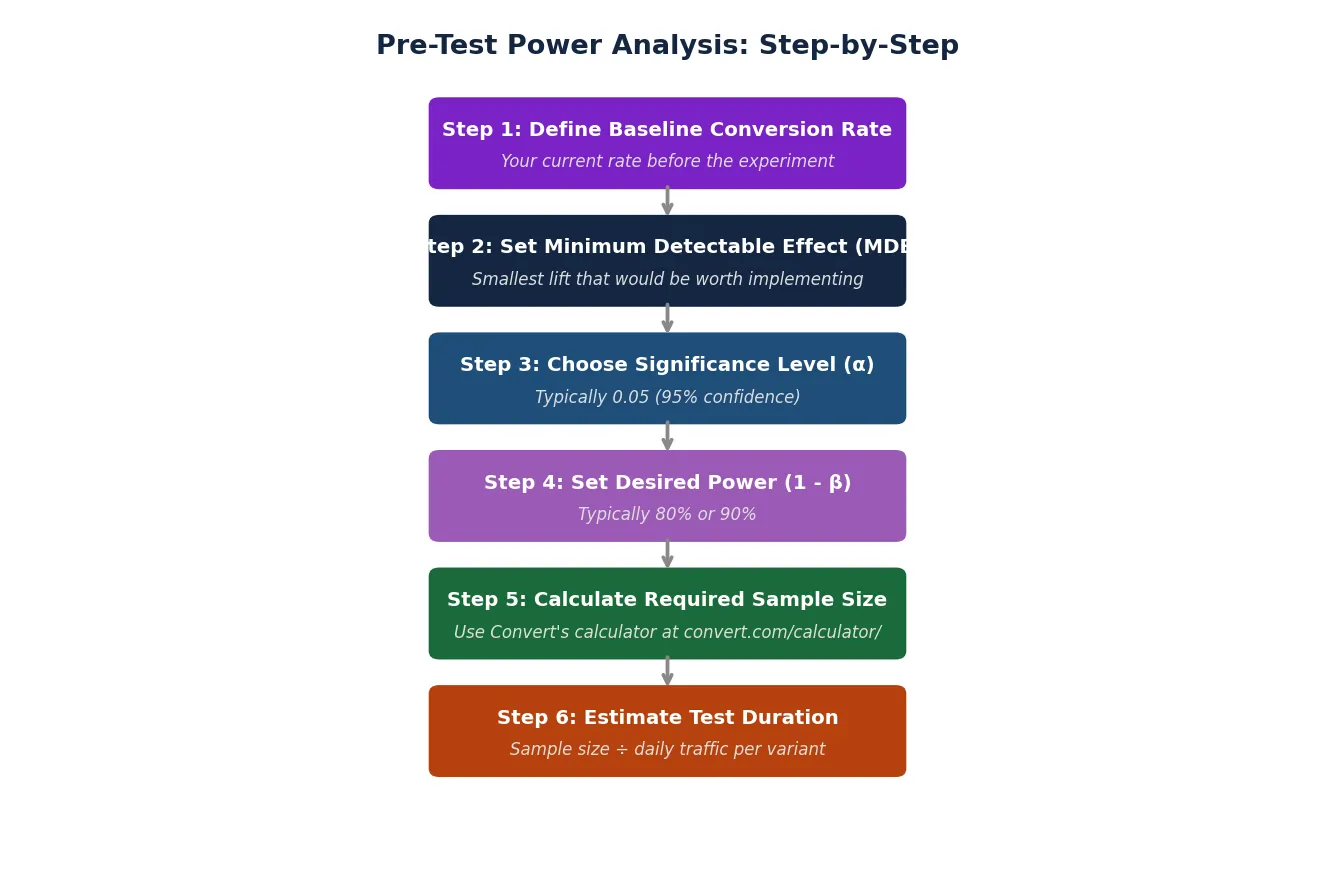
A professional experimentation workflow does not begin with the launch of a test, but with a structured pre-test power analysis. This chronological process ensures that resources are allocated only to experiments with a high probability of success.
Phase I: Baseline Establishment
Analysts first determine the current performance of the control group using historical data from the preceding 30 to 90 days. This baseline provides the starting point for all subsequent calculations.
Phase II: Economic Threshold Setting (MDE)
The stakeholders define the MDE based on business objectives. For example, if a new feature requires significant engineering maintenance, the MDE might be set higher to ensure that only "big wins" justify the implementation.
Phase III: Risk Assessment (Alpha and Power)
The team selects the alpha and power targets. While 5% alpha and 80% power are standard, a company might increase power to 90% for a critical checkout redesign where missing a winner would be financially catastrophic.
Phase IV: Sample Size and Duration Estimation
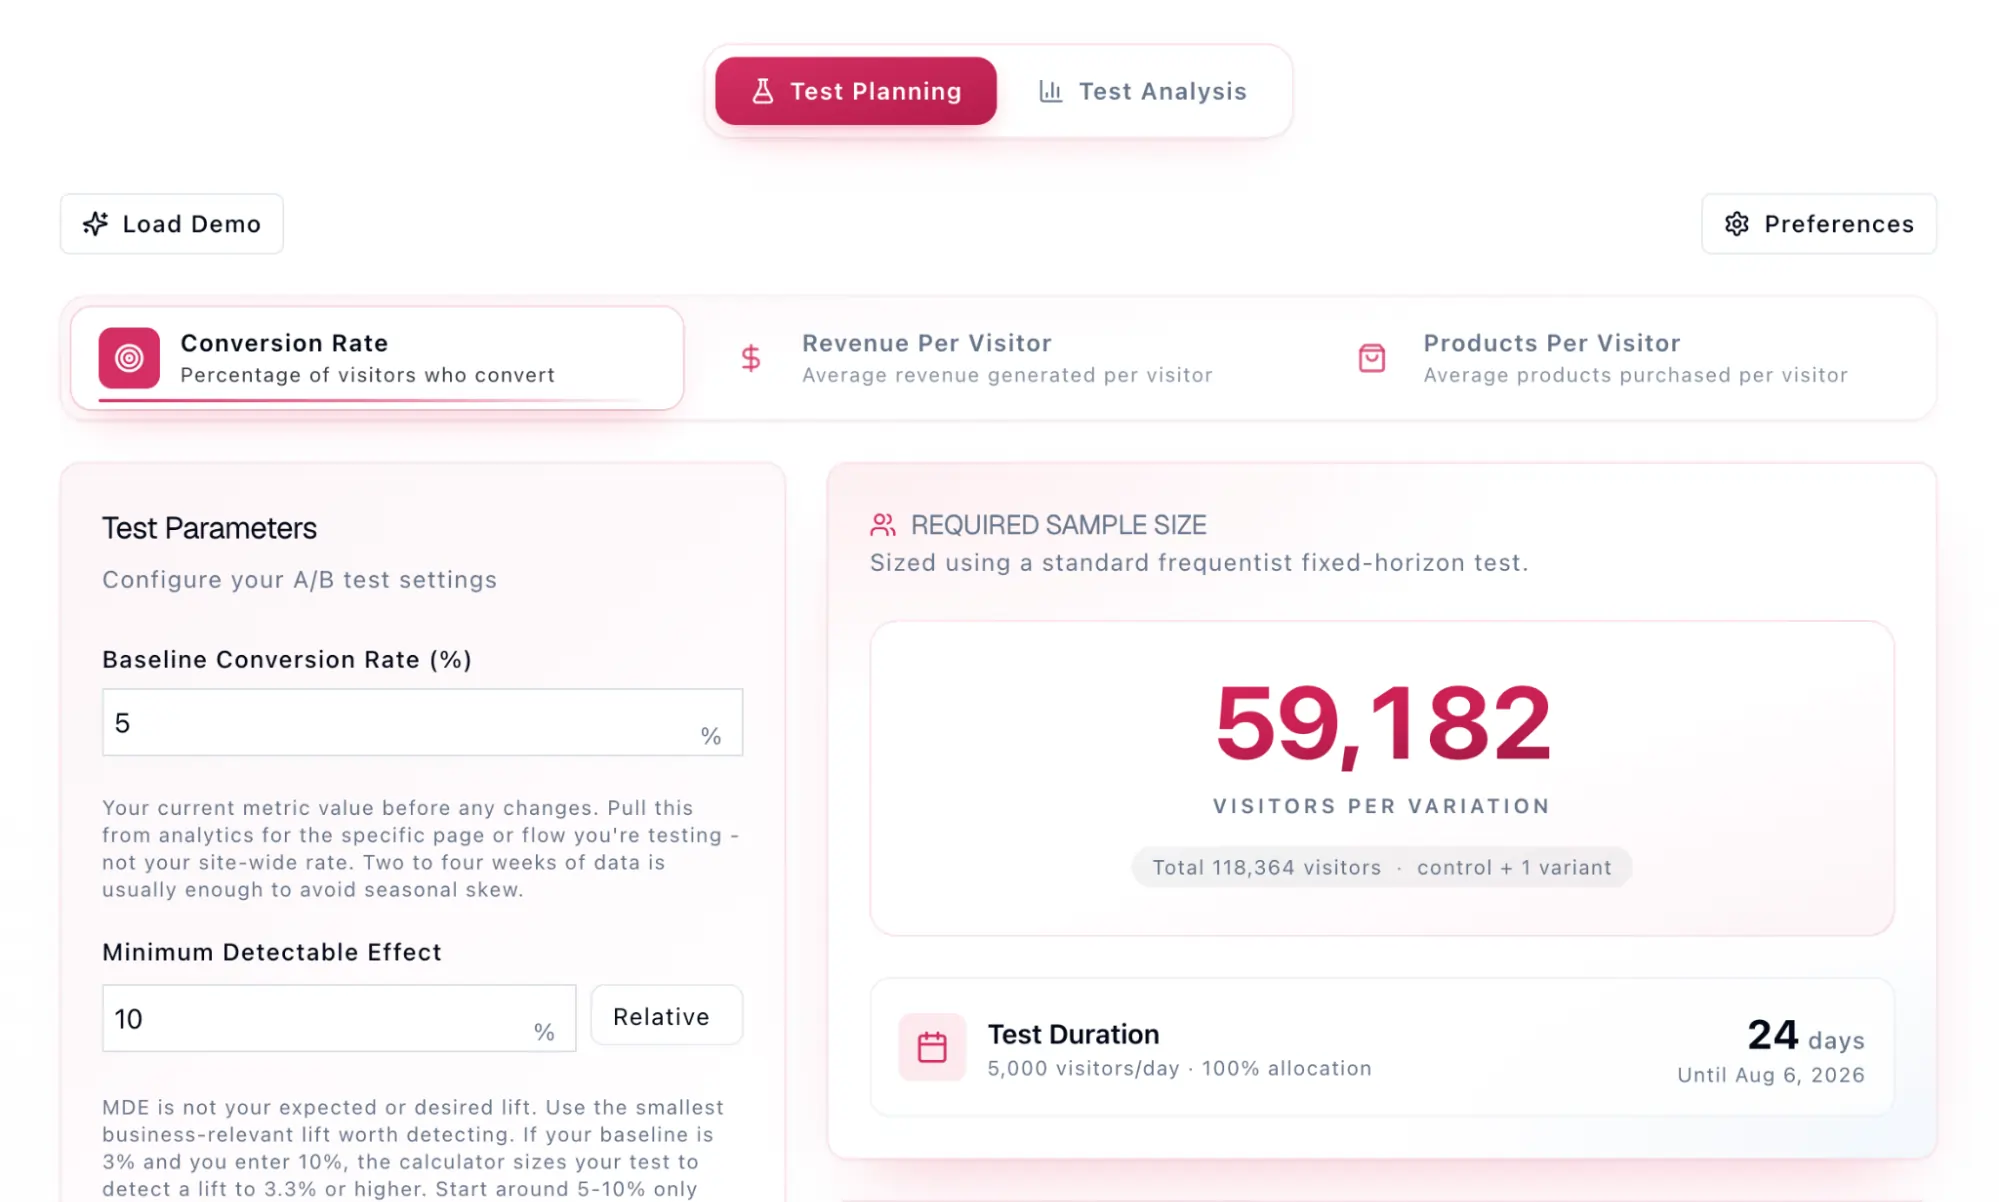
Using the established variables, the team calculates the total required traffic. By dividing this number by the average daily traffic of the target page, they arrive at a projected duration. Experts recommend that tests run for at least one full business cycle (usually seven days) to account for day-of-the-week fluctuations, regardless of how quickly significance is reached.
The Economic Implications of Underpowered Testing
The financial cost of running underpowered tests is often invisible but substantial. Consider a Software-as-a-Service (SaaS) company generating $12 million in annual revenue. If a product team runs an underpowered test on a new pricing page and misses a genuine 2% lift in conversions, the company loses $240,000 in unrealized growth for that year alone. Because SaaS models rely on recurring revenue, that loss compounds over time, affecting the baseline for all future fiscal years.
Beyond direct revenue loss, low power undermines the "False Discovery Rate." If a testing program consistently runs tests at 10% power, a significant portion of the "winning" results will actually be false positives. In a scenario where 100 tests are run and only 10% power is applied, it is statistically probable that half of the reported winners are actually the result of sampling noise. This creates a "diluted" optimization program where the cumulative gains reported in dashboards never materialize in the company’s bank account.
This phenomenon is often linked to Twyman’s Law, which suggests that any figure that looks particularly unusual or "too good to be true" is likely the result of an error. In underpowered tests, the only variations that manage to reach significance are those that happened to experience an extreme upward fluctuation in noise, leading to "Effect Size Overestimation."
Comparative Analysis of Statistical Methodologies
The management of power varies significantly depending on the underlying mathematical framework utilized by the testing platform.
- Frequentist Approach: This is the traditional model requiring a fixed sample size determined in advance. Power is a rigid prerequisite; "peeking" at results before the sample size is reached invalidates the alpha and power settings, leading to unreliable conclusions.
- Sequential Testing: Developed to allow for continuous monitoring, sequential testing adjusts statistical boundaries as data accumulates. This method can lead to earlier stopping points for "home run" variations, effectively optimizing power in real-time without the risks associated with manual peeking.
- Bayesian Statistics: Bayesian models focus on the "probability of beating the control" and the "expected loss" rather than binary significance. While the term "power" is less common in Bayesian circles, the concept of sensitivity remains. Bayesian methods provide a more fluid interpretation of risk, which many practitioners find more intuitive for business decision-making.
Challenges with High-Variance Metrics
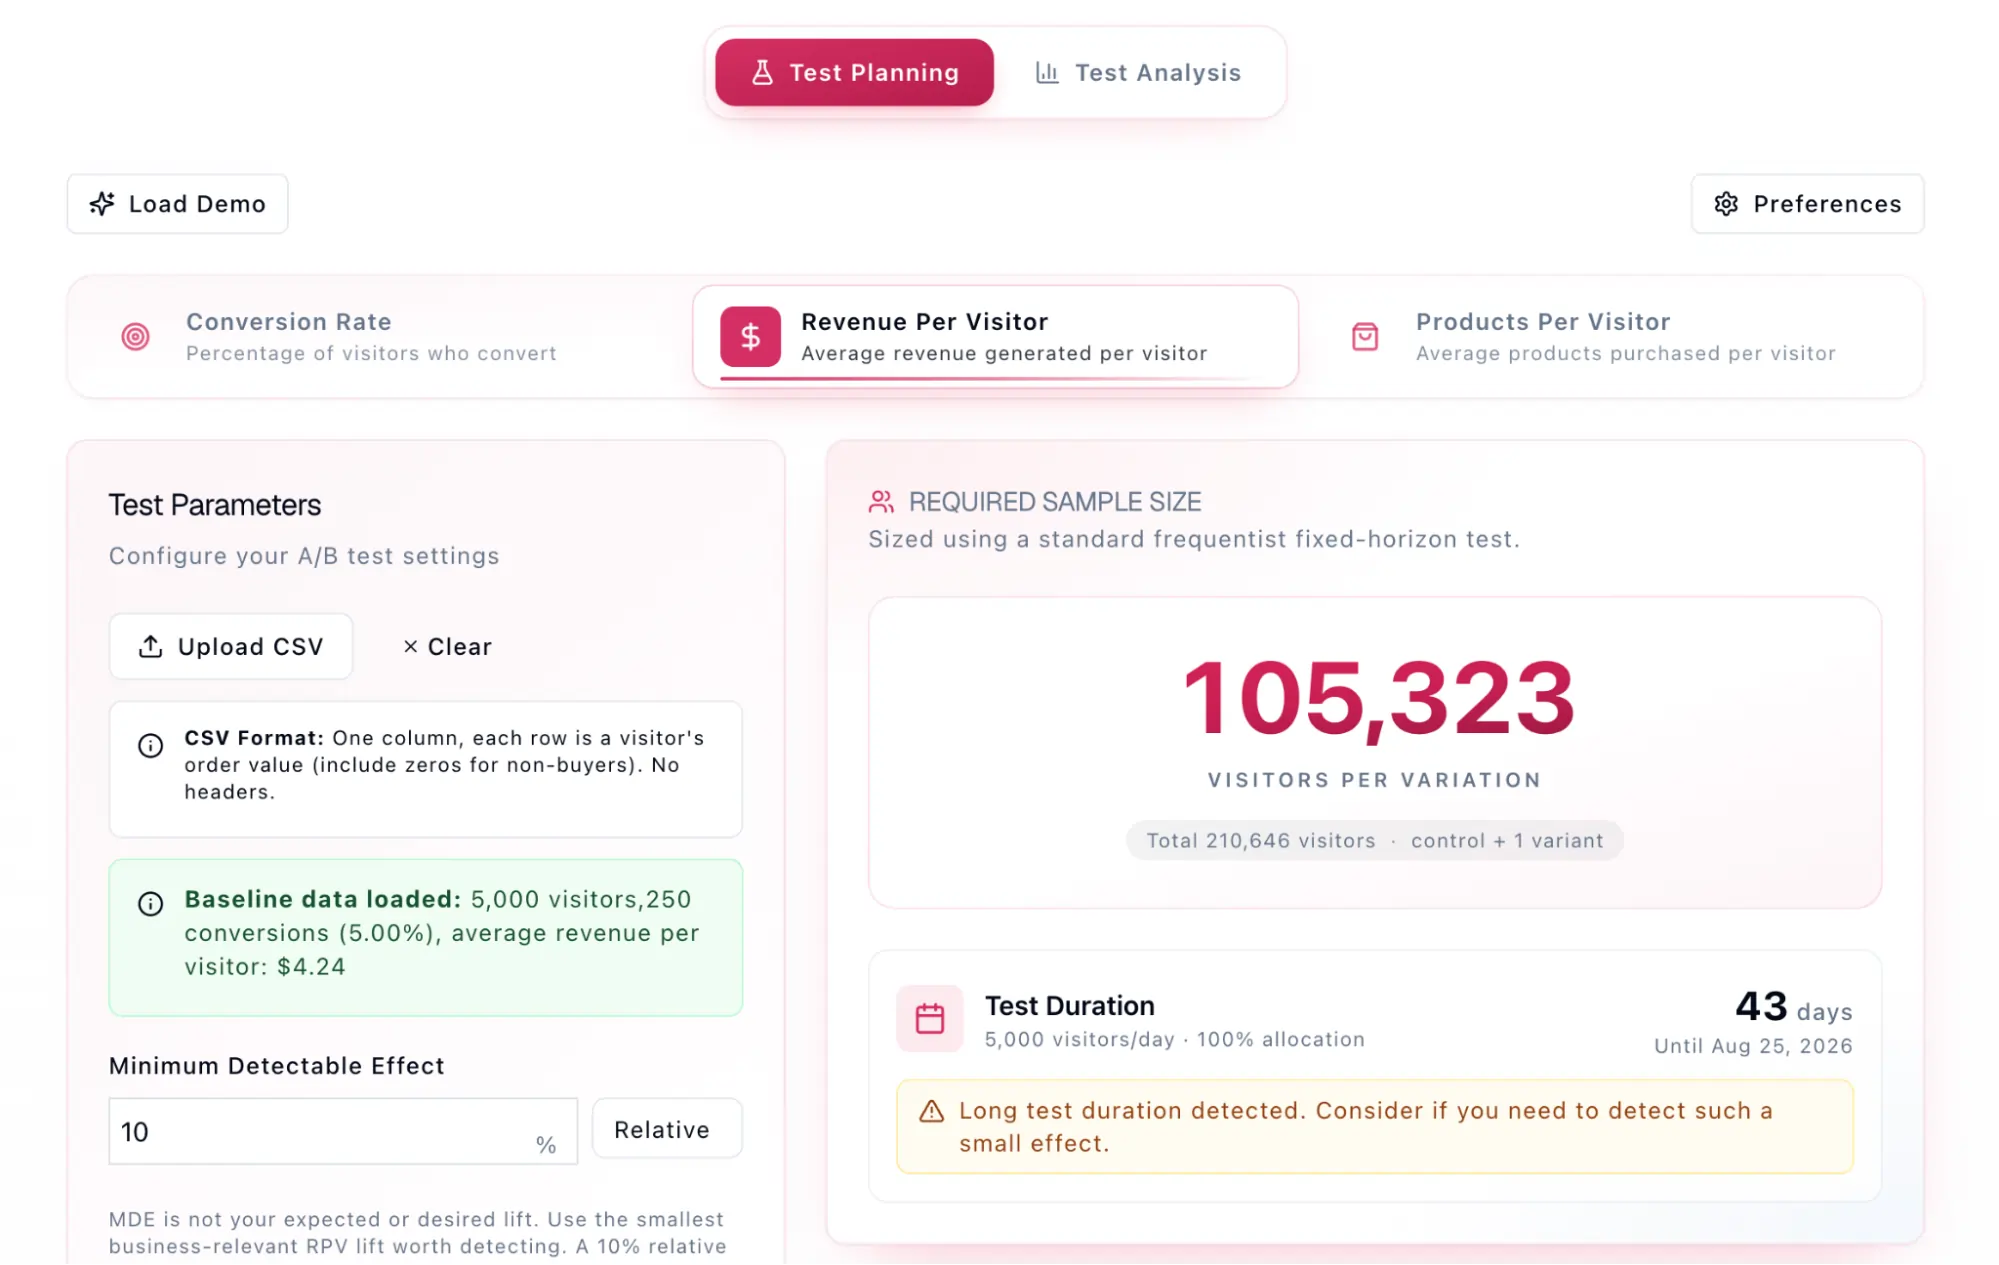
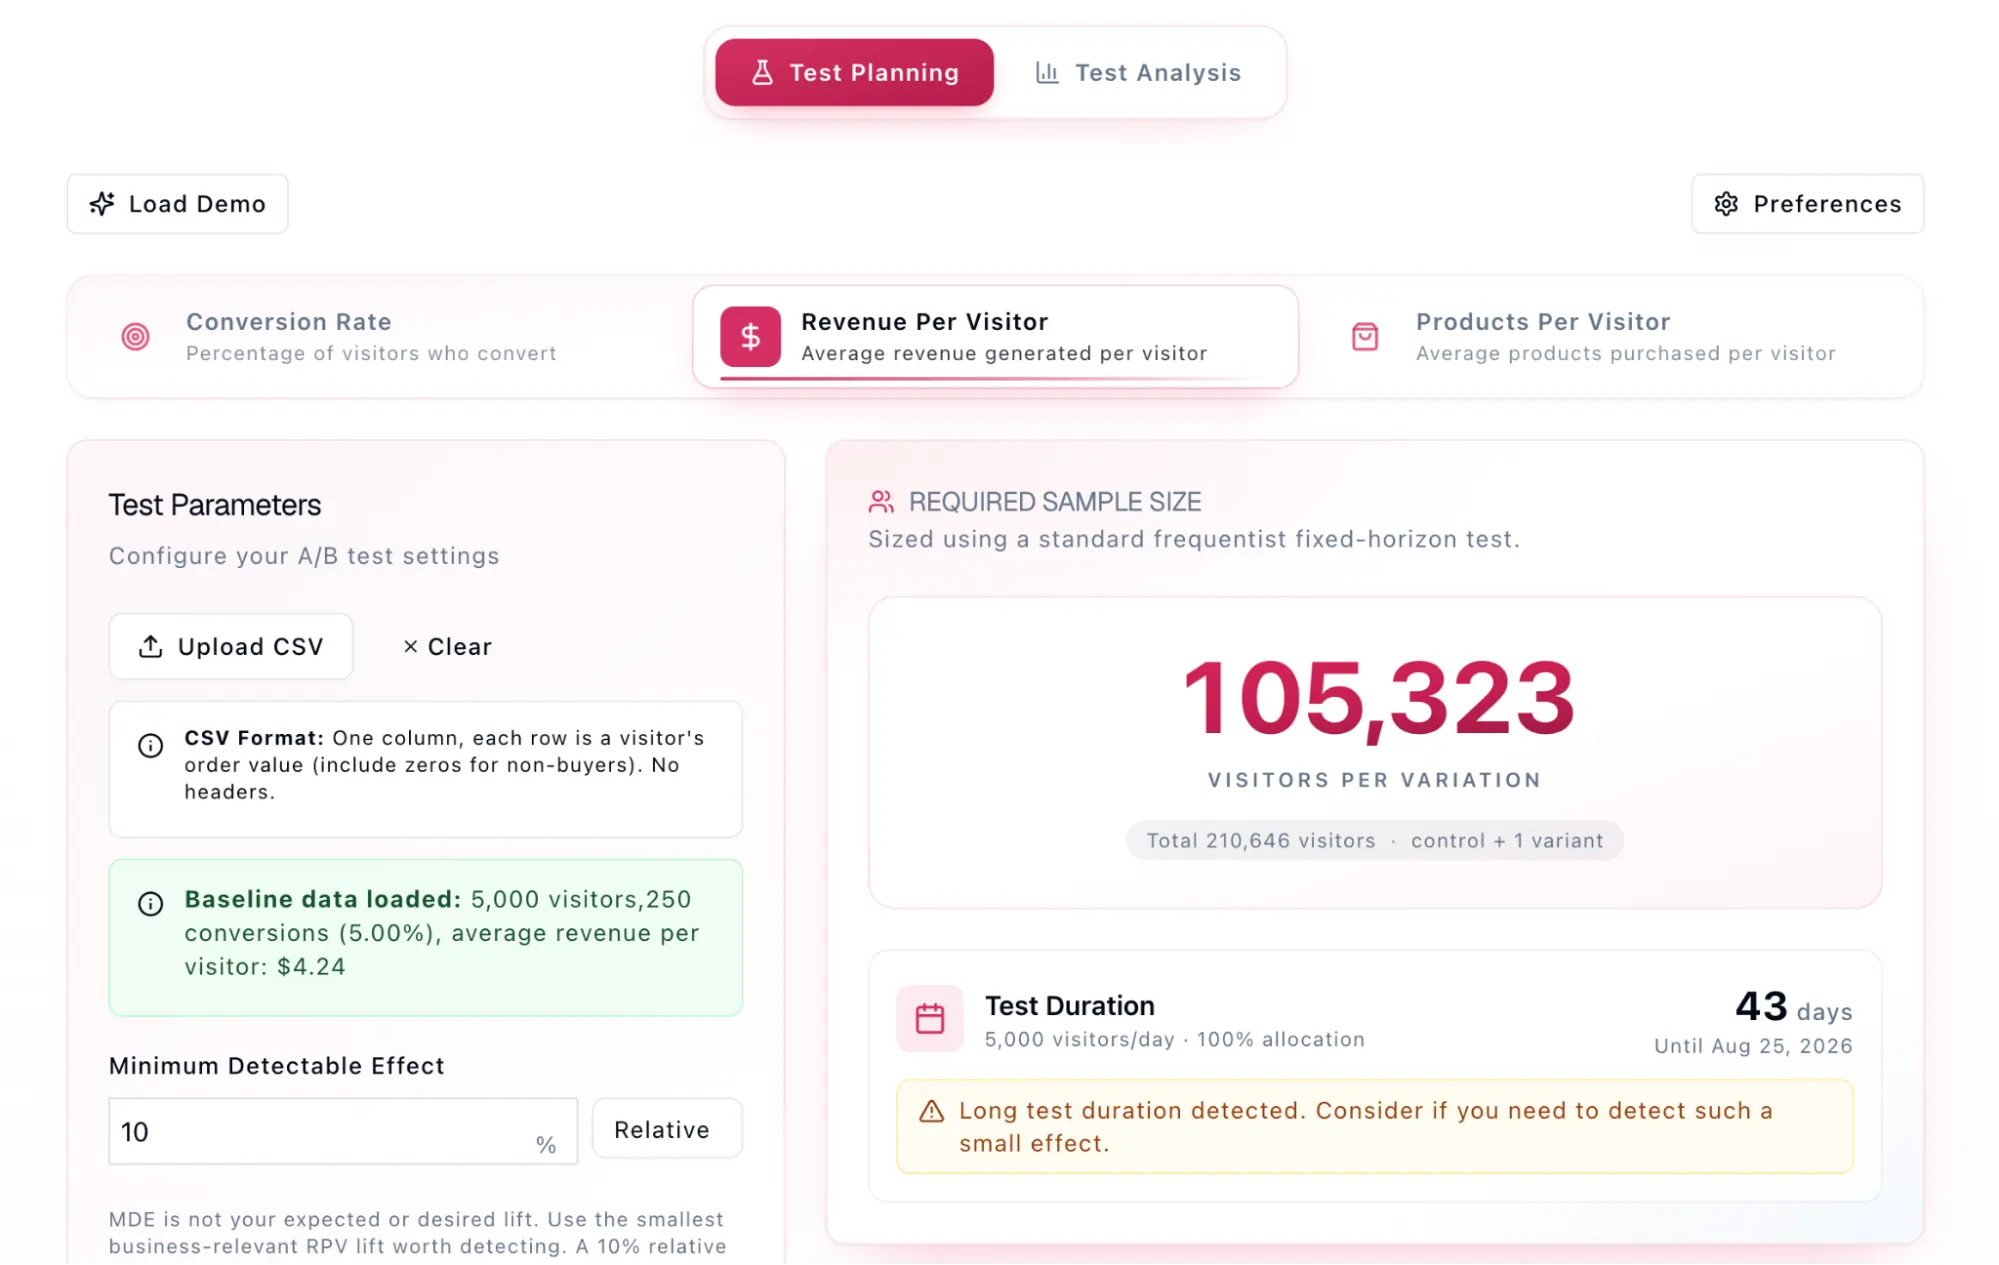
While binary metrics (did the user buy or not?) are straightforward, continuous metrics like Revenue Per Visitor (RPV) present unique challenges. RPV is the product of conversion rate and Average Order Value (AOV). Because AOV can range from a few dollars to thousands, the standard deviation is immense.
Supporting data from industry simulations indicates that an RPV test often requires nearly double the sample size of a standard conversion rate test to achieve the same level of statistical power. Organizations must be prepared for longer runtimes when revenue is the primary KPI, or they must accept a much higher MDE.
Strategic Mitigations for Low-Traffic Environments
For organizations that lack the traffic to support 80% power at a 5% MDE, several strategic compromises can be employed:
- Macro-Conversion Focus: Instead of testing for purchases, teams may test for "Add to Cart" or "Sign Up" actions. These higher-frequency events provide more data points, increasing power at the cost of being one step removed from final revenue.
- Intentional MDE Elevation: By only aiming to detect lifts of 15% or 20%, companies can conclude tests faster. This effectively turns the experimentation program into a "swing for the fences" strategy, ignoring incremental gains in favor of transformative changes.
- Audience Segmentation: Concentrating a test on a high-intent segment, such as mobile users or returning visitors, can sometimes reduce variance and provide a clearer signal, though the results may not be generalizable to the entire site population.
Conclusion and Broader Impact
Statistical power is the silent engine of a successful experimentation culture. Without it, data-driven decision-making becomes a form of "theatre," where significance levels provide a false sense of security while true opportunities are discarded. By integrating rigorous power analysis into the pre-test phase, organizations protect themselves from the twin risks of false positives and unrealized gains. As the digital marketplace becomes increasingly optimized, the competitive advantage will shift toward those who understand not just how to run a test, but how to ensure their tests are sensitive enough to find the truth. Professional integrity in data analysis requires a commitment to power, ensuring that every experiment is a reliable step toward genuine growth.







