

Statistical power represents the silent engine of the modern data-driven enterprise, serving as the primary determinant of whether an experiment can reliably detect a meaningful business impact. In the high-stakes environment of digital optimization, many organizations focus exclusively on statistical significance—the protection against false positives—while neglecting the equally critical factor of power, which protects against false negatives. When statistical power is insufficient, a test may return a "non-significant" result even when a variation is genuinely superior, leading companies to discard profitable innovations and stagnate in their growth trajectories. By understanding the interplay between sample size, effect size, and variance, organizations can move beyond "peeking" at results and instead build a rigorous experimentation culture that captures every available percentage of lift.
The Foundational Mechanics of Statistical Power
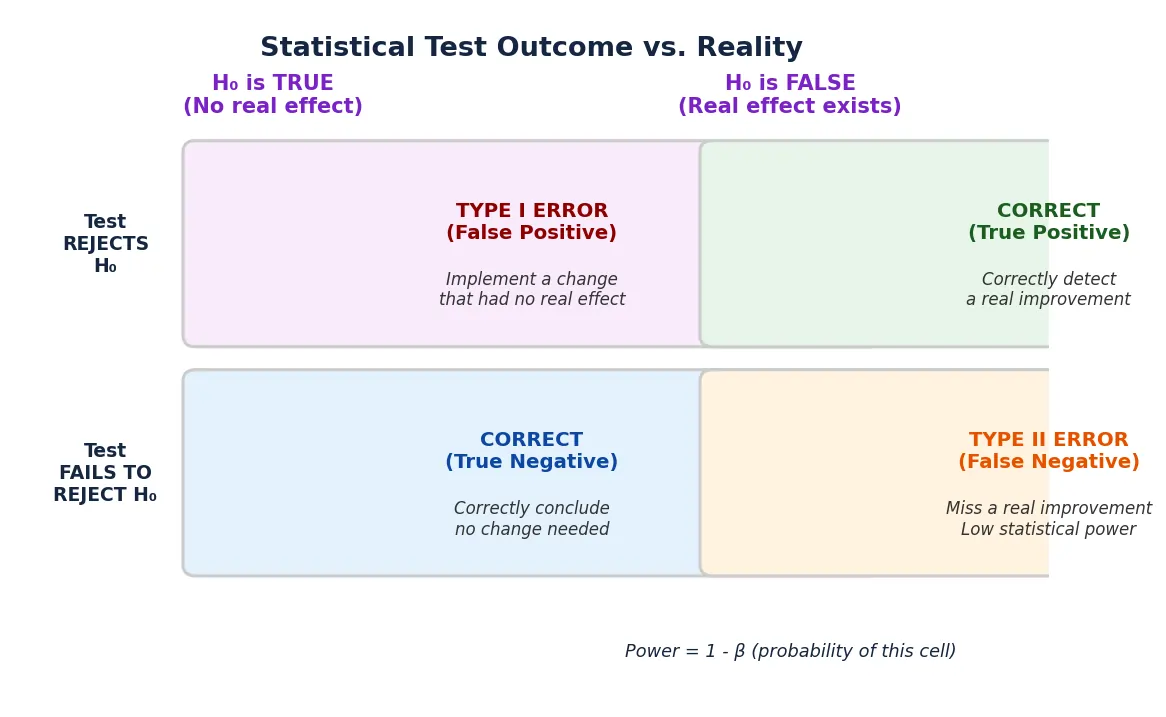
In the realm of frequentist statistics, power is formally defined as the probability of rejecting the null hypothesis when the alternative hypothesis is true. Expressed mathematically as $1 – beta$, where $beta$ represents the Type II error rate, power dictates the sensitivity of an experiment. For example, a test designed with 80% power has an 80% chance of detecting an effect of a specific size, assuming that effect actually exists. Conversely, it carries a 20% risk of a "false negative," where a winning variation is incorrectly labeled as having no impact.

While statistical significance (alpha) is often set at 5% to ensure that "winners" are not merely the result of random noise, power is the lever that determines the volume of traffic required to reach that conclusion. Industry experts frequently observe a "power crisis" in digital marketing, where tests are launched without a prior power analysis. In these scenarios, teams often run experiments for arbitrary durations, see no significant movement, and conclude that their hypothesis was incorrect. In reality, the experiment may have been underpowered, meaning it was mathematically incapable of detecting a 2% or 3% lift—gains that, while subtle, could translate into millions of dollars in annual recurring revenue (ARR).
The Four Determinants of Experimental Sensitivity
The sensitivity of any A/B test is governed by four interconnected factors. Adjusting one inevitably requires a trade-off in the others, creating a delicate balancing act for data scientists and growth leads.
1. Sample Size (N)
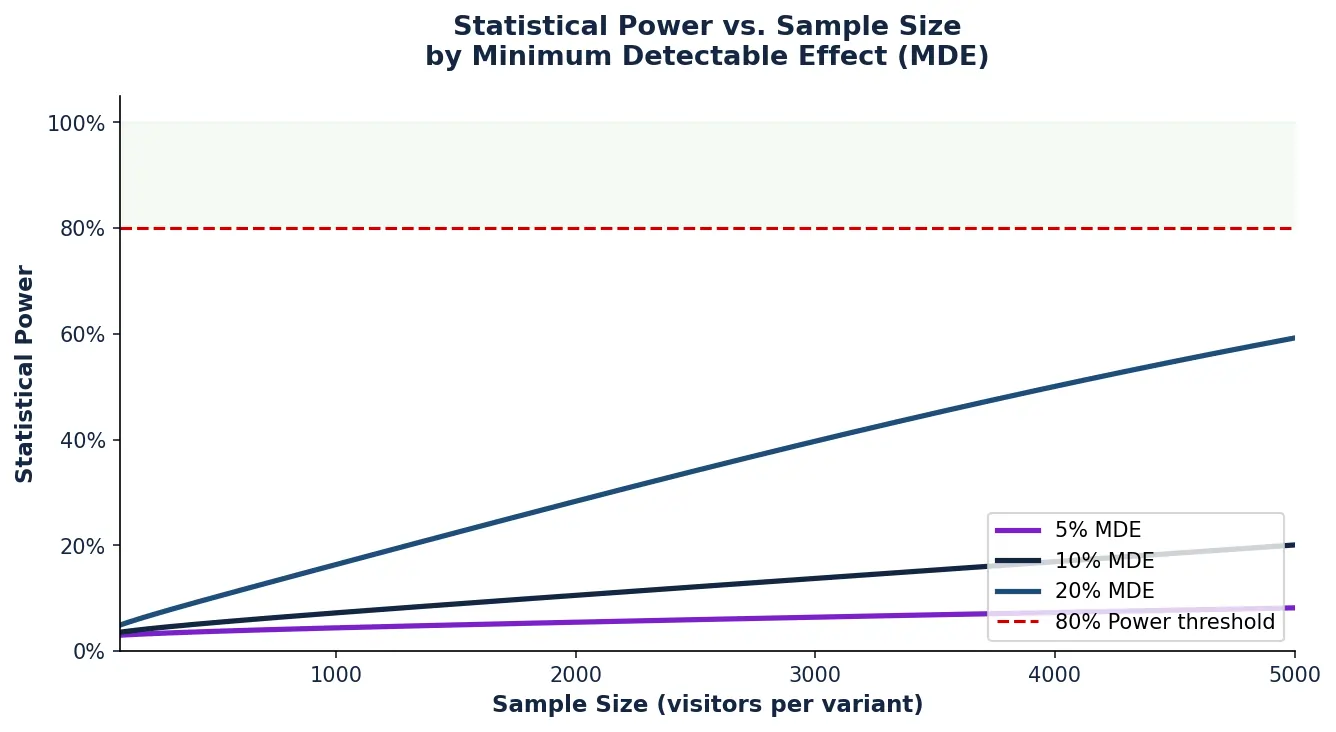
The most direct way to increase power is to increase the number of participants in a test. Larger sample sizes reduce the impact of random outliers and "smooth out" the data, making it easier to distinguish a true effect from background noise. For high-traffic websites, reaching 90% or 95% power is often a matter of waiting a few weeks; however, for lower-traffic B2B sites or specific landing pages, sample size remains the primary bottleneck to rigorous testing.

2. Minimum Detectable Effect (MDE)
The MDE is the smallest relative lift that an organization deems worth detecting. There is an inverse relationship between the MDE and the required sample size: to detect a massive 20% lift, very little data is needed; to detect a 1% lift, the sample size requirements grow exponentially. Setting an unrealistic MDE is a common pitfall; if a team sets an MDE of 10% but the actual lift is 4%, an underpowered test will likely return an inconclusive result, leading to the "hidden loss" of that 4% improvement.
3. Significance Level (Alpha)
This is the threshold for evidence. By default, most industries use a 95% confidence level (alpha = 0.05). If an organization demands higher certainty—such as a 99% confidence level to avoid any risk of a false positive—the statistical power of the test will decrease unless the sample size is increased proportionally. This tension between "being sure" and "being sensitive" is a central theme in experimental design.
4. Data Variability and Variance
Variance refers to the "noise" or fluctuation within the data set. In conversion rate testing, variance is relatively contained because the outcome is binary (yes or no). However, in revenue-based metrics, variance can be extreme. A single "whale" customer making a $5,000 purchase in the control group can skew the results of a test where the average order value (AOV) is $50. High variance necessitates significantly larger sample sizes to achieve the same power as a low-variance conversion test.
A Chronological Workflow for Pre-Test Power Analysis
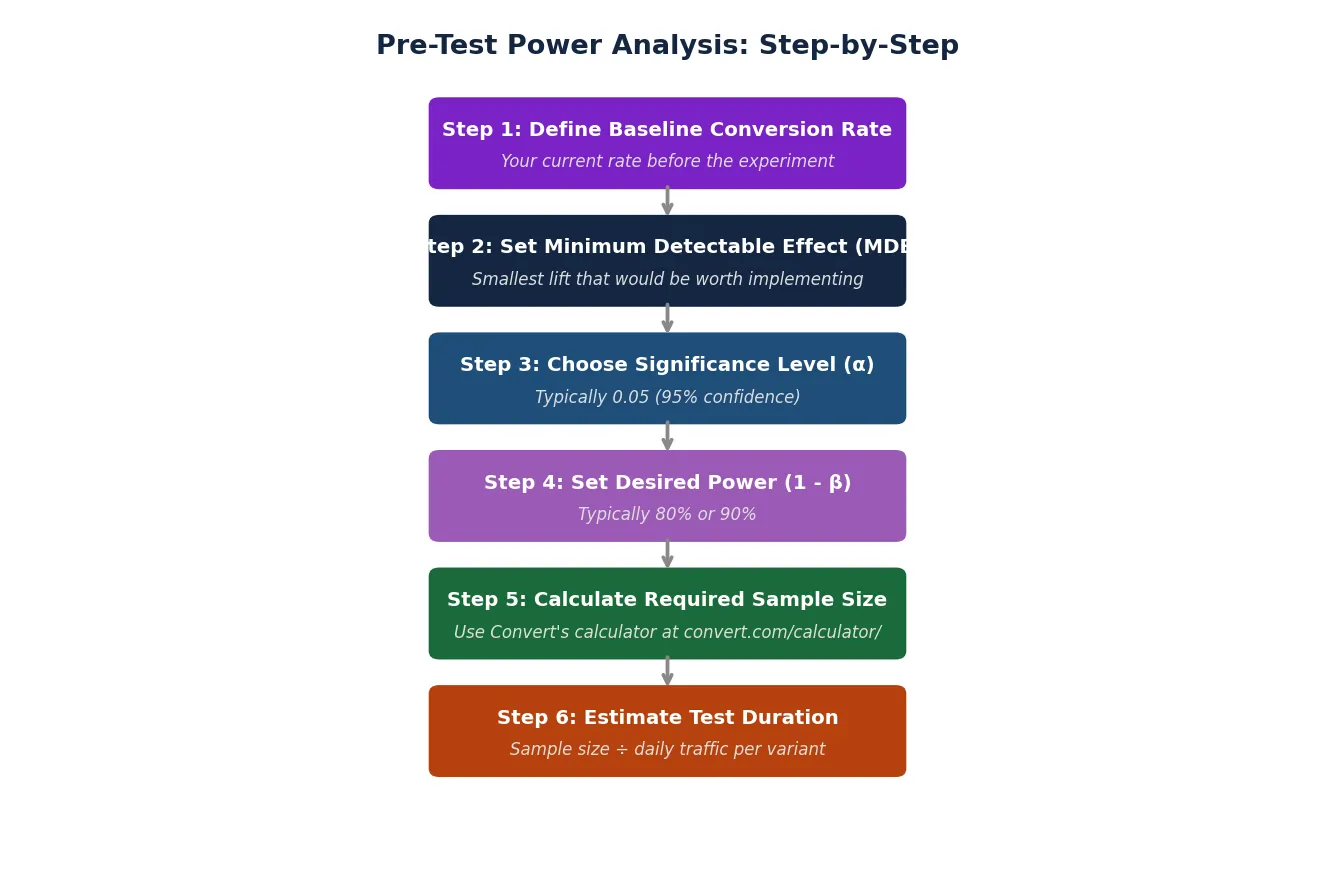
To avoid the pitfalls of underpowered experimentation, rigorous organizations follow a standardized chronology before any code is deployed or any traffic is diverted.
Step 1: Establishing the Baseline
Before calculating power, the team must establish a stable baseline conversion rate (CVR) using historical data. This usually involves auditing the last 30 to 90 days of performance for the specific segment being tested. Using industry benchmarks is discouraged, as internal fluctuations in traffic quality can render external data irrelevant.
Step 2: Defining the MDE Based on ROI
Rather than choosing an MDE at random, strategic teams calculate the "break-even" point. If a new feature costs $50,000 to maintain annually, the MDE should be set at the level of lift required to cover that cost and provide a return on investment. If the traffic cannot support that MDE within a reasonable timeframe, the test may not be worth running.
Step 3: Selecting Alpha and Beta Parameters
The team must decide on their risk tolerance. While 80% power and 95% confidence are standard, high-risk deployments (such as a complete checkout overhaul) may require 90% power and 99% confidence to ensure the business does not inadvertently harm its primary revenue stream.
Step 4: Sample Size and Duration Estimation
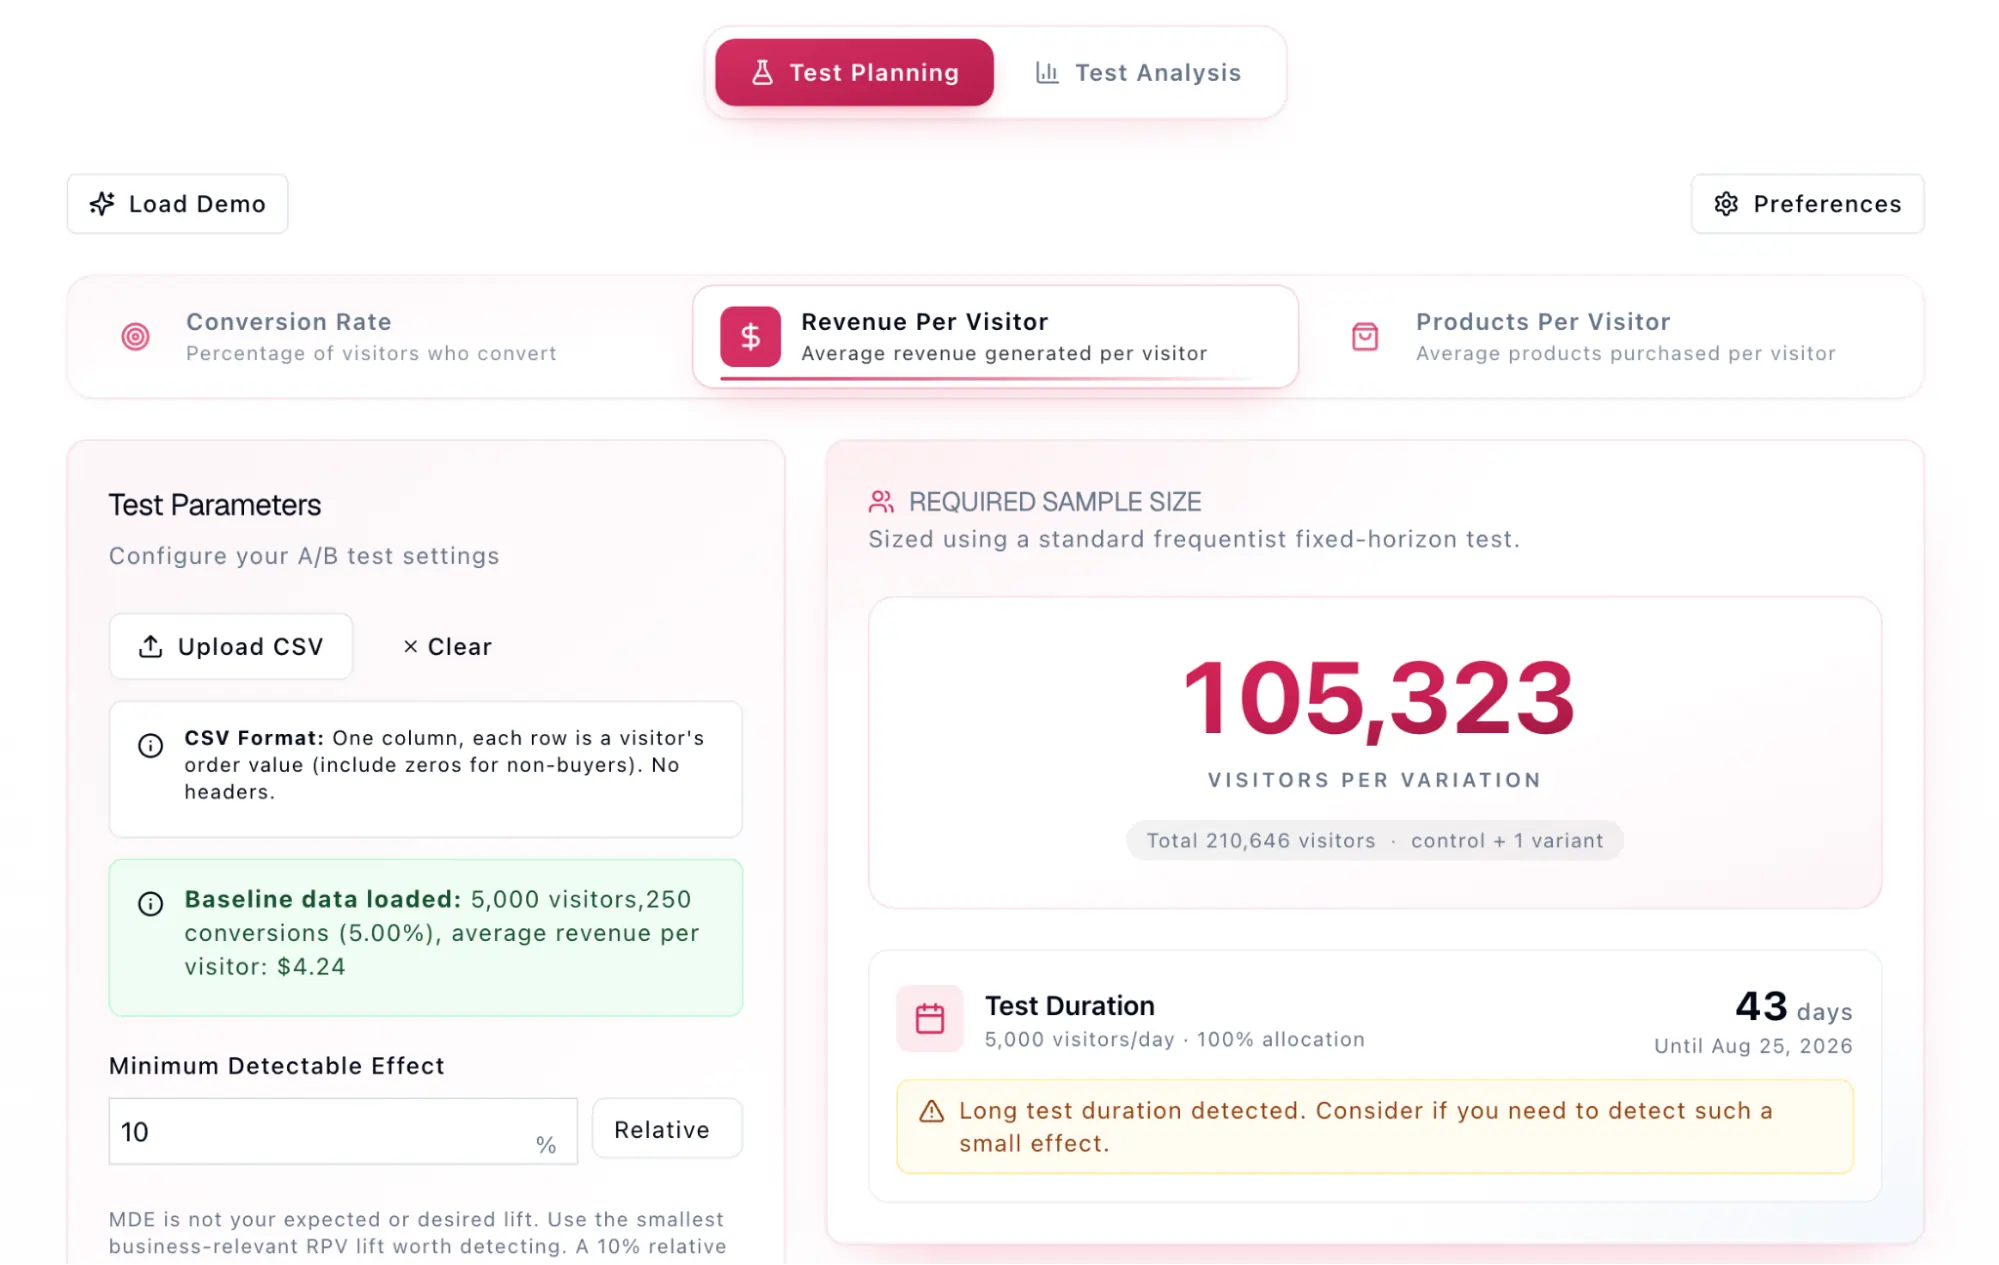
Using a power calculator, the team inputs the baseline, MDE, alpha, and power to generate the required sample size per variation. By dividing this number by the average daily traffic, they arrive at a fixed duration. Journalistic rigor in data science dictates that this duration must be respected; "stopping early" because a result looks promising is a violation of frequentist principles that inflates the false positive rate.
The Economic Implications of Underpowered Testing
The financial consequences of ignoring statistical power are often invisible but devastating. Consider a SaaS company generating $12 million in annual revenue. A product team designs a new onboarding flow that, in reality, improves retention-to-paid conversion by 3%. However, the team runs an underpowered test designed only to catch a 10% lift.
When the test concludes, the results are non-significant. The team discards the new flow, assuming it had no value. That 3% missed lift represents $360,000 in lost revenue in the first year alone. Because SaaS revenue compounds through renewals and expansions, the five-year "true cost" of that single underpowered test could exceed $2 million. This phenomenon highlights that an inconclusive result is not a "neutral" outcome; it is often a failure of measurement that leaves money on the table.
Furthermore, low power contaminates the "winner’s circle." In a landscape of underpowered tests, a high percentage of statistically significant results are actually false positives. This is known as the "Winner’s Curse" or effect-size exaggeration. When a test has low power, it can only reach significance if it happens to catch a massive, lucky swing in the data. Consequently, the "15% lift" reported by an underpowered test often disappears entirely once the feature is rolled out to the full audience.
Comparative Analysis: Power Across Statistical Methods
The management of power varies significantly depending on the underlying statistical framework used by the enterprise.
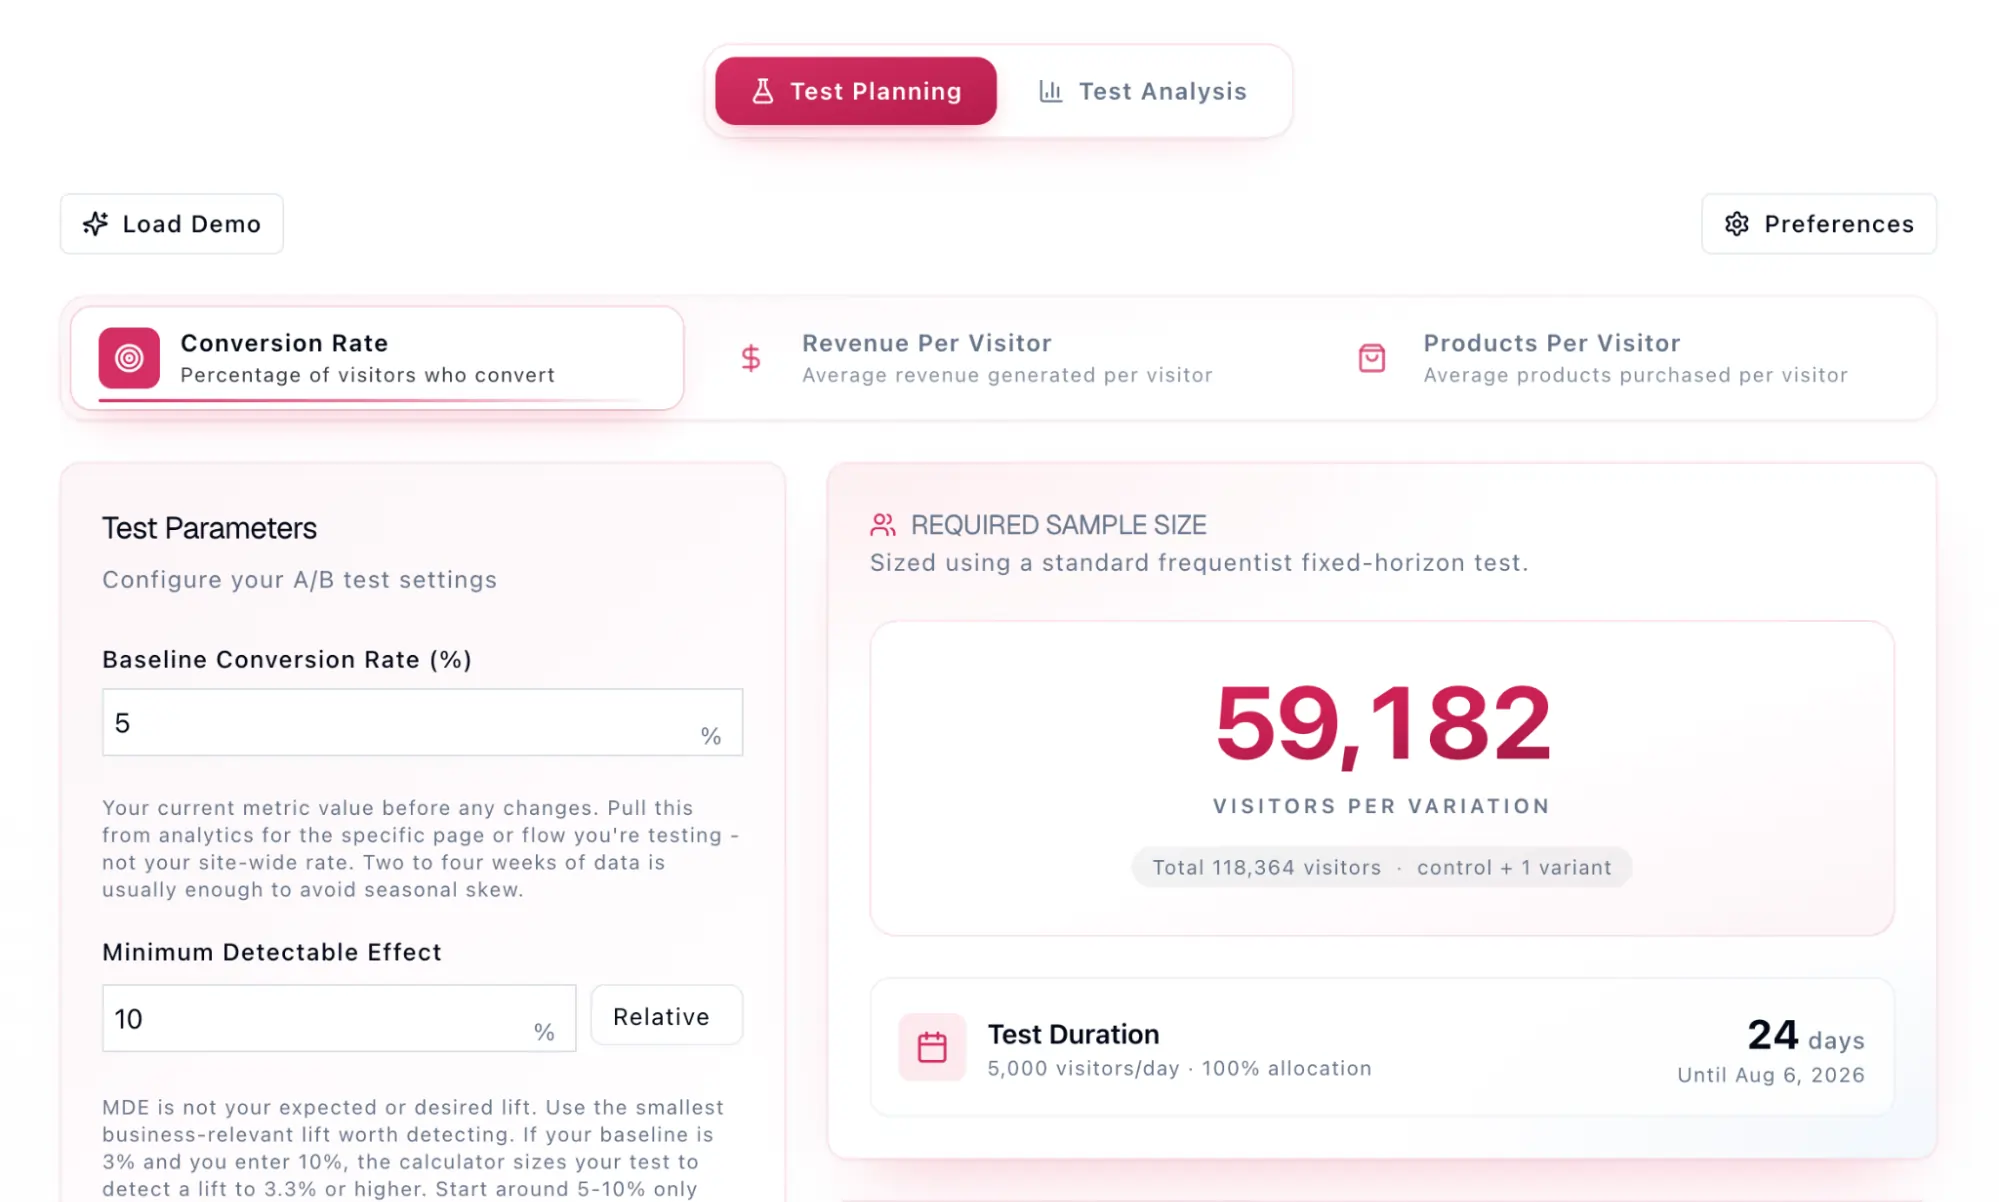
- Frequentist Approach: This is the most rigid and traditional method. It requires a fixed sample size determined in advance. Power is a pre-test calculation, and the results are only valid if the test runs to completion. Its primary advantage is its clear guardrails against false positives.
- Sequential Testing: Increasingly popular in agile software development, sequential testing allows for continuous monitoring. It uses "alpha spending functions" to adjust significance boundaries over time. While it can allow for earlier stopping if an effect is massive, it still requires a "planned horizon" to ensure the test maintains adequate power to detect smaller effects.
- Bayesian Statistics: Bayesian models move away from the binary "significant vs. non-significant" framework. Instead, they provide the "probability of beating the control." While the term "power" is less common in Bayesian circles, the concept of "sensitivity" remains. A Bayesian test with too little data will simply report a high level of uncertainty (a wide credible interval), effectively signaling that the test is underpowered without using the frequentist terminology.
Strategic Mitigations for Low-Traffic Scenarios
Not every business has the luxury of millions of monthly visitors. When a power analysis reveals that a test would require six months to reach 80% power, teams must employ alternative strategies:
- The "Big Bet" Strategy: Instead of testing a button color (which might yield a 0.5% lift), low-traffic sites should test radical changes to value propositions or page layouts. These are more likely to produce the large effects (15-20% lift) that low-traffic tests are actually powered to detect.
- Micro-Conversion Tracking: If "Purchases" are too infrequent to reach power, teams can test against "Add to Cart" or "Email Signup" events. While these are "proxy metrics," their higher frequency allows for much faster power accumulation.
- Acceptance of Higher Risk: In some cases, a business may decide to accept 60% power or a 10% alpha. This is a legitimate business decision, provided the stakeholders understand that they are trading scientific certainty for experimental velocity.
- Sequential Monitoring: Utilizing tools that support sequential valid stopping can help teams capture "home run" wins quickly while acknowledging that "base hits" will require the full duration.
Conclusion and Future Outlook
As the field of digital experimentation matures, the focus is shifting from simply "running tests" to "maximizing the return on every visitor." Statistical power is the metric that ensures this return is not left to chance. By conducting rigorous pre-test analyses, respecting the impact of variance on revenue metrics, and understanding the true financial cost of false negatives, organizations can transform their experimentation programs from a series of "coin flips" into a precise instrument for growth.
The future of this field likely lies in automated power adjustment and AI-driven variance reduction techniques, such as CUPED (Controlled-experiment Using Pre-Experiment Data). These methods allow companies to "squeeze" more power out of the same amount of traffic, effectively making tests more sensitive without increasing duration. Until then, the fundamental principles of power analysis remain the most reliable safeguard for any data-driven professional.







