
In the contemporary global economy, the balance of power has shifted decisively toward the consumer, who is now characterized as impatient, highly informed, and perpetually one click away from a competitor. Within this high-stakes environment, managing a brand without clear visibility into the customer journey is no longer a viable strategy; it is, at best, a series of educated guesses. Customer experience (CX) Key Performance Indicators (KPIs) have emerged as the essential sensors that transform the "black box" of consumer behavior into a high-definition dashboard of actionable insights. These metrics do more than track vanity scores; they reveal precisely where friction accumulates, where brand loyalty is forged, and where potential revenue is quietly leaking from the sales funnel.

The evolution of customer experience measurement reflects a broader shift in corporate strategy from product-centricity to experience-centricity. As digital transformation accelerates, the ability to translate human behavior into measurable business outcomes has become the primary differentiator between market leaders and those struggling to maintain relevance. To understand the current landscape of CX KPIs, one must look beyond simple satisfaction scores and examine the multi-dimensional data points that define the modern relationship between a brand and its audience.
The Strategic Importance of CX Metric Tracking
The impetus for tracking CX KPIs is rooted in the financial reality of the modern marketplace. Research indicates that 86% of buyers are willing to pay a premium for a superior customer experience. Conversely, the cost of failure is steep, with data suggesting that 49% of loyal customers will abandon a brand after a single poor experience. By consistently monitoring these metrics, organizations can move from a reactive posture to a proactive one.
Strategically, these KPIs allow businesses to pinpoint friction by identifying specific "bottlenecks" in the journey—such as a cumbersome checkout process or an unintuitive navigation menu—before they result in significant customer loss. Furthermore, these metrics serve as an early warning system for dissatisfaction. Dips in satisfaction scores often precede churn, allowing teams to intervene and resolve issues before they become terminal. Perhaps most importantly, CX data provides a factual basis for resource allocation. Rather than debating which product features to develop based on internal opinions, leadership can utilize real-world data to prioritize the needs of their most valuable segments.
A Chronology of CX Measurement Evolution
The methodology for measuring customer sentiment has undergone a significant transformation over the last three decades. In the 1990s, measurement was largely retrospective, relying on long-form mail-in surveys and focus groups that provided data weeks or months after the fact. The early 2000s saw the introduction of the Net Promoter Score (NPS), popularized by Fred Reichheld and Bain & Company, which simplified sentiment into a single, forward-looking question.

By the mid-2010s, the rise of SaaS and e-commerce necessitated real-time metrics like Customer Effort Score (CES) and First Contact Resolution (FCR). Today, the industry has entered the era of predictive CX. Modern platforms now consolidate behavioral data, sentiment analysis, and interaction history into "Customer Health Scores," allowing companies to predict churn before a customer even realizes they are dissatisfied. This timeline illustrates a move from historical reporting to real-time intervention and, finally, to predictive modeling.
Detailed Walkthrough of Essential CX KPIs
To construct a balanced view of the customer journey, businesses must track a diversified set of metrics covering loyalty, satisfaction, effort, and operational efficiency.
1. Net Promoter Score (NPS)
NPS remains the gold standard for measuring long-term brand advocacy. It asks a singular question: "On a scale of 0 to 10, how likely are you to recommend our company to a friend or colleague?" Respondents are categorized into Promoters (9-10), Passives (7-8), and Detractors (0-6). The final score is derived by subtracting the percentage of Detractors from the percentage of Promoters. While a score above 50 is generally considered excellent, the true value of NPS lies in the qualitative feedback provided by "Passives," who often highlight the minor pain points preventing them from becoming brand advocates.
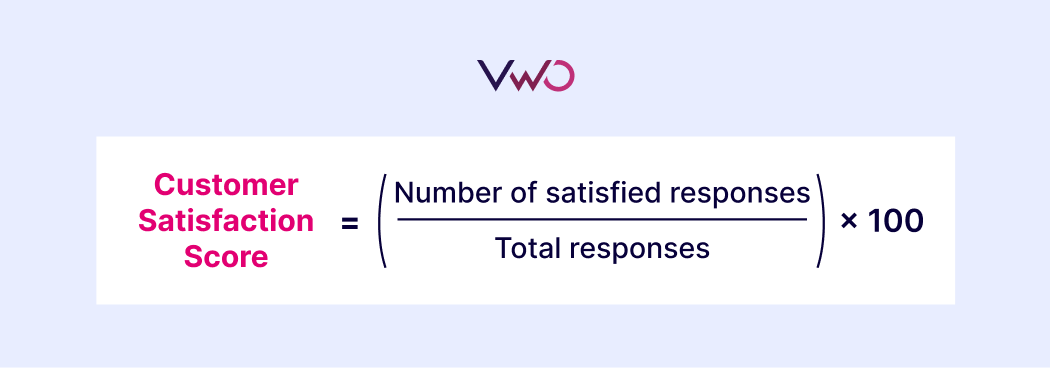
2. Customer Satisfaction Score (CSAT)
Unlike the broad focus of NPS, CSAT measures immediate happiness following a specific interaction, such as a support call or a completed purchase. It is the most direct measure of the "here and now." Because it captures feedback in real-time, it allows service teams to identify technical failures or staffing shortages immediately. For example, if a support team’s CSAT drops from 90% to 70% in a single week, it serves as an immediate signal of a recurring operational issue.
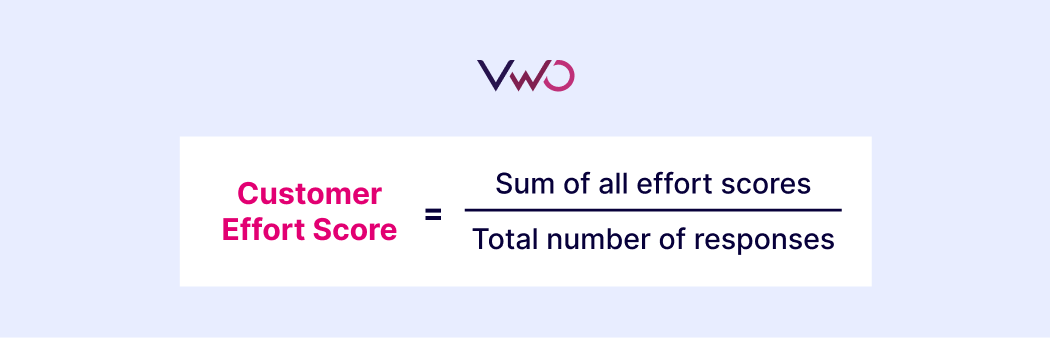
3. Customer Effort Score (CES)
CES is a newer, highly predictive metric that assesses the ease of an experience. It focuses on the premise that loyalty is built not just by "wowing" customers, but by making their lives easier. By asking customers to rate the statement "The company made it easy for me to handle my issue," brands can identify high-friction touchpoints. High-effort experiences are among the strongest leading indicators of future churn.
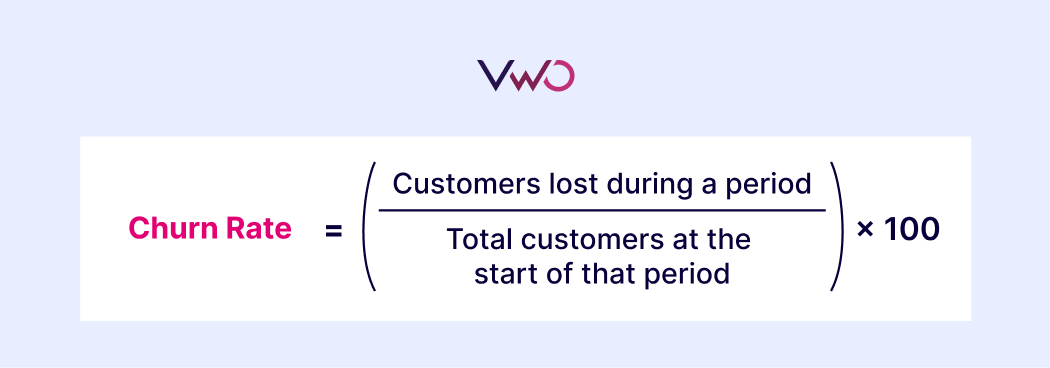
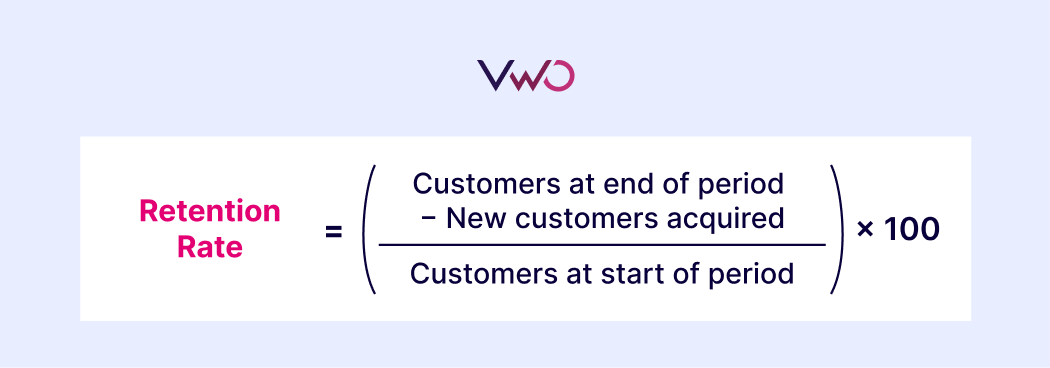
4. Churn and Retention Rates
These are the financial bookends of the customer experience. Churn rate measures the percentage of customers who stop doing business with a company over a specific period. Retention rate, conversely, measures the ability to keep them. A rising churn rate is often a lagging indicator, suggesting that problems identified in CES or CSAT were not addressed in time.
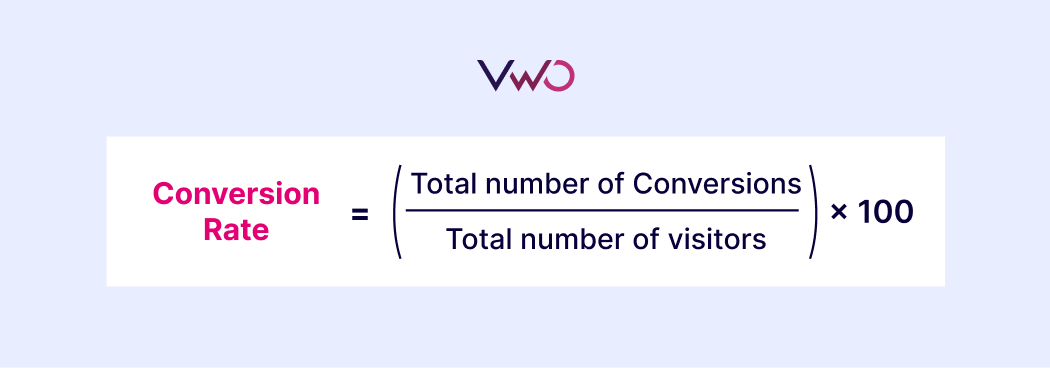
5. Conversion Rate
While traditionally viewed as a marketing metric, the conversion rate is increasingly recognized as a vital CX KPI. Friction in the user interface, unclear value propositions, or a confusing checkout flow will directly suppress conversion rates. Improvements in the "user experience" (UX) almost always manifest as a lift in conversion data.
6. Support Efficiency: FCR and ART
First Contact Resolution (FCR) and Average Response Time (ART) measure the health of the support ecosystem. In an era where 69% of consumers expect a response within 24 hours, speed (ART) and effectiveness (FCR) are non-negotiable. High FCR scores indicate empowered agents and streamlined internal processes, both of which are essential for maintaining trust during a crisis.
Case Studies in Experience Optimization
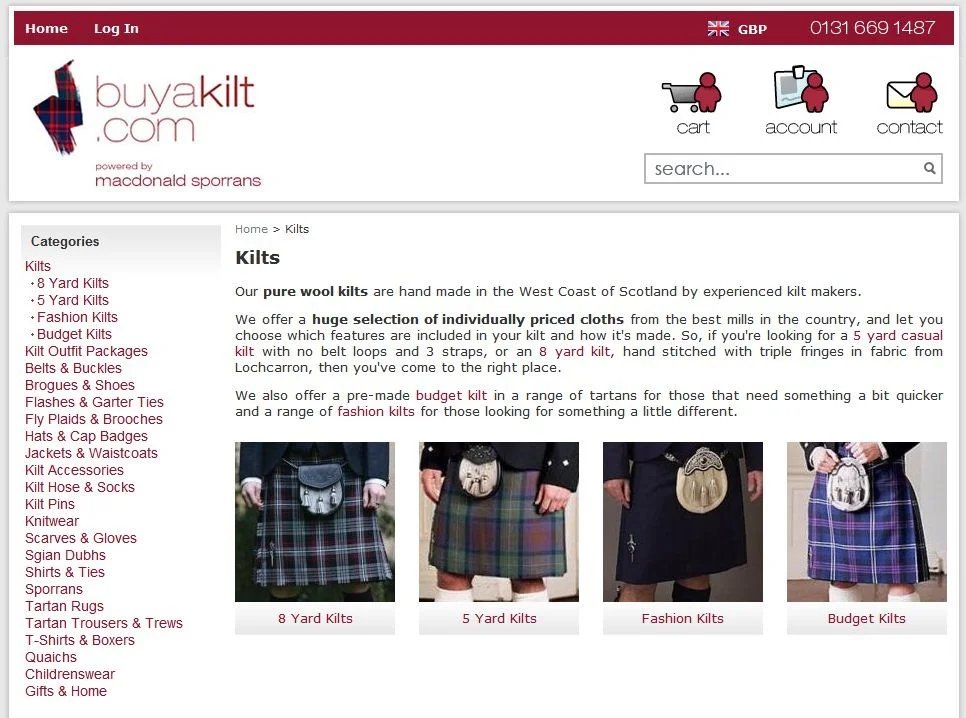
The impact of CX optimization is best illustrated through real-world applications. For instance, Buyakilt.com, an online retailer of Scottish Highland dress, utilized behavioral insights to identify friction in their product discovery phase. By implementing a product filter that allowed users to shop by specific attributes, they achieved a 26% increase in conversions and a nearly 20% rise in shopping cart visits. This demonstrates that simplifying the customer journey—lowering the Customer Effort Score—directly correlates with revenue growth.
In the hospitality sector, Orascom Hotels utilized personalization to enhance the customer experience. By serving localized summer offers tailored to the user’s language and location, they generated $352,377 in revenue, accounting for 42% of total sales during the campaign period. This highlights the role of "relevance" as a component of the customer experience; when a brand provides exactly what a customer needs at the right moment, the likelihood of conversion increases exponentially.
Analysis of Broader Business Implications
The data suggests that the "experience economy" is not a temporary trend but a fundamental restructuring of how value is created. Companies that excel in CX outperform their peers on the S&P 500 by a significant margin. This is because high-quality experiences create a "moat" around a business that is difficult for competitors to breach through pricing alone.
Furthermore, the integration of Artificial Intelligence (AI) into CX measurement is beginning to automate the "Insight to Action" cycle. AI-powered metrics can now monitor form submissions, revenue conversions, and click patterns in real-time, offering recommendations for A/B testing or personalization. The future of CX lies in "Hyper-Personalization," where the experience is not just reactive but anticipates user needs based on historical behavior and predictive analytics.
Conclusion: Moving from Measurement to Impact
Tracking CX KPIs is the first step in a larger journey toward organizational excellence. However, measurement in isolation does not drive growth; the value is found in the subsequent action. Successful organizations use these metrics to bridge the gap between departments—aligning marketing, sales, and support under a single, customer-centric goal.
As businesses look toward the future, the focus will likely shift toward "Customer Health Scores" (CHS), particularly in the SaaS and subscription sectors. By consolidating product usage, engagement trends, and sentiment into a single predictive score, companies can manage the customer lifecycle with unprecedented precision. In the modern marketplace, where the customer is always one click away from leaving, the ability to listen to the data, reduce friction, and deliver personalized value is the only sustainable path to long-term profitability and brand resilience. For any organization seeking to thrive, customer experience is no longer a "soft" metric; it is the primary engine of economic growth.