The Evolving Landscape of Instagram Analytics
In an era dominated by digital presence, Instagram has solidified its position as a powerhouse for brand building, community engagement, and direct commerce. With over 2 billion monthly active users globally, it represents a fertile ground for businesses to connect with their target audiences. However, this immense potential is accompanied by a complex data landscape. Historically, many brands focused on “vanity metrics” such such as raw follower count or total likes, which, while visually appealing, often provided limited insight into actual business performance or return on investment (ROI). The shift towards data-driven marketing necessitates a more sophisticated approach, demanding metrics that directly correlate with strategic goals, whether those involve brand awareness, audience engagement, or direct conversions. Understanding and prioritizing these actionable metrics is crucial for refining content strategies, optimizing ad spend, and ultimately, driving sustainable growth.

Defining Instagram Metrics: Beyond Superficial Engagement
Instagram metrics are quantifiable data points that reflect the performance of an Instagram account, its content, and the efficacy of its marketing initiatives. These metrics offer a granular view into various aspects, from audience demographics and content reach to user interaction and conversion pathways. They can be broadly categorized into performance indicators for individual posts (e.g., comments, likes) and those reflecting overall account health and growth (e.g., follower count, engagement rate). The strategic importance of these metrics lies in their ability to provide objective feedback, enabling marketers to identify successful strategies, pinpoint areas for improvement, and adapt their approach in real-time. By consistently tracking and analyzing these indicators, businesses can ensure their Instagram presence is not merely active but strategically impactful, contributing directly to overarching business KPIs.
The Nine Pillars of Instagram Success for 2026

For 2026, a focused approach to Instagram analytics is recommended, emphasizing metrics that offer genuine insights into performance and potential. The following nine metrics represent the cornerstone of a robust Instagram strategy, offering a balanced view across awareness, engagement, and conversion objectives.
| Metric | Category | What it Measures | Benchmark (as of 2026) |
|---|---|---|---|
| Follower Growth Rate | Awareness | How quickly your account is gaining or losing followers | 1-2% |
| Reach and Reach Rate | Awareness | The number of unique people who saw your content | 12% for posts, 2% for Stories |
| Reel Shares | Awareness | How many times your Reels are shared | Varies by audience |
| Engagements by Follower | Engagement | Average number of interactions per follower | 1-3% average, 5%+ is strong |
| Engagements by Reach | Engagement | Percentage of viewers who engaged with your content | 5%+ |
| Website Traffic | Conversion | How many visitors came to your website from Instagram links | Varies by audience |
| External Link Taps (Posts) | Conversion | Clicks on links in your bio or product tags | Varies by audience |
| Link Clicks (Stories) | Conversion | Clicks on links in your Instagram Stories | Varies by audience |
Awareness Metrics: Expanding Your Brand’s Footprint
-
Follower Growth Rate: This metric quantifies the speed at which an Instagram account is attracting or losing followers. While the absolute number of followers can be a “vanity metric,” the rate of growth is a powerful indicator of content strategy effectiveness and brand resonance with the target audience. A consistent increase suggests successful content campaigns and expanding brand visibility.
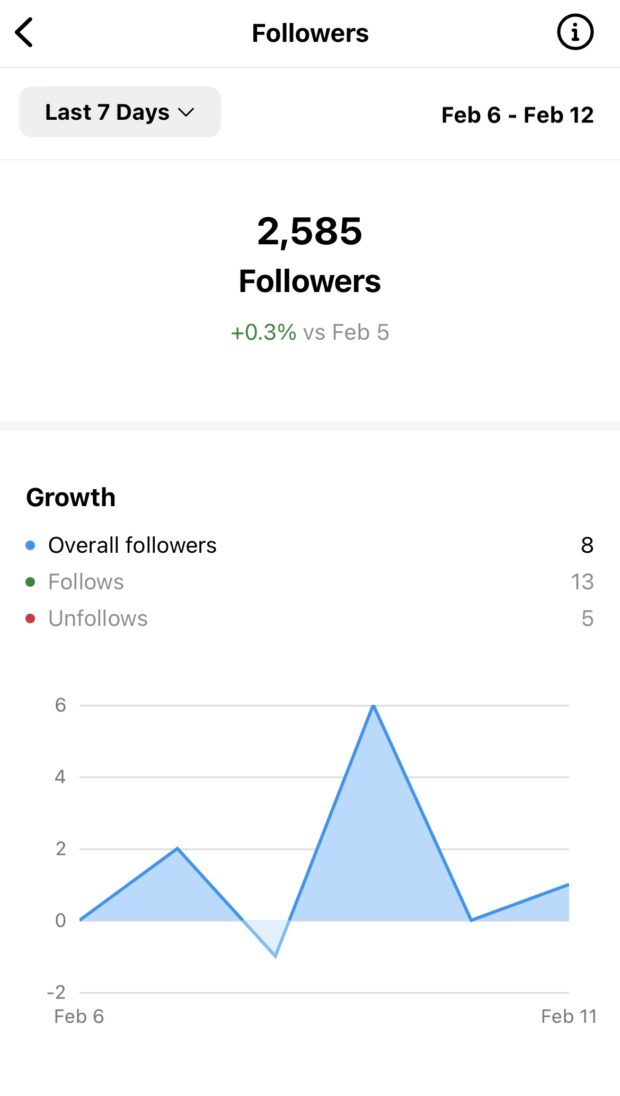
- Importance: A healthy follower growth rate signifies expanding brand discoverability and increasing audience interest. It moves beyond mere presence to indicate genuine momentum. Tracking net follower growth (new followers minus lost followers) provides a more accurate picture of audience retention.
- Benchmark (2026): A desirable follower growth rate typically falls between 1% and 2% per month. Brands exceeding this often demonstrate highly effective content and engagement strategies.
- Implications: A declining or stagnant growth rate signals a need to re-evaluate content pillars, audience targeting, or competitive strategies. Conversely, strong growth can justify increased investment in Instagram marketing.
-
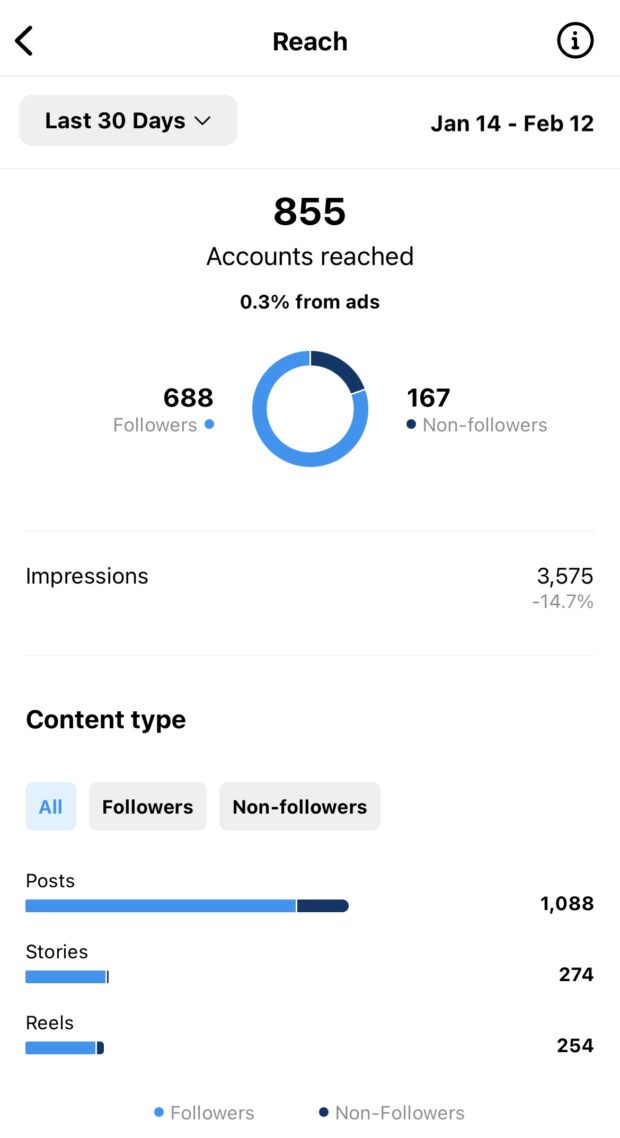
Reach and Reach Rate: Reach measures the total number of unique accounts that have viewed a specific piece of content. Unlike impressions, which count every view (even multiple views by the same person), reach focuses on individual exposure, making it a more accurate gauge of audience breadth. Reach rate further refines this by expressing reach as a percentage of your total followers.
- Importance: High reach indicates that the Instagram algorithm is favoring your content, pushing it to a wider audience, including non-followers. A strong reach rate suggests your content is resonating enough to break through the algorithmic noise.
- Benchmark (2026): For larger brand accounts, an average reach rate of 12% for feed posts and 2% for Stories is considered a solid performance. Variations exist based on industry and content type.
- Implications: Maximizing reach is fundamental for brand visibility and top-of-funnel awareness. Low reach suggests content isn’t compelling enough for the algorithm or audience, necessitating a review of posting times, content formats, and hashtag strategies.
-
Reel Shares: Instagram Reels have emerged as the platform’s fastest-growing feature, driven by the popularity of short-form video content. While plays and reach are important, Reel shares stand out as a potent awareness metric. A share signifies that a user found the content valuable enough to distribute it to their own network.
- Importance: Shares act as a powerful organic amplification mechanism, potentially doubling or tripling content exposure without additional ad spend. They are a strong indicator of content virality and emotional resonance.
- Benchmark (2026): This metric varies significantly by audience and content type. The goal is to maximize shares, as each share extends reach into new, potentially highly relevant, audiences.
- Implications: Content that garners high shares should be analyzed for common themes, styles, or messaging that resonate deeply with the audience. Replicating successful sharing strategies can significantly boost organic reach and brand discovery.
Engagement Metrics: Cultivating a Connected Audience
-
Engagements by Follower: This metric quantifies the average number of interactions (likes, comments, shares, saves) per follower. It offers a clearer picture of how actively your existing audience is interacting with your content, moving beyond just passive viewing.
- Importance: A high engagement rate by follower suggests a loyal and interested audience. It indicates that your content is not only seen but is also prompting a response, fostering a stronger community around your brand.
- Benchmark (2026): While the average Instagram account sees an engagement rate between 1-3%, anything above 5% is considered exceptionally strong, particularly for established brands.
- Implications: Low engagement by follower could indicate content fatigue, misaligned content with audience interests, or a need for more interactive formats. Analyzing content types that drive higher engagement can inform future content creation.
-
Engagements by Reach: This metric calculates the percentage of unique viewers who engaged with your content. It’s particularly valuable for understanding the performance of content that reaches beyond your immediate follower base, such as ads, Reels, or explore page features.
- Importance: Engagement by reach reveals how compelling your content is to a broader audience, including those unfamiliar with your brand. It’s a strong indicator of content quality and its ability to capture attention in a competitive feed.
- Benchmark (2026): An engagement rate by reach above 5% is generally considered a strong performance, signaling content that effectively captures the attention of both followers and non-followers.
- Implications: This metric is crucial for evaluating paid campaigns and viral content. A high rate indicates that your content successfully converts passive viewers into active participants, a vital step in the customer journey.
Conversion Metrics: Driving Tangible Business Outcomes

-
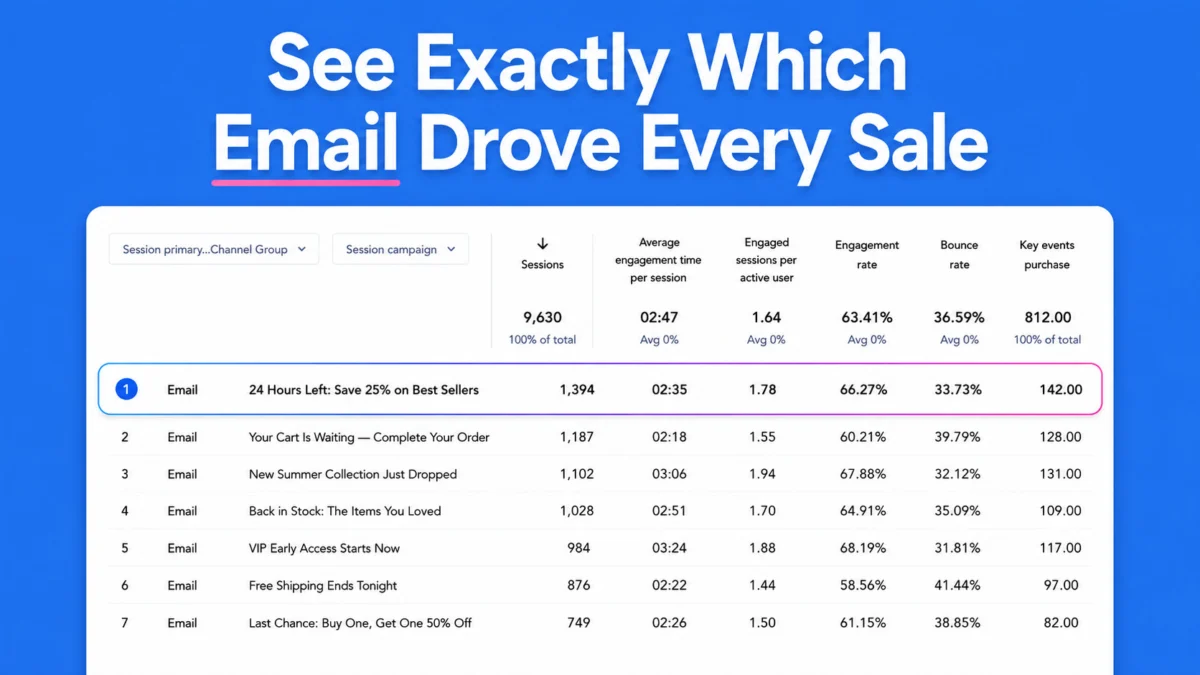
Website Traffic: Social media platforms are often intermediaries, driving users to external digital properties where core business objectives (sales, lead generation, subscriptions) are met. Website traffic from Instagram measures how many users navigate from your Instagram profile or content directly to your website.
- Importance: This is a direct measure of Instagram’s effectiveness in driving off-platform action. It connects social media activity to tangible business outcomes, proving ROI.
- Benchmark (2026): Benchmarks vary widely by industry and campaign goals. The primary objective is continuous growth and optimization. Any traffic is good, but consistent, quality traffic that converts is the ultimate goal.
- Measurement: Google Analytics (via Traffic Acquisition reports), Instagram Insights (for business profiles), and URL shorteners like Hootsuite’s Ow.ly (for detailed tracking parameters) are essential tools for monitoring this metric.
- Implications: Low website traffic from Instagram necessitates a review of call-to-actions (CTAs), link placement strategies (bio, Stories, shopping tags), and the perceived value proposition offered on the website.
-
External Link Taps (Posts): Instagram now provides insights into how many times users click on links directly embedded within feed posts, particularly through product tags or shoppable posts.
- Importance: This metric is critical for e-commerce brands and those looking to directly convert interest into action from static content. It helps understand which products or content types most effectively drive users to external sites.
- Benchmark (2026): There is no universal benchmark, as performance is highly dependent on audience demographics, product relevance, and offer strength. The focus should be on incremental improvement and identifying patterns of success.
- Implications: Analyzing external link taps can reveal effective product presentation methods, compelling imagery, or specific messaging that motivates purchase intent. It’s an invaluable metric for optimizing product discovery and direct sales funnels.
-
Link Clicks (Stories): With the widespread adoption of the “Link” sticker in Instagram Stories, tracking clicks on these embedded URLs has become a vital conversion metric.

- Importance: Instagram Stories offer a dynamic, ephemeral channel for driving immediate action. Link clicks in Stories demonstrate the effectiveness of time-sensitive promotions, new product launches, or quick informational redirects.
- Benchmark (2026): Similar to post link taps, benchmarks vary. Brands should aim for consistent improvement and identify Story formats (e.g., polls, quizzes leading to links, influencer takeovers) that generate higher click-through rates.
- Implications: Optimizing Story content for link clicks involves compelling visuals, clear CTAs, and a sense of urgency or exclusivity. This metric helps refine Story strategy to maximize direct response. Note: This metric specifically tracks clicks on the Link sticker, not general navigation to the bio link from a Story.
The Strategic Imperative: Identifying Your North Star Metric
Beyond these nine critical metrics, a truly strategic approach to Instagram demands the identification of a “North Star Metric” (NSM). Coined by growth hacker Sean Ellis, an NSM is the single, overarching metric that best represents the core value your product or service delivers to customers and, by extension, your long-term business success. It transcends superficial “vanity metrics” and even direct sales figures, aiming to capture the essence of your mission.
For instance, a social media platform might initially track daily active users (a common “bad” NSM if not tied to value). However, if its mission is to foster a more connected world, a “good” NSM would be “meaningful connections made” or “time spent in positive interactions.” Similarly, for an apparel brand focused on sustainability, “sweaters sold” is less impactful than “carbon emissions reduced.”
| Brand | Industry | Bad NSM | Good NSM |
|---|---|---|---|
| Patagonia | Apparel | Sweaters sold | Carbon reduced |
| Social media | Daily active users | Connected communities | |
| Spotify | SaaS, music | Annual subscribers | Time spent listening to music |
| Bumble | SaaS, dating | Premium users | Successful matches |
| Peloton | Exercise, SaaS | Bikes sold | Miles ridden |
| Nike | Apparel | Annual profit | Athletes created |
Your North Star Metric will be unique to your business, reflecting its core purpose. Examples could include:
- For an educational platform: “Hours of learning completed per user.”
- For a SaaS product: “Critical feature adoption rate.”
- For a community-focused brand: “User-generated content submissions.”
Regularly tracking your NSM, alongside the other performance metrics, ensures that Instagram efforts are not just generating activity but actively contributing to your fundamental business mission. It serves as a constant reminder to focus on long-term value creation over short-term gains.
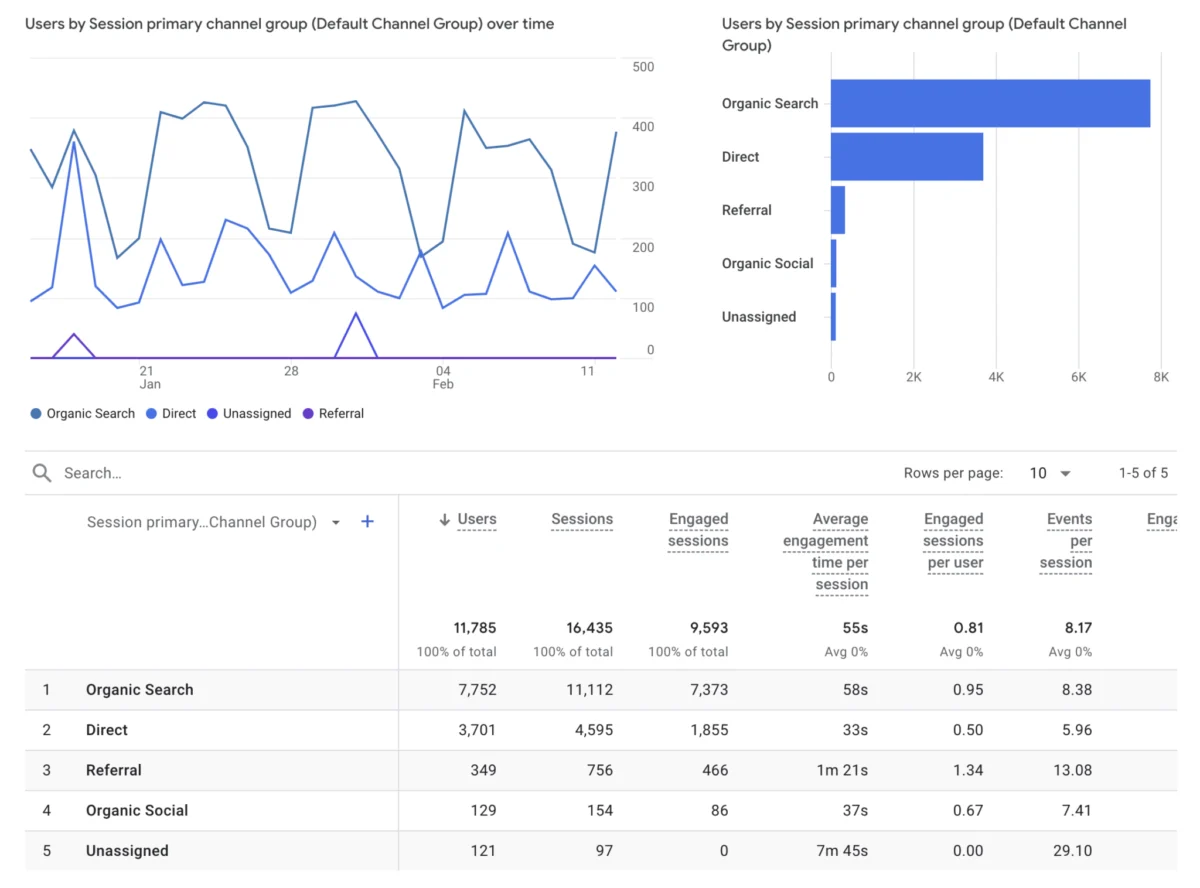
Leveraging Tools for Data-Driven Decisions

Accessing and interpreting these metrics is fundamental. Instagram’s native “Insights” tab, available for business and creator accounts, provides a foundational view of overall account performance and individual post metrics (likes, comments, shares, saves, reach, impressions). To access: Profile -> Professional Dashboard -> Account Insights.
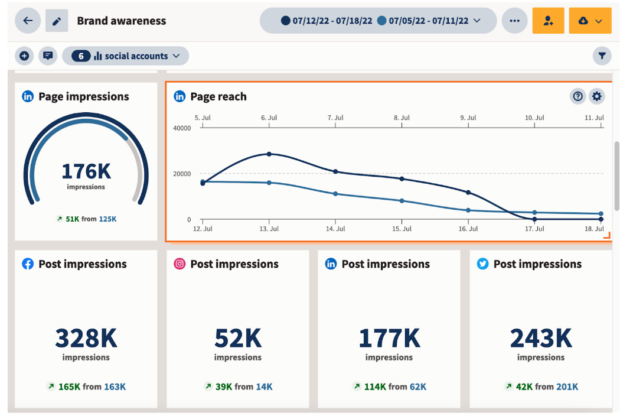
For businesses managing multiple social media platforms or requiring more in-depth analysis, third-party social media management tools become indispensable. Hootsuite Analytics, for example, offers a comprehensive solution to track performance across Facebook, Instagram, X (Twitter), LinkedIn, TikTok, and more, all within a unified dashboard. This integration allows for comparative analysis, identifies cross-platform trends, and streamlines reporting. Hootsuite Analytics enables users to track:
- Overall Account Growth: Follower trends, net growth.
- Content Performance: Reach, impressions, engagement rates across various content types (posts, Stories, Reels).
- Audience Demographics: Age, gender, location, active times.
- Website Clicks and Conversions: Via integrated link shorteners (e.g., Ow.ly) and custom UTM parameters.
- Competitive Benchmarking: Comparing performance against industry averages or competitors.
Customizable dashboards within such tools allow for at-a-glance monitoring of critical metrics, while granular data drilling provides deeper insights into individual post performance. The ability to generate comprehensive, shareable reports is also crucial for communicating results to stakeholders and informing strategic adjustments.
Crafting an Impactful Instagram Strategy: Aligning Metrics with Business Goals
The selection of Instagram metrics must be directly aligned with specific business goals. A simplistic framework involves categorizing objectives and matching them with appropriate metrics:
- Brand Awareness Goals: Focus on Follower Growth Rate, Reach and Reach Rate, and Reel Shares. These metrics indicate how effectively your brand is expanding its visibility and attracting new audiences.
- Audience Engagement Goals: Prioritize Engagements by Follower and Engagements by Reach. These demonstrate the quality of your content and its ability to foster active interaction and community building.
- Conversion and Sales Goals: Emphasize Website Traffic, External Link Taps (Posts), and Link Clicks (Stories). These directly measure Instagram’s contribution to lead generation, sales, and other tangible business outcomes.
Every business is unique, and therefore, the precise mix of metrics will vary. The key is to avoid getting lost in the abundance of data and instead, to identify a concise set of metrics that provide clear, actionable insights into progress toward your strategic objectives. This disciplined approach ensures that Instagram efforts are not just busywork but are contributing meaningfully to the bottom line.

Expert Outlook and Future Implications
The landscape of social media is in constant flux, with new features and algorithmic changes regularly impacting content visibility and user interaction. This dynamism underscores the importance of an adaptive, data-driven analytics strategy. Industry experts consistently highlight that brands capable of quickly identifying and reacting to performance trends will maintain a significant competitive advantage. The focus for 2026 is squarely on metrics that reveal genuine audience value and business impact, rather than superficial popularity. As Instagram continues to integrate more shopping and direct-to-consumer functionalities, the emphasis on conversion metrics will only intensify. Ultimately, brands that master the art of data interpretation and strategic metric tracking will be best positioned to unlock Instagram’s full potential as a powerful engine for growth and customer loyalty.