The United States continues to grapple with an unprecedented public health crisis as opioid-related overdose deaths reach historic levels, prompting data scientists and public health officials to seek more sophisticated methods of tracking and intervention. While narrative journalism has long highlighted the human toll of the epidemic—most notably through the Pulitzer Prize-winning “Seven Days of Heroin” report by the Cincinnati Enquirer—the application of large-scale data analytics is now providing a clearer picture of the patterns, trends, and global standing of this domestic emergency. By synthesizing data from the Centers for Disease Control and Prevention (CDC), the United Nations Office on Drugs and Crime (UNODC), and independent research entities like FiveThirtyEight, a comprehensive profile of the crisis emerges, revealing a multifaceted disaster that is unique in its scale and lethality.
The Evolution of the Opioid Crisis: A Three-Wave Chronology
To understand the current state of the epidemic, it is essential to view it not as a static event but as a developing phenomenon that has evolved through three distinct “waves.” Public health analysts and historians generally categorize the crisis into these chronological stages:
Wave 1: The Prescription Era (Late 1990s)
The crisis began with a significant increase in the prescription of opioids for the treatment of chronic pain. Following the introduction of OxyContin in 1996, pharmaceutical companies reassured the medical community that patients would not become addicted to prescription opioid pain relievers. This led to a surge in prescription rates and a subsequent rise in overdose deaths involving prescription opioids (natural and semi-synthetic opioids and methadone).
Wave 2: The Heroin Transition (2010)
As the medical community and regulators began to crack down on “pill mills” and over-prescription, the supply of pharmaceutical opioids tightened. This created a vacuum for individuals already suffering from opioid use disorder. In 2010, a second wave began, characterized by a rapid increase in overdose deaths involving heroin. Heroin provided a cheaper and more accessible alternative to prescription pills on the illicit market.
Wave 3: The Synthetic Surge (2013–Present)
The third and most lethal wave began in 2013 with significant increases in overdose deaths involving synthetic opioids—particularly those involving illicitly manufactured fentanyl. Fentanyl, a synthetic opioid that is 50 to 100 times more potent than morphine, is often mixed with heroin, cocaine, or counterfeit pills, frequently without the user’s knowledge. This has led to a vertical spike in mortality rates across nearly every demographic in the United States.
Comparative Lethality and Usage Patterns
A critical insight gained from the analysis of drug-use-by-age datasets is the disproportionate lethality of opioids compared to other illicit substances. When examining data provided by FiveThirtyEight, researchers have noted a startling discrepancy between the number of users and the number of fatalities.
While substances such as marijuana and alcohol have high adoption rates across nearly all adult age groups, and drugs like cocaine and crack show a broad demographic spread among older populations, heroin usage remains relatively concentrated. Data indicates that heroin use is most prevalent among the 20–34 age demographic. However, despite having fewer total users than cocaine or methamphetamine, heroin and synthetic opioids account for a much higher percentage of overall drug-related deaths.
This “lethality gap” highlights the inherent danger of opioids. The narrow window between a therapeutic or recreational dose and a fatal dose makes opioids uniquely dangerous. Furthermore, the data suggests that while other drugs may have higher “adoption” rates (the percentage of the population that has used the drug at least once), opioids have a higher “conversion” rate from use to dependency and, ultimately, to overdose.
The United States in a Global Context
When placed on a global stage using UNODC data, the United States is an extreme outlier in terms of overdose mortality. While the drug crisis is often discussed as a universal problem of the modern age, the data shows that the U.S. leads the world in overdose deaths, both in absolute numbers and when adjusted for population.
In a per-million-person comparison, the United States consistently ranks at the top. While countries like Iceland occasionally show high rates due to their very small total populations (where a handful of deaths can skew the “per million” metric), the U.S. remains the epicenter of the epidemic among developed nations. For comparison, while nations such as Sweden and Australia report significant public health challenges regarding drug use, their overdose death rates per million residents are often less than half of those recorded in the United States.
This disparity is attributed to several factors unique to the American landscape:
- Healthcare Infrastructure: The heavy reliance on pharmaceutical interventions for pain management in the U.S. compared to European or Asian counterparts.
- Market Dynamics: The high efficiency of illicit supply chains for synthetic opioids entering North America.
- Socioeconomic Factors: Deep-seated issues in rural and “Rust Belt” communities where economic displacement has been linked to higher rates of “deaths of despair.”
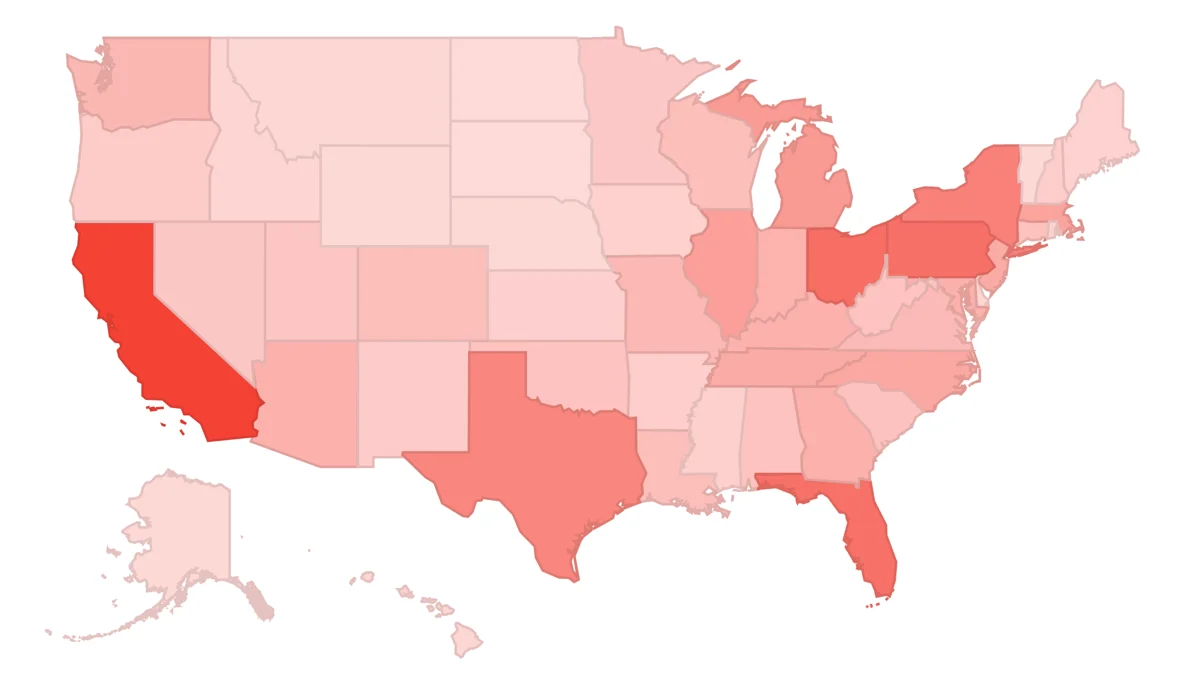
Regional Hotspots and Development Trends
Within the United States, the epidemic is not distributed evenly. CDC data categorized by state reveals specific “hotspots” where the crisis has reached catastrophic levels. Traditionally, the Appalachian region—including states like West Virginia, Ohio, and Kentucky—has been the hardest hit. West Virginia, for instance, has consistently reported the highest overdose death rate in the nation, often double or triple the national average.
However, recent data visualizations show a shifting geography. The Northeast, particularly states like New Hampshire and Massachusetts, saw a massive surge during the transition to fentanyl. Conversely, some states that were early adopters of aggressive prescription monitoring programs and expanded access to Naloxone (an opioid overdose reversal agent) have begun to see a stabilization or a slight decline in growth rates, though total numbers remain high.
The “development trends” in this data are particularly instructive for policymakers. By identifying which states have the worst “momentum”—where death rates are not just high, but accelerating—health departments can better allocate emergency resources and federal funding from initiatives like the NIH HEAL (Helping to End Addiction Long-term) Initiative.
Official Responses and Public Health Strategies
The scale of the data has forced a shift in how federal and state governments respond to the crisis. For decades, the primary response to drug use was through the criminal justice system. However, the data-driven realization that the crisis was rooted in medical over-prescription and a lack of mental health infrastructure has led to a “Harm Reduction” approach.
Key responses include:
- Prescription Drug Monitoring Programs (PDMPs): Electronic databases that track prescriptions of controlled substances, allowing providers to identify “doctor shopping” and over-prescribing.
- Expansion of Naloxone Access: Data showing that most overdoses occur in the presence of others led to laws allowing non-medical personnel to carry and administer overdose-reversal drugs.
- Medication-Assisted Treatment (MAT): Increased funding for methadone and buprenorphine, which data proves significantly reduces the risk of fatal overdose and helps maintain long-term recovery.
- Litigation and Accountability: States and municipalities have used data on pill distribution to launch massive lawsuits against pharmaceutical manufacturers and distributors, resulting in billions of dollars in settlements intended to fund addiction treatment programs.
Broader Socioeconomic Impact and Implications
The implications of the opioid epidemic extend far beyond the healthcare sector. Economists have noted a direct correlation between high opioid prescription rates and a decline in labor force participation among prime-age workers. Furthermore, the foster care system in the United States has been overwhelmed by an influx of children whose parents are incapacitated by addiction or have died from overdoses.
The use of data visualization tools, such as Google Data Studio, has become vital for non-experts to grasp the immensity of these impacts. By transforming raw numbers into trends and patterns, analysts can communicate the urgency of the problem to the public and to legislators who control the budget for public health interventions.
As the United States enters the mid-2020s, the focus remains on the “Fourth Wave”—the rise of “polysubstance” use, where opioids are combined with stimulants like methamphetamine. This new trend, identified through recent toxicology data, suggests that the epidemic is continuing to mutate, requiring even more agile data analysis to keep pace with the evolving threat.
In conclusion, the journey to understand the US opioid epidemic is increasingly a journey through data. While the stories of individual loss provide the moral imperative to act, it is the rigorous analysis of trends, demographics, and global comparisons that provides the roadmap for a solution. The transition from anecdotal awareness to data-driven policy remains the most effective tool in the effort to mitigate one of the most significant public health challenges in modern history.