
 rifanmuazin
In the modern digital economy, customer experience (CX) has evolved from a secondary service concern into a primary driver of competitive advantage and revenue growth. Central to this evolution are two critical performance indicators: the Customer Satisfaction Score (CSAT) and the Net Promoter Score (NPS). While these acronyms are frequently used interchangeably in corporate boardrooms, they represent fundamentally different lenses through which a company views its relationship with its audience. Understanding the distinction between the transactional nature of CSAT and the relational depth of NPS is no longer optional for product leaders and marketers; it is a prerequisite for managing retention, advocacy, and long-term brand health.
The distinction between these metrics begins with their scope. CSAT is designed to capture a “snapshot” of sentiment—a customer’s immediate reaction to a specific touchpoint, such as a technical support interaction, a product demo, or a completed purchase. Conversely, NPS serves as a “big picture” metric, gauging long-term loyalty and the likelihood that a customer will act as a brand advocate. As businesses increasingly pivot toward data-driven decision-making, the integration of these two metrics has become the gold standard for moving from passive tracking to active growth management.
The Technical Framework: Defining CSAT and NPS
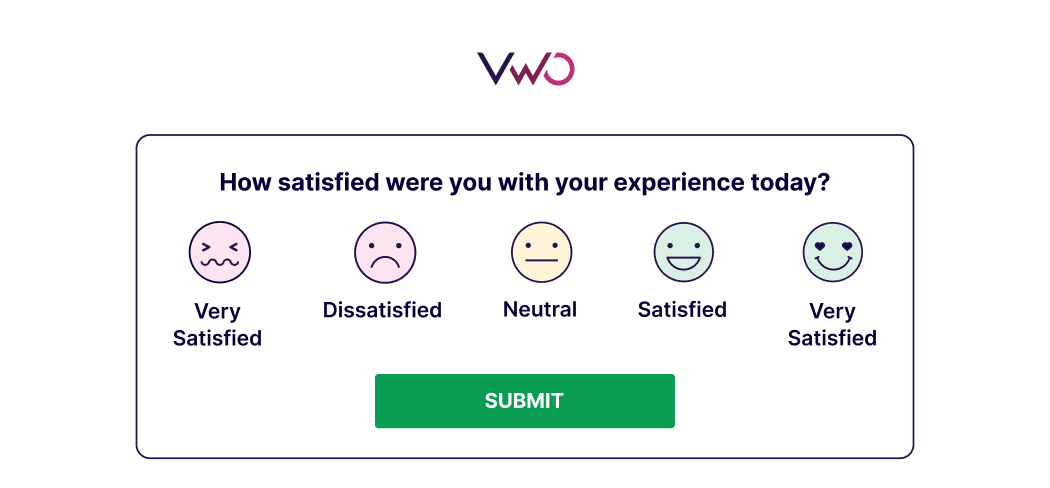
To implement these metrics effectively, organizations must first master their underlying mechanics. CSAT is traditionally measured by asking a variation of the question: “How satisfied were you with [specific interaction]?” Respondents typically answer on a scale of 1 to 5, ranging from “Very Dissatisfied” to “Very Satisfied.” The score is calculated by taking the number of satisfied customers (those who responded with a 4 or 5) and dividing it by the total number of responses, then multiplying by 100 to yield a percentage. This provides an immediate, granular view of how well specific processes or teams are performing.
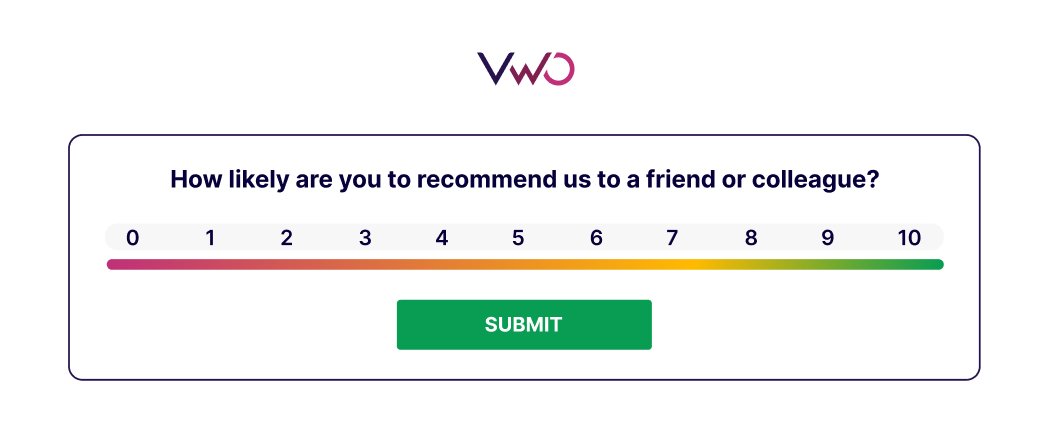
NPS, introduced to the business world by Fred Reichheld of Bain & Company in 2003, focuses on the “Ultimate Question”: “On a scale of 0 to 10, how likely are you to recommend our company/product/service to a friend or colleague?” Based on their responses, customers are categorized into three groups: Promoters (9-10), Passives (7-8), and Detractors (0-6). The Net Promoter Score is derived by subtracting the percentage of Detractors from the percentage of Promoters. Unlike CSAT, which measures a moment in time, NPS measures the strength of the brand relationship and is a proven leading indicator of future growth and churn.
Historical Context and the Evolution of CX Metrics
The rise of these metrics coincides with the digital transformation of the early 21st century. Historically, customer feedback was gathered through lengthy, periodic surveys that often suffered from low response rates and delayed insights. The emergence of NPS in the early 2000s revolutionized the field by offering a single, simple number that could be benchmarked across industries. However, as the SaaS (Software as a Service) model and e-commerce grew, the need for more frequent, “in-the-moment” feedback led to the refinement of CSAT as a real-time diagnostic tool.

Today, the landscape is shifting again toward “Continuous Discovery.” Modern product teams no longer wait for quarterly NPS reports; they use automated triggers to deploy CSAT surveys immediately after a user engages with a new feature. This chronological shift—from retrospective analysis to real-time intervention—allows companies to fix friction points before they escalate into reasons for churn.
Comparative Analysis: Tactical vs. Strategic Utility
The choice between CSAT and NPS depends entirely on the organizational objective. If a product manager wants to determine if a new checkout flow is intuitive, NPS is too broad to be useful. In this scenario, a CSAT survey delivered immediately after the transaction provides the specific data needed for tactical improvements. Conversely, if a Chief Marketing Officer (CMO) needs to assess brand health against a competitor or predict market share fluctuations, CSAT is too narrow. NPS provides the strategic altitude required for such high-level assessments.
| Feature | CSAT (Customer Satisfaction Score) | NPS (Net Promoter Score) |
|---|---|---|
| Primary Purpose | Measure immediate satisfaction | Measure long-term loyalty |
| Focus | Short-term “Reaction” | Long-term “Reputation” |
| Scope | Specific interaction/touchpoint | Overall brand relationship |
| Timing | Real-time (Immediate) | Periodic (Quarterly/Biannually) |
| Best For | Support teams, UI/UX testing | Brand health, churn prediction |
| Outcome | Tactical process improvements | Strategic brand positioning |
The Loyalty-Satisfaction Matrix: A Strategic Framework
The most sophisticated organizations do not view CSAT and NPS in isolation. Instead, they plot these scores on a “Loyalty-Satisfaction Matrix” to categorize their customer base and dictate strategic moves.
- Brand Champions (High CSAT, High NPS): These are customers who are satisfied with every interaction and are emotionally invested in the brand. They are the primary source of referrals and case studies. Strategy: Nurture and reward.
- At-Risk Satisfied Users (High CSAT, Low NPS): These users find the product functional but feel no brand affinity. They are highly susceptible to competitors offering a lower price or a slightly better feature set. Strategy: Focus on brand building and emotional engagement.
- Frustrated Loyalists (Low CSAT, High NPS): These customers believe in the company’s vision but are struggling with specific product frictions or poor support. Their patience is high, but it is not infinite. Strategy: Immediate technical intervention and friction removal.
- Churn Risks (Low CSAT, Low NPS): These individuals have checked out both emotionally and technically. Strategy: Graceful exit or aggressive intervention if the account value justifies the cost.
The Role of Technology and Generative AI
The methodology for analyzing feedback is currently undergoing a radical shift due to the advent of Generative AI. Traditionally, qualitative feedback—the “comments” section of a survey—required manual tagging and analysis, a process prone to human bias and delay. Modern platforms now utilize AI to surface recurring themes and sentiment patterns at scale.
However, industry experts warn against total reliance on automation. While AI can process thousands of NPS comments in seconds, it can occasionally miss nuance or sarcasm. Leading teams use AI to identify broad themes but rely on human oversight to validate hypotheses. Tools like VWO Pulse have integrated these capabilities, allowing teams to deploy contextual surveys and use AI-driven insights to feed directly into A/B testing workflows. This creates a “feedback loop” where a customer complaint in a CSAT survey can lead to a UI hypothesis, a test, and a permanent fix within the same week.
Expert Perspectives and Broader Implications
Ali Good, Global Head of Strategy and Product Marketing at Quizizz, emphasizes that the “Voice of the Customer” (VoC) is more than just data—it is a form of social proof. In a recent industry webinar, Good noted that the specific language customers use in feedback should be woven into marketing messaging. This prevents “marketing jargon” from alienating the audience and ensures the product’s value proposition aligns with actual user experience.
The economic implications of mastering these metrics are profound. Research from Harvard Business Review has famously indicated that increasing customer retention rates by 5% can increase profits by 25% to 95%. High NPS scores are frequently correlated with lower customer acquisition costs (CAC), as organic word-of-mouth reduces the need for heavy ad spend. Furthermore, in the SaaS sector, “Net Revenue Retention” (NRR) is often directly tied to the health of these sentiment scores.
Conclusion: Closing the Loop
Measuring satisfaction and loyalty is only the first step. The true value of CSAT and NPS lies in “closing the loop”—the process of acting on feedback and communicating those actions back to the customer. When a user provides a low CSAT score and subsequently sees the issue resolved, their trust in the brand often increases beyond its original level, a phenomenon known as the “service recovery paradox.”
By integrating behavioral analytics—such as heatmaps and session recordings—with survey data, companies can bridge the gap between what customers say and what they actually do. This holistic approach ensures that optimization efforts are not just chasing “vanity metrics” but are driving meaningful improvements in engagement, conversion, and long-term business viability. In an era where the customer has more choices than ever, the ability to distinguish between a happy transaction and a loyal relationship is the ultimate indicator of a brand’s future success.








