

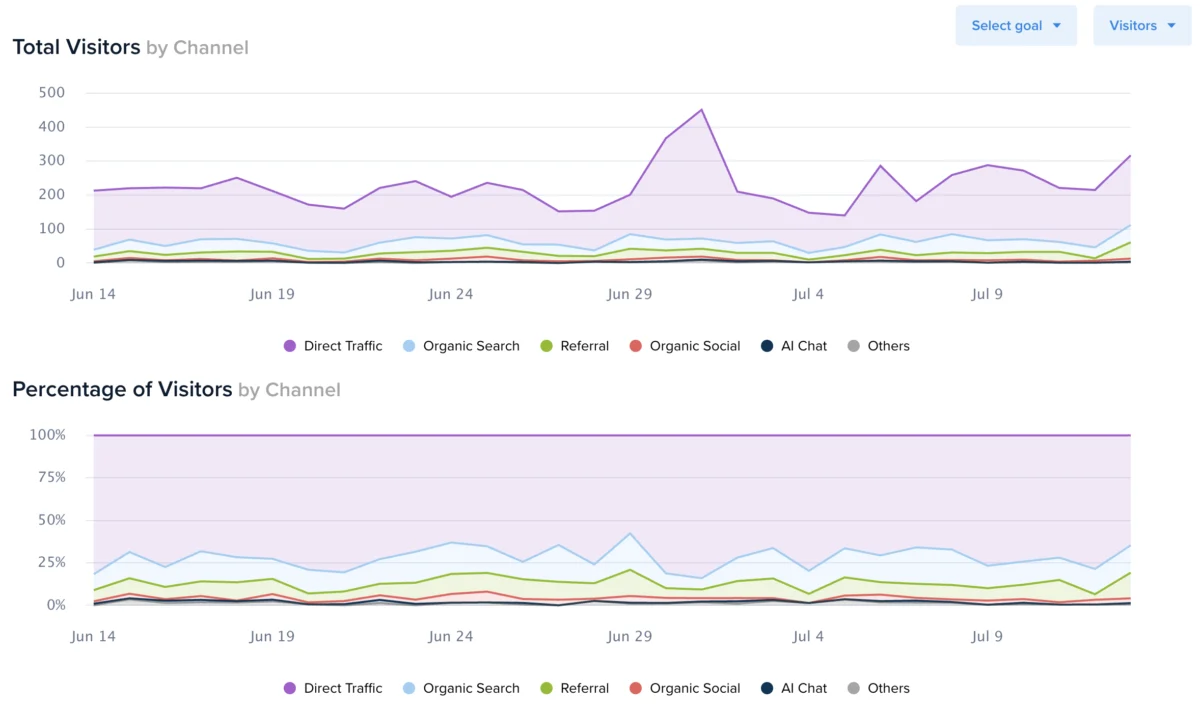
The digital optimization landscape has reached a new milestone as Crazy Egg, a pioneer in heatmapping and user behavior technology, officially rolled out a significant update to its Web Analytics platform. This latest enhancement introduces dedicated time-series charts for every traffic segment, providing marketers, data analysts, and business owners with the ability to observe performance trends on a day-by-day basis. By transitioning from static, aggregate data tables to dynamic visual representations, the update aims to simplify the process of identifying traffic spikes, declining channels, and the specific conversion rates of individual marketing campaigns. This move reflects a broader industry shift toward democratizing complex data, making high-level insights accessible to users regardless of their technical proficiency in data science.
Evolution of the Web Analytics Suite
Since its inception in 2006, Crazy Egg has been synonymous with visual behavioral data, primarily through its heatmap and scroll-map tools. However, as the digital ecosystem became more competitive, the demand for a unified platform that combines qualitative behavior (heatmaps) with quantitative performance (web analytics) grew. The introduction of the Web Analytics dashboard several years ago was the company’s response to this demand, positioning it as a streamlined alternative to more cumbersome platforms like Google Analytics 4 (GA4).
The latest integration of time-series charts represents a logical progression in this product roadmap. Previously, while users could see which segments performed best over a selected period, they lacked the immediate visual context of when those performances occurred within that timeframe. By adding a temporal dimension to every segment, Crazy Egg allows users to perform "Root Cause Analysis" more effectively. For instance, if a specific referral source shows a high volume of traffic, a user can now see if that traffic was a consistent flow or a single-day anomaly caused by a specific social media mention or press release.
Technical Implementation and User Interface
The new feature is designed with the "no-code" and "low-friction" philosophy that has defined Crazy Egg’s brand for nearly two decades. To access the time-series visualizations, users must navigate to their Web Analytics dashboard and select a date range spanning at least two days. The system then generates a list of audience segments, including traffic sources, geographic locations, device types, and specific landing pages.
Adjacent to each segment is a new “greater than” (>) button. Clicking this icon expands the segment view to reveal two distinct charts situated above the existing data table. These charts provide a dual-view of the data, allowing for comparative analysis. Users are granted the flexibility to toggle between three primary metrics:
- Visitors: The number of unique individuals who accessed the site.
- Sessions: The total number of visits, which may include multiple visits from the same individual.
- Pageviews: The total number of individual pages loaded during those sessions.
A dropdown menu in the top-right corner of the interface facilitates this selection, ensuring that the visualization aligns with the user’s specific Key Performance Indicators (KPIs). Furthermore, the update includes a robust "Conversion Goal" overlay. By selecting a predefined conversion goal from the menu, the charts will display a secondary Y-axis on the right-hand side, plotting the number of daily conversions against the total traffic volume. This overlay is critical for identifying whether a spike in traffic actually resulted in a meaningful business outcome or merely increased server load.
Data Portability and Reporting
Recognizing that many enterprise-level users require data for external reporting and cross-platform synthesis, Crazy Egg has ensured that these new metrics are fully exportable. The platform now supports the extraction of day-by-day traffic metrics into a spreadsheet format (.xlsx). This functionality is accessed via the “Export” button located next to the date range selector.
For digital marketing agencies, this feature is particularly valuable. It allows for the creation of more detailed client reports that move beyond "total clicks" to show the "velocity of growth" over the course of a month or a specific campaign cycle. The ability to export granular, segmented data ensures that Crazy Egg remains a viable component of a larger data stack, even for organizations that use more complex business intelligence (BI) tools.
The Strategic Importance of Segmentation in Modern Marketing
The release of these time-series charts addresses a fundamental challenge in modern digital marketing: the "Average Fallacy." When marketers look only at average conversion rates or total traffic, they often miss the nuances that drive growth. Segmentation allows a business to see that while their overall conversion rate might be 2%, their "Mobile Users from New York" might be converting at 8%.
By adding a time-series element to these segments, Crazy Egg enables users to detect "seasonality" at a micro-level. For example, a retail brand might discover that their email marketing segment performs exceptionally well on Tuesday mornings but dips significantly on Fridays. Without time-series visualization, these patterns are buried in the aggregate totals.
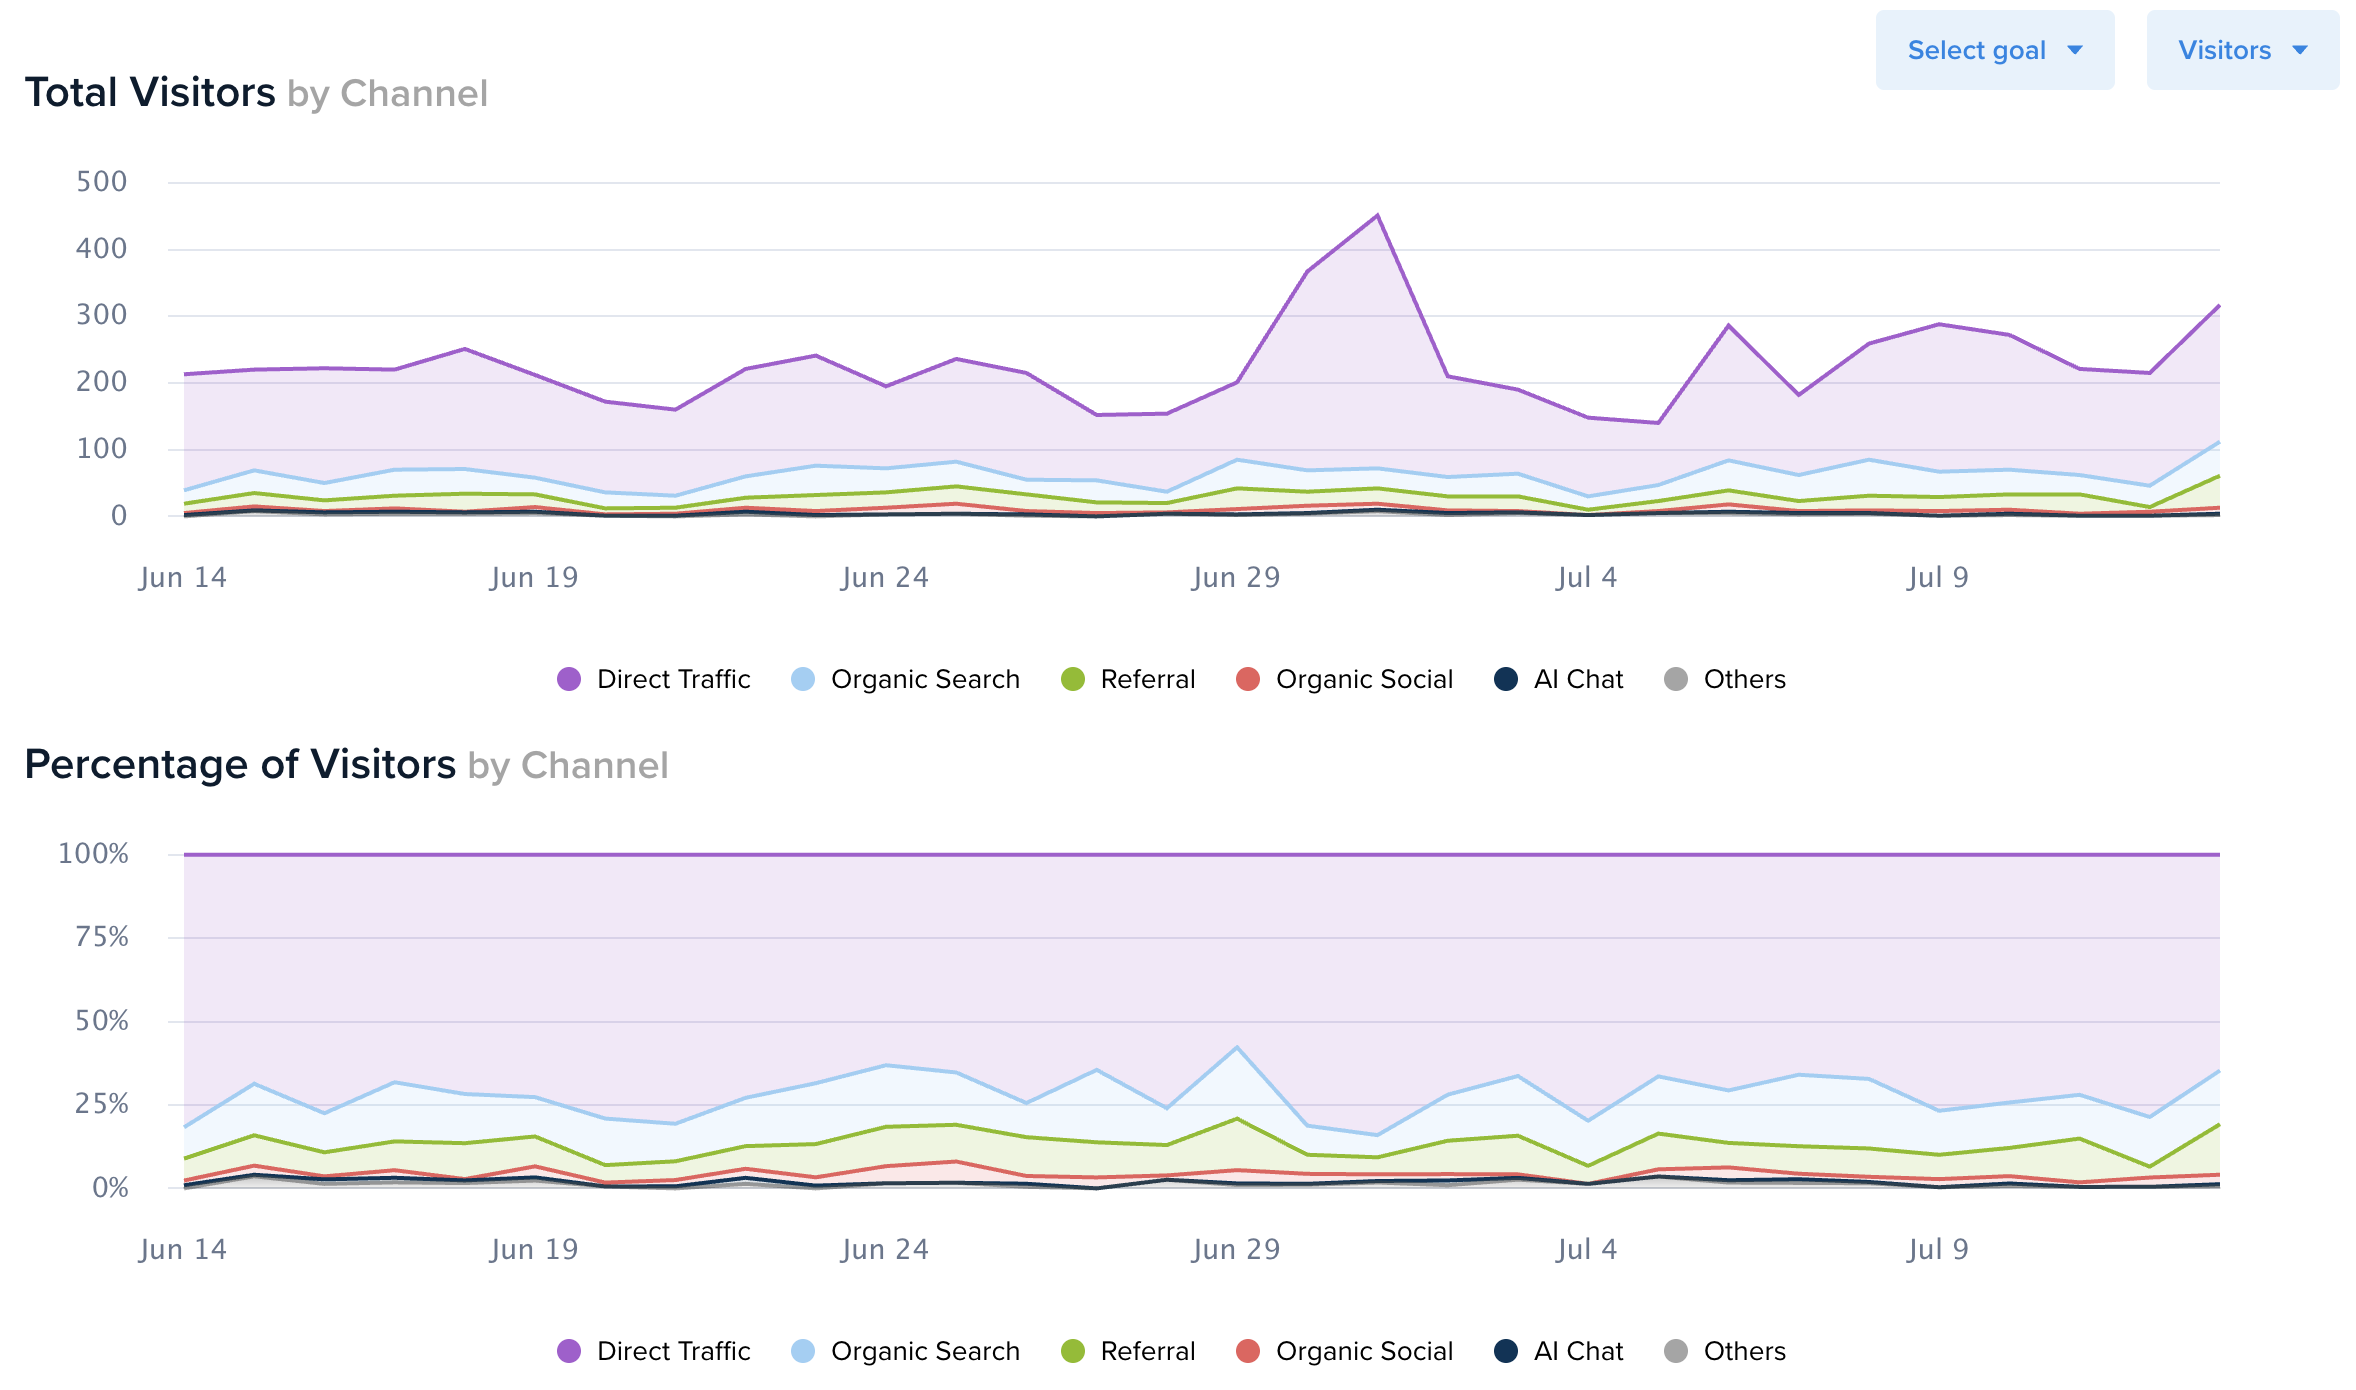
Industry experts suggest that the ability to visualize the decline of a specific channel in real-time is equally important. If a paid search campaign’s performance begins to taper off mid-month, the visual trend line in the time-series chart serves as an early warning system, allowing the marketing team to reallocate budget before significant resources are wasted.
Market Context and Competitive Landscape
The web analytics market is currently undergoing a period of significant transition. With the sunsetting of Universal Analytics and the mandatory transition to Google Analytics 4, many small-to-medium-sized businesses (SMBs) have found themselves overwhelmed by the complexity of modern data platforms. This has created a "simplicity vacuum" in the market, which companies like Crazy Egg, Fathom, and Plausible are rushing to fill.
Crazy Egg’s decision to offer these advanced segmented charts at no extra cost to all plan holders is a strategic move to increase user retention and attract those seeking a more intuitive reporting interface. While competitors like Microsoft Clarity offer similar heatmapping features for free, Crazy Egg differentiates itself by providing a more robust, integrated analytics suite that now rivals the reporting depth of specialized quantitative tools.
Market data indicates that the global web analytics market size is expected to grow at a Compound Annual Growth Rate (CAGR) of over 15% through 2028. This growth is driven by the increasing need for organizations to understand customer behavior in an era of heightened privacy regulations and the "cookieless" future. Crazy Egg’s focus on first-party data and direct site interactions positions it well within this shifting landscape.
Inferred Industry Reactions and Implications
While official statements from third-party partners have not been released, the reaction from the Conversion Rate Optimization (CRO) community has been historically positive regarding Crazy Egg’s iterative updates. Analysts suggest that this update will be particularly beneficial for E-commerce managers who need to monitor the impact of flash sales and influencers who need to prove the "tail-end" value of their content over several days.
The broader implication of this update is the continued "democratization of data science." By providing sophisticated visualizations that would previously have required custom SQL queries or complex Excel pivoting, Crazy Egg is enabling non-technical founders and marketing managers to make data-driven decisions. This reduces the reliance on dedicated data departments and speeds up the "test-and-learn" cycle essential for modern business agility.
Chronology of Crazy Egg’s Feature Expansion
To understand the significance of this update, it is helpful to look at the timeline of Crazy Egg’s development over the last few years:
- Early 2000s: Focus exclusively on Heatmaps and Overlay reports.
- Mid 2010s: Introduction of User Recordings, allowing for "DVR-style" playback of user sessions.
- Late 2010s: Launch of A/B Testing tools, enabling users to act on their insights directly within the platform.
- 2020-2022: Introduction of the Web Analytics dashboard to provide a high-level overview of site health.
- 2023-2024: Integration of Surveys and expanded feedback loops to capture the "voice of the customer."
- Current Update: The launch of segmented time-series charts to bridge the gap between high-level summaries and granular daily performance.
This chronology demonstrates a clear shift from being a "niche tool" for designers to becoming a "comprehensive platform" for growth teams.
Conclusion and Future Outlook
The introduction of segmented time-series charts is more than a minor UI update; it is an expansion of the analytical capabilities available to the average website owner. By allowing users to see not just who is visiting and what they are doing, but exactly when their behavior changes, Crazy Egg has provided a more powerful lens through which to view the digital customer journey.
As the platform continues to evolve, it is expected that further integrations with artificial intelligence may be on the horizon—potentially using these time-series data points to automatically alert users to anomalies or predict future traffic trends based on historical segment performance. For now, the availability of these charts across all Crazy Egg plans ensures that even the smallest startups have access to the kind of data visualization once reserved for enterprise-level analytics suites. The feature is currently live and can be accessed by all users via their standard Web Analytics dashboard.







