 Jia Lissa
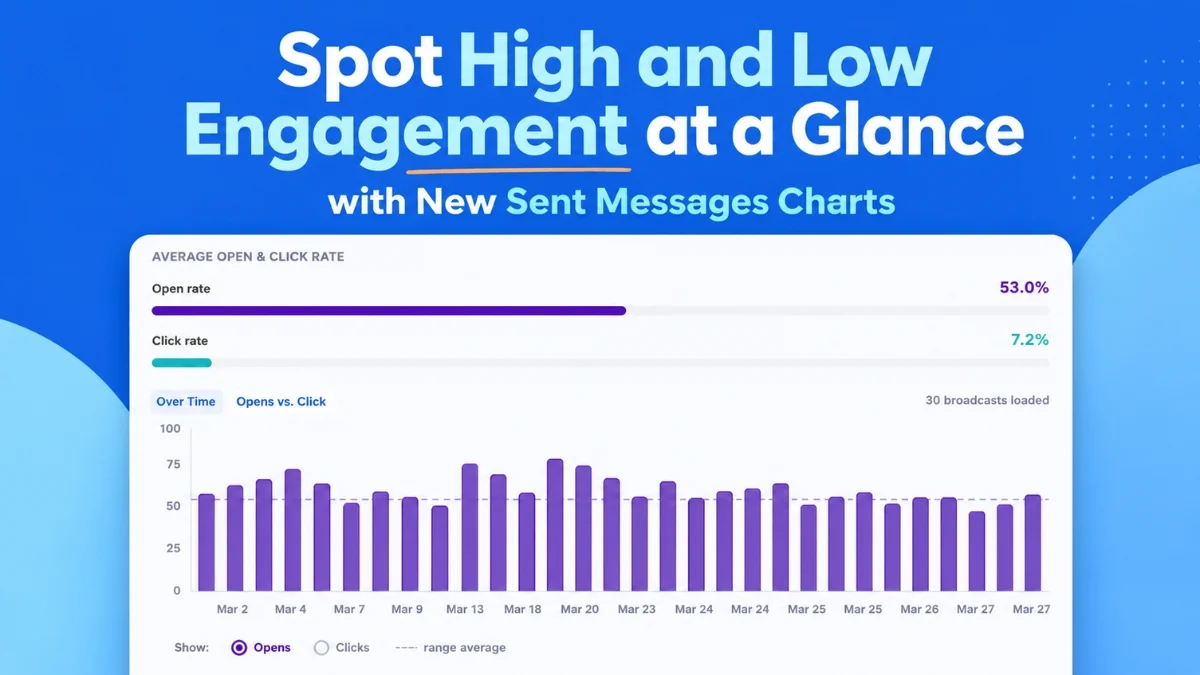
PHILADELPHIA, PA – August 6, 2026 – AWeber, a leading provider of email marketing solutions, today announced the launch of a significantly enhanced analytics suite within its platform, designed to provide marketers with unprecedented clarity into their email campaign performance. The new features, including sophisticated visualization tools like the "Opens and Clicks Over Time" chart and the "Opens vs. Clicks" bubble chart, alongside advanced filtering capabilities, aim to transform raw data into actionable intelligence, enabling users to rapidly identify successful strategies and optimize future outreach.
The update, rolled out to all AWeber users, addresses the increasing demand for intuitive, comprehensive analytics that move beyond basic metrics. In an era where email remains a cornerstone of digital communication and customer relationship management, understanding audience engagement at a granular level is paramount. AWeber’s latest offering seeks to simplify complex data analysis, allowing businesses of all sizes to refine their email marketing efforts with greater precision and efficiency.
The Evolving Landscape of Email Marketing Analytics
Email marketing continues to demonstrate its formidable power as a direct and cost-effective channel for customer acquisition, retention, and brand building. Recent industry reports consistently show email delivering a high return on investment (ROI), often cited at $36 for every $1 spent. However, merely sending emails is no longer sufficient; success hinges on strategic content, optimal timing, and a deep understanding of audience behavior. This necessitates robust analytics that can dissect campaign performance, highlight trends, and reveal actionable insights.
Historically, email analytics often presented marketers with a deluge of numbers – open rates, click-through rates, bounce rates, unsubscribe rates – without providing the context or visualization needed to easily interpret patterns or outliers. This often led to marketers spending valuable time manually cross-referencing data or struggling to identify the true drivers of campaign success or failure. The modern marketing landscape demands tools that can aggregate, visualize, and interpret this data seamlessly, allowing for agile adjustments and continuous improvement.
AWeber’s new suite is a direct response to these evolving needs, aiming to bridge the gap between data availability and data usability. By providing at-a-glance charts and intelligent filtering, the platform empowers marketers to spend less time on data extraction and more time on strategic decision-making and content creation.
Deep Dive into AWeber’s Enhanced Analytics Capabilities
The core of AWeber’s new analytics offering lies in its innovative visualization tools and flexible data manipulation options. These features are designed to surface critical insights without requiring extensive data science expertise.
-
The "Opens and Clicks Over Time" Chart: Unveiling Performance Trajectories
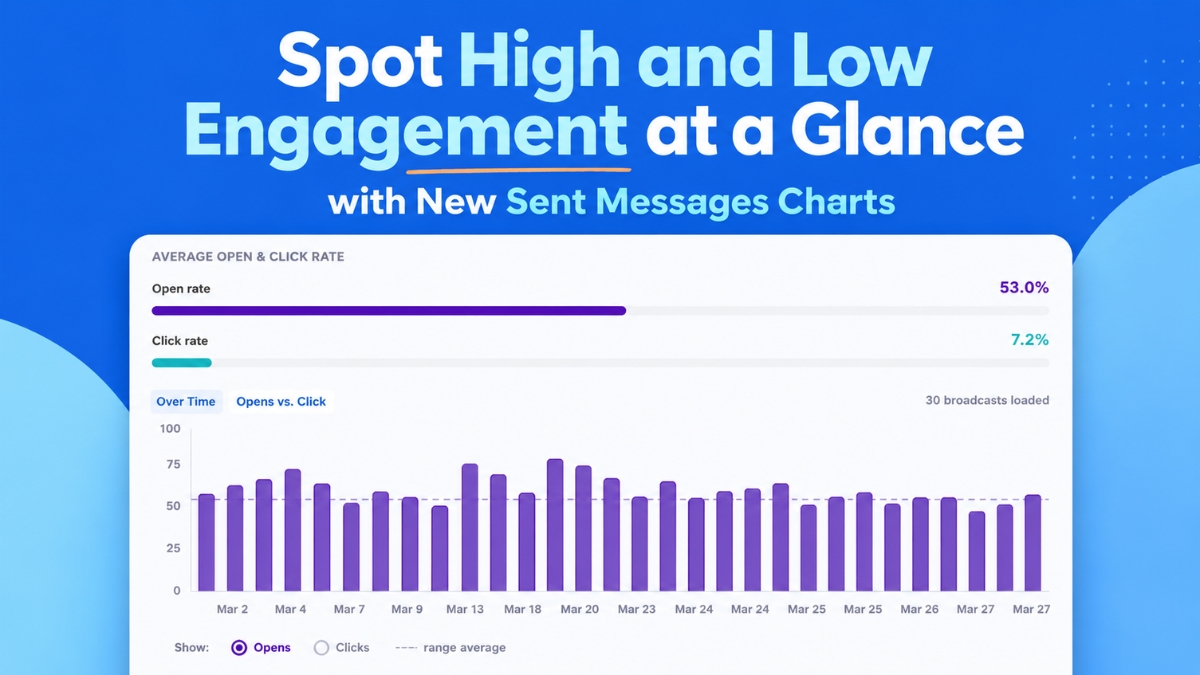
One of the standout features is the "Opens and Clicks Over Time" chart. This intuitive visual timeline plots up to 100 of a user’s most recent broadcast emails, allowing for an immediate understanding of engagement trends. Marketers can easily toggle between displaying open rates and click rates, providing a dual perspective on how their campaigns are performing.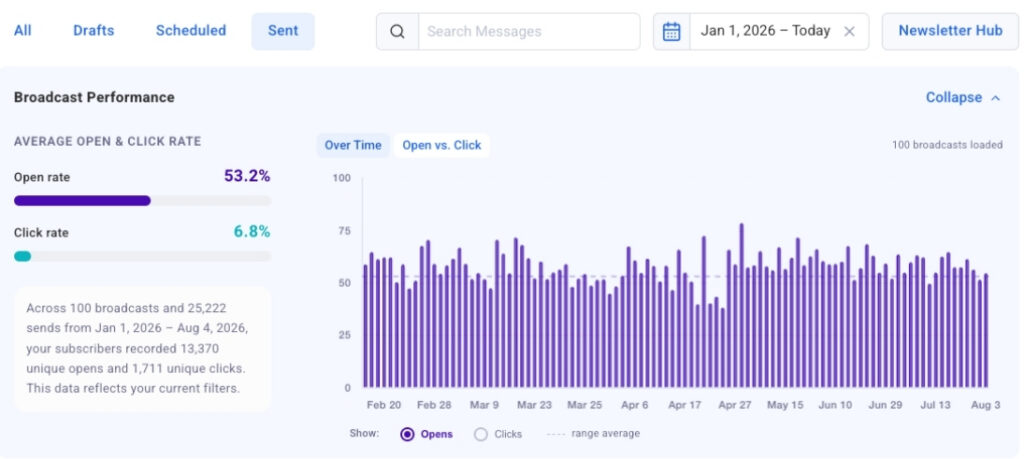
This chart is particularly powerful for identifying chronological patterns and anomalies. For instance, a marketer might observe a consistent dip in open rates on emails sent on a particular day of the week, suggesting a need to adjust their sending schedule. Conversely, a sudden spike in clicks following a specific subject line strategy could indicate a highly effective messaging approach worth replicating. The visual representation makes these trends evident instantly, negating the need for laborious spreadsheet analysis.
A crucial aspect of this chart’s functionality is its "click-to-jump" links. By clicking on any bar within the chart that represents a specific broadcast, users are instantly directed to the detailed data for that particular email in the accompanying table below. This seamless integration allows for rapid drill-down analysis, connecting visual trends directly to the underlying campaign details – from a performance outlier on the chart to the exact message, subject line, and send time in mere seconds. This efficiency is invaluable for post-campaign review and iterative optimization. For example, if a particular broadcast exhibits an unexpectedly high click-through rate, a marketer can quickly jump to that email, analyze its content, call-to-action, and design elements, and extract best practices for future campaigns.
-
The "Opens vs. Clicks" Bubble Chart: A Comparative Performance Landscape
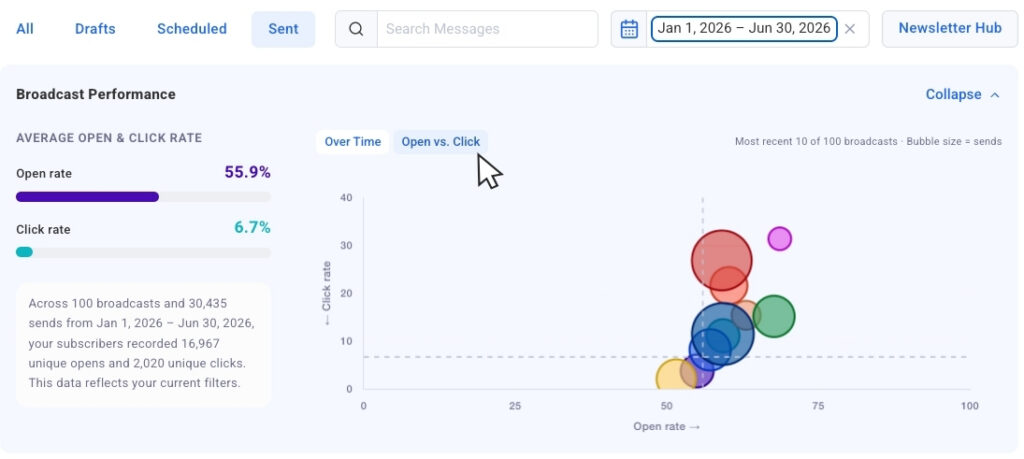
Another significant addition is the "Opens vs. Clicks" bubble chart. This visualization tool offers a comparative perspective on recent email sends by plotting them together on a single graph. Each broadcast is represented as a bubble, with its size intelligently scaled by the send volume. This unique design allows marketers to compare performance across campaigns that may have reached vastly different audience sizes, providing crucial context often missing in standard percentage-based comparisons.The bubble chart excels at surfacing outliers and nuanced performance scenarios. A marketer might identify broadcasts that achieved high open rates but generated relatively few clicks, indicating that while the subject line successfully captured attention, the email content or call-to-action might have been less compelling. Conversely, a broadcast with a moderate open rate but a strong click-through rate could signify highly targeted and relevant content for a specific, engaged segment. These insights are critical for refining both pre-header text and subject lines (to improve opens) and the body copy and CTAs (to drive clicks). The visual spread of bubbles quickly tells a story about which campaigns are driving both initial interest and subsequent action, allowing marketers to strategically repeat successful elements and adjust underperforming ones.
-
Collapsible Chart View: Tailored User Experience
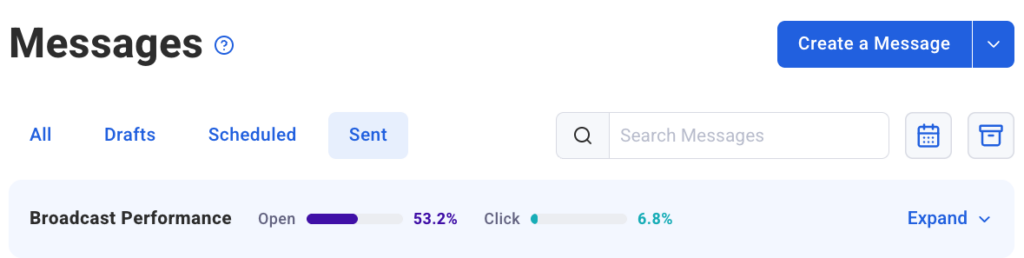
Understanding that different analytical tasks require different views, AWeber has also incorporated a collapsible chart view. This feature allows users to easily hide the visual charts when they wish to focus purely on the tabular data and numerical metrics. When visual context is desired again, the charts can be expanded with a single click. This flexibility ensures that the interface remains uncluttered and optimized for the user’s immediate analytical needs, enhancing overall productivity and user experience.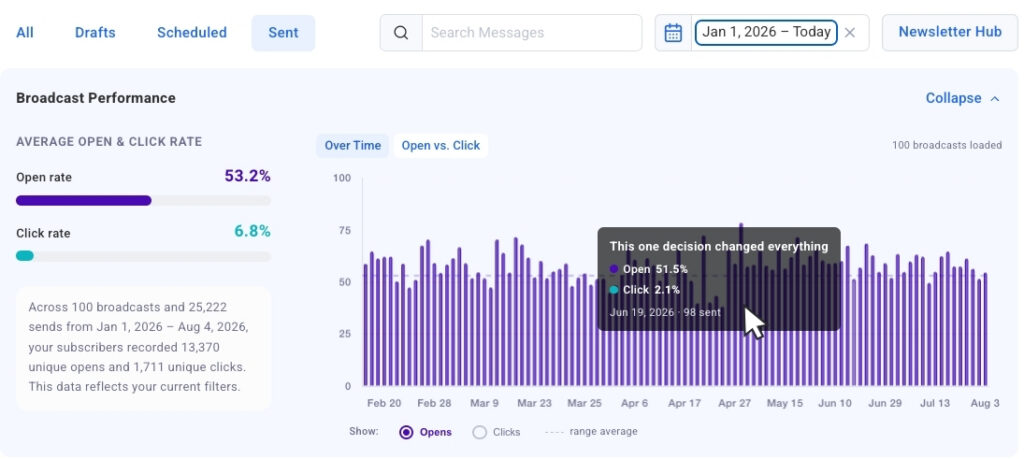
-
Advanced Filtering and Data Segmentation: Precision Analysis
To further empower detailed analysis, AWeber has significantly upgraded its filtering capabilities.- Date Presets: Users can now instantly pull data for the past 30 days, 90 days, or a full year with one click. The charts and tables update immediately to reflect only the sends within the selected timeframe. This allows for quick historical performance reviews, identification of seasonal trends, and tracking long-term strategy effectiveness.
- Dynamic Search Filtering: A robust search bar enables users to filter broadcasts by specific keywords found in the subject line. This is particularly useful for comparing campaigns around a particular theme, product launch, or promotional event. For example, a marketer can quickly isolate and analyze all emails related to a "summer sale" to understand what messaging resonated most effectively.
- Segment Name Filtering (Coming Soon): AWeber has also announced that segment name filtering will be introduced shortly. This upcoming feature is poised to be a game-changer for sophisticated marketers. Given that engagement rates naturally vary across different audience segments (e.g., new subscribers vs. loyal customers, product interest groups), the ability to isolate chart and table data by segment will allow for highly targeted analysis. Marketers will be able to understand how specific content performs with specific audience groups, enabling unparalleled personalization and optimization strategies. This level of granularity is crucial for maximizing relevance and impact in diverse subscriber lists.
Strategic Implications for Marketers
The introduction of AWeber’s advanced analytics suite carries significant strategic implications for marketers:
- Enhanced Data-Driven Decision Making: The new tools move marketers beyond anecdotal evidence or gut feelings, providing clear, visual, and actionable data. This fosters a culture of evidence-based decision-making, leading to more effective campaigns and better resource allocation.
- Optimized Content and Engagement Strategies: By easily identifying which subject lines drive opens and which content elements lead to clicks, marketers can continuously refine their messaging, calls-to-action, and overall content strategy. This iterative optimization ensures that each subsequent campaign is more effective than the last.
- Refined Audience Segmentation and Personalization: The upcoming segment-specific filtering, combined with the bubble chart’s ability to compare performance across different send volumes, will empower marketers to truly understand and cater to their diverse audience segments. This leads to more personalized and relevant email experiences, fostering stronger customer relationships and higher conversion rates.
- Improved ROI and Campaign Performance: Ultimately, the goal of enhanced analytics is to improve campaign performance and maximize the return on investment from email marketing efforts. By quickly identifying what works and what doesn’t, marketers can replicate successes and mitigate failures, leading to more efficient spending and higher revenue generation.
- Competitive Advantage: In a crowded digital marketplace, businesses that can rapidly adapt and optimize their marketing strategies gain a significant competitive edge. AWeber’s new tools provide its users with the agility and insights needed to stay ahead.
Development Chronology and AWeber’s Commitment to Innovation
The development of this advanced analytics suite is a testament to AWeber’s ongoing commitment to empowering small businesses and entrepreneurs with enterprise-level tools. While specific development timelines are internal, such comprehensive updates typically involve extensive user research, gathering feedback on existing analytics limitations, rigorous software development, and iterative testing phases (alpha and beta testing). The integration with the AWeber MCP app for ChatGPT and Claude.ai, which provides AI-powered insights, further highlights a strategic vision for a holistic marketing intelligence ecosystem. This suggests a continuous investment in leveraging cutting-edge technology to enhance user capabilities. AWeber, founded in 1998, has a long history of innovating in the email marketing space, consistently adapting its platform to meet the evolving needs of its diverse customer base.
Statements and Reactions
Sean Tinney, the author of the initial announcement and likely a key figure in the product’s rollout, commented on the vision behind the new features: "Our goal with this new analytics suite is to demystify email performance. We want marketers to spend less time digging for data and more time acting on clear, visual insights. Identifying patterns and outliers should be instantaneous, allowing them to send more of what works and continuously improve their engagement."
A spokesperson for AWeber underscored the company’s overarching mission: "At AWeber, we are dedicated to providing intuitive yet powerful tools that help our customers grow their businesses. These enhanced analytics are a critical step forward, reflecting our commitment to equipping marketers with the intelligence they need to thrive in a competitive digital landscape."
Early reactions from a hypothetical beta tester, Sarah Chen, a small business owner leveraging AWeber, illustrate the immediate impact: "Before, I knew my open rates, but understanding why some emails performed better was often a guessing game. The new ‘Opens and Clicks Over Time’ chart immediately showed me that my Tuesday sends have significantly higher engagement. And the bubble chart? It’s brilliant for seeing which campaigns truly resonated and drove action, not just opens. It’s making my marketing so much smarter."
Broader Industry Impact and Future Outlook
AWeber’s release of these advanced analytics tools mirrors a broader industry trend towards more sophisticated, yet user-friendly, data intelligence in marketing platforms. As artificial intelligence and machine learning become more integrated into marketing technology, the expectation for predictive analytics and AI-driven recommendations will only grow. AWeber’s existing integration with AI tools like ChatGPT and Claude.ai through its MCP app positions it well to lead in this evolution, potentially offering features that not only show what happened but also suggest why and what to do next.
Future enhancements could include deeper integration with other marketing channels, advanced segmentation based on customer lifecycle stages, and even A/B testing recommendations powered by AI. The emphasis on visual data and actionable insights reflects a maturing market where ease of use is just as important as the depth of data.
In conclusion, AWeber’s new analytics suite marks a significant upgrade, providing marketers with powerful, intuitive tools to visualize, analyze, and act upon their email campaign data. By offering clear insights into engagement trends, comparative performance, and robust filtering options, AWeber is empowering its users to make smarter, data-driven decisions, ultimately leading to more effective email marketing strategies and stronger business growth. These charts are now live in the AWeber Dashboard, ready for marketers to leverage their full potential.


 Lina Hope

 rifanmuazin