In a significant shift for the digital marketing landscape, a comprehensive new study by Brainlabs has unveiled unambiguous findings regarding the evolving nature of UK search behavior and the burgeoning impact of AI Overviews. Analyzing a massive dataset of 1.35 million keywords across nine diverse UK search categories, the research indicates a clear structural decline in the prominence of "head terms" – short, high-volume search queries – in seven out of nine categories. Concurrently, "longtail" queries, characterized by their increased length and specificity, are experiencing substantial growth. Crucially, Google’s AI Overviews are increasingly appearing precisely where this search volume is migrating, presenting a narrowing window for brands reliant on organic search visibility to adapt their strategies.
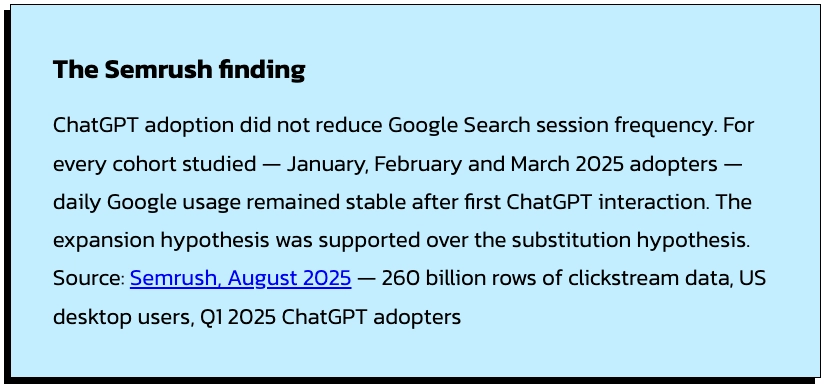
The catalyst for this in-depth investigation was a widely discussed study published by Semrush in August 2025. This earlier research, which analyzed an astounding 260 billion rows of clickstream data, tracked the post-ChatGPT search habits of users. Semrush’s conclusion, that "ChatGPT is not replacing Google – it’s expanding search," suggested that users who adopted AI tools did not exhibit a statistically significant decrease in their daily Google sessions; in fact, overall search activity saw a slight uptick. While this finding might appear reassuring on the surface, the Brainlabs analysis argues that it misses critical nuances. The Semrush study focused on the frequency of Google usage, not on the nature of the queries being made or the search engine results pages (SERPs) presented. These latter aspects, the Brainlabs report contends, are far more pertinent to brands seeking to understand their organic visibility and paid search strategies in the coming years.
Google itself has publicly acknowledged an increase in average query length, with users increasingly posing longer, more conversational questions. This trend, though predating the widespread implementation of AI Overviews, has been markedly accelerated by their introduction. Brands are observing this firsthand: traffic from head terms is softening, while longtail queries are growing, and AI Overviews are appearing across a spectrum of searches, extending beyond the purely informational queries many initially assumed they would be confined to.

Motivated by these observations, Brainlabs undertook its own rigorous analysis. The study was driven by two core hypotheses:
-
AI adoption is reshaping query composition inside Google – not just overall volume: The hypothesis posited that while users might maintain their Google usage frequency, the content of their searches is changing. The rise of AI tools, it was theorized, is training users to formulate longer, more specific questions. This should theoretically lead to a decline in head terms, which have historically been high-value due to their volume, while longtail and potentially branded queries would grow. The Semrush study, by focusing on overall session volume, did not address this specific query composition shift. Brainlabs aimed to fill this gap.
Verdict: Largely confirmed across 7 out of 9 categories analyzed.
-
AI Overviews are appearing on commercial queries, not just informational ones: The prevailing wisdom suggested that Google would deploy AI Overviews primarily on informational queries (e.g., "how-to," "what-is," research-oriented searches) to avoid impacting ad revenue on commercially driven SERPs. Brainlabs hypothesized that this was only partially true and that AI Overviews were already surfacing across a broader range of keywords, including mid-funnel commercial queries. If this proved correct, the risk of click suppression for businesses would be more significant than commonly anticipated.

Verdict: Confirmed – the AI Overview (AIO) rate on longtail queries was found to be 2-3 times higher than on head terms across all categories.
It is important to note the distinction in methodology between the two studies. Brainlabs’ analysis focuses on search volume trends at the keyword level using Ahrefs data, offering a different perspective than Semrush’s session-frequency approach. The two studies are complementary, not contradictory. Semrush addresses whether people are still using Google, while Brainlabs investigates what they are searching for and what Google is showing them in response. Both questions are vital, but the latter carries more direct implications for organic and paid search strategies.
AI Overview Coverage Varies Significantly by Sector
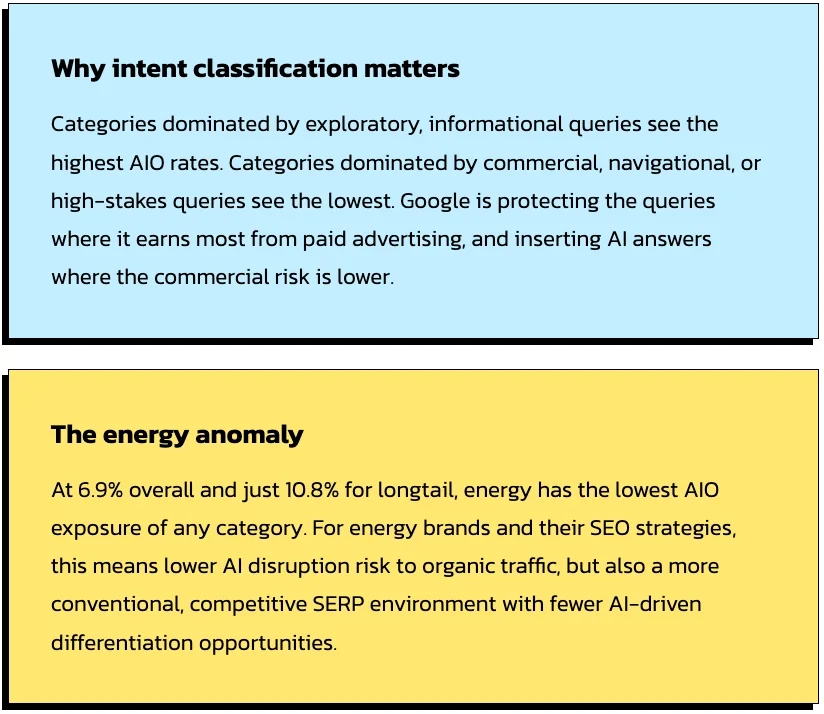
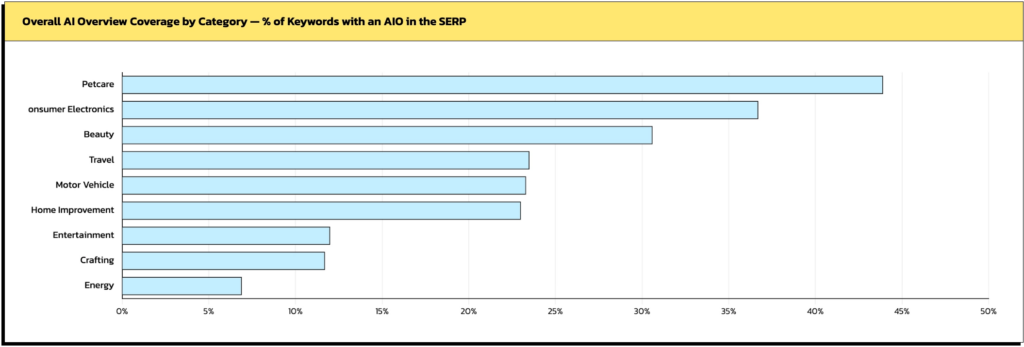
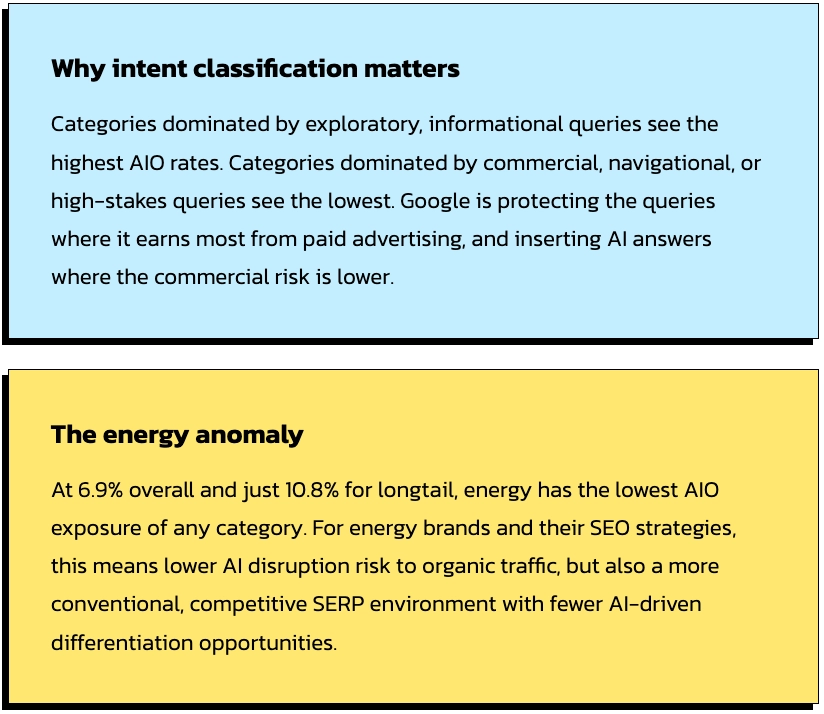
The deployment of AI Overviews by Google is not uniform; it varies considerably across different sectors, reflecting deliberate intent classification rather than algorithmic inconsistency. The Brainlabs study found AIO coverage ranging from a low of 6.9% to a high of 43.9%.
Petcare emerges at the top of the AIO coverage spectrum. This is largely attributed to the category’s saturation with informational queries such as "What can dogs eat?", "Is chocolate toxic to cats?", and "How often should I worm my rabbit?". Google appears confident in its AI’s ability to accurately answer these types of questions, making Petcare a sector that rewards an AI-first content approach.
Conversely, Energy sits at the bottom. The majority of energy-related queries are navigational or commercially specific, for example, "British Gas contact number," "cheapest electricity provider," or "OVO Energy tariffs 2026." Google demonstrates caution in generating AI answers for queries where inaccuracies could have significant financial repercussions for users, thus holding back AIO deployment.
Sectors like Consumer Electronics (36.7%) and Beauty (30.6%) fall into the middle-upper range, driven by robust user research and comparison behaviors within these categories.
Travel (23.5%) and Motor Vehicles (23.3%) show remarkably similar AIO coverage. Despite their different demand profiles, this similarity suggests a shared dynamic where commercial intent suppresses AIO deployment.
Entertainment (12.0%) and Crafting (11.7%) exhibit low AIO rates, even though they are considered informational categories. This finding warrants further investigation, as noted by the report.
Longtail Queries Attract AI Overviews at a Significantly Higher Rate
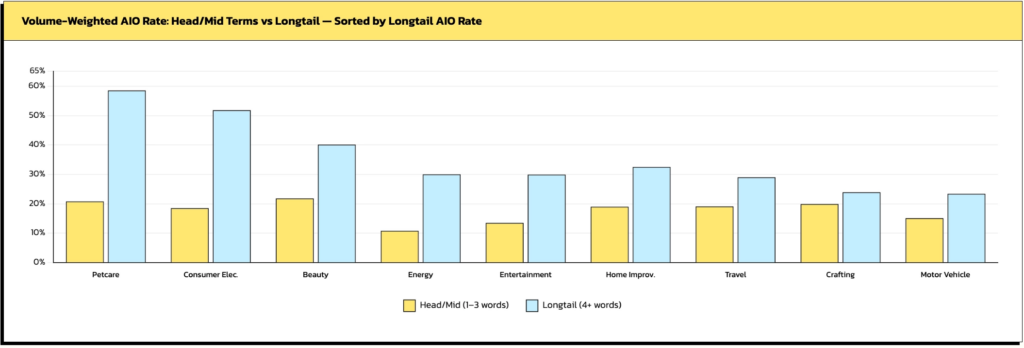
A critical finding of the Brainlabs study is that longtail queries attract AI Overviews at nearly twice the rate of head terms, a pattern observed consistently across all nine categories. Across the dataset, the volume-weighted AIO rate for longtail queries (defined as 4+ words) consistently outpaces that of head and mid-length terms (1-3 words). The gap is particularly dramatic in some sectors.
Petcare showcases the widest disparity, with head terms showing a 20.8% AIO rate compared to a substantial 58.5% for longtail queries. Consumer Electronics follows closely, with rates of 18.5% for head terms and 51.8% for longtail. This consistent pattern underscores Google’s perception: longtail queries are seen as the prime territory where AI-generated answers offer the most user value, while head terms are approached with greater caution, with traditional ranked results often prioritized.
The Motor Vehicles category presents a notable exception. The difference between head and longtail AIO rates is the smallest across all categories (15.1% vs. 23.4%), indicating a minimal longtail premium. This is attributed to the high commercial intent inherent in car buying, a journey across almost all query types that Google treats as too consequential for AI-driven shortcuts.
For brands operating in sectors like petcare and consumer electronics, optimizing for longtail queries is no longer merely a traffic generation tactic. Being cited within an AI Overview for high-intent longtail queries has emerged as a significant visibility objective in its own right, complementary to traditional search engine optimization.
Head Terms Face Structural Decline in Most Categories
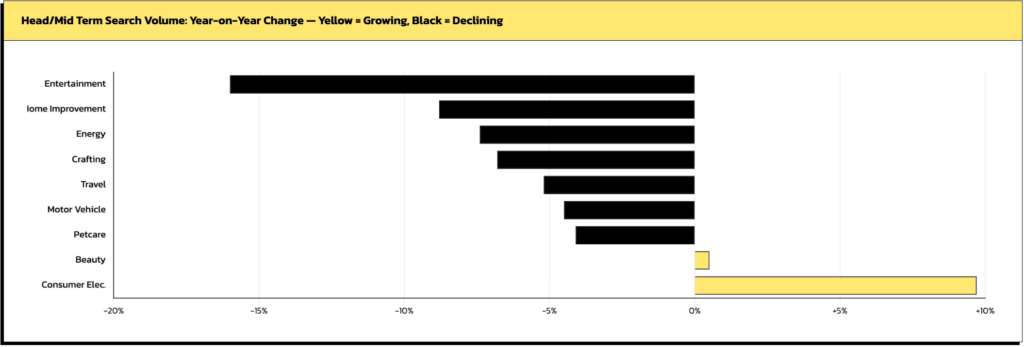
The year-on-year trend analysis of head and mid-length terms (1-3 words) reveals a consistent pattern of structural decline in seven out of the nine categories studied. The Entertainment sector leads this fall with a -16% year-on-year decline. This is particularly noteworthy as AI tools offer a credible substitute for Google searches in this domain; users can obtain recommendations for what to watch without necessarily needing to navigate a traditional SERP. In many instances, these queries may be migrating away from Google entirely, rather than simply shifting within the platform.
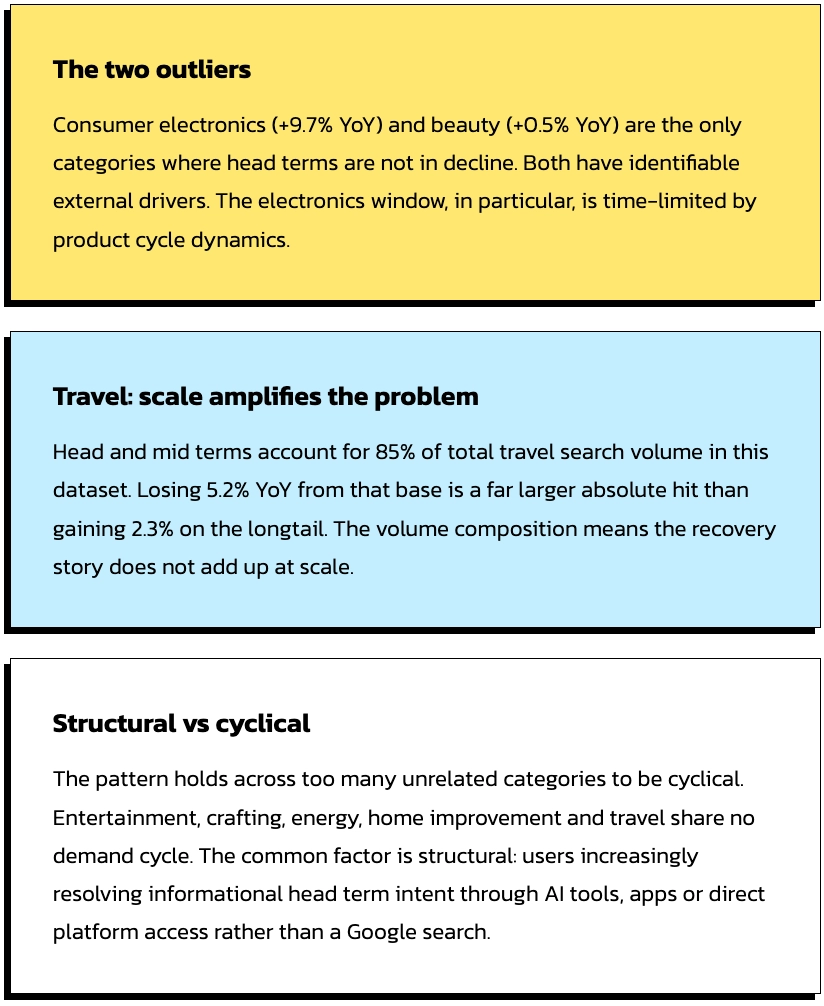
Home Improvement (-8.8%), Energy (-7.4%), and Crafting (-6.8%) also show significant declines. The Travel sector, despite its large volume of searches, is also experiencing a concerning -5.2% year-on-year decline in head term volume, representing tens of millions of lost impressions annually, with 69.6% of individual keywords already in decline.
The exceptions to this trend are Consumer Electronics (+9.7%) and Beauty (+0.5%). The growth in Consumer Electronics is largely fueled by the "AI device supercycle," with new product launches, spec comparisons, and upgrade queries driving genuine head term volume. Beauty’s modest growth reflects the continued influence of social media-driven discovery and trend-led search terms. However, these trends may not be permanent; the forecast for Consumer Electronics already indicates deceleration, with a projected -4.7% for the upcoming twelve months.
Longtail Growth Partially Compensates for Head Term Decline
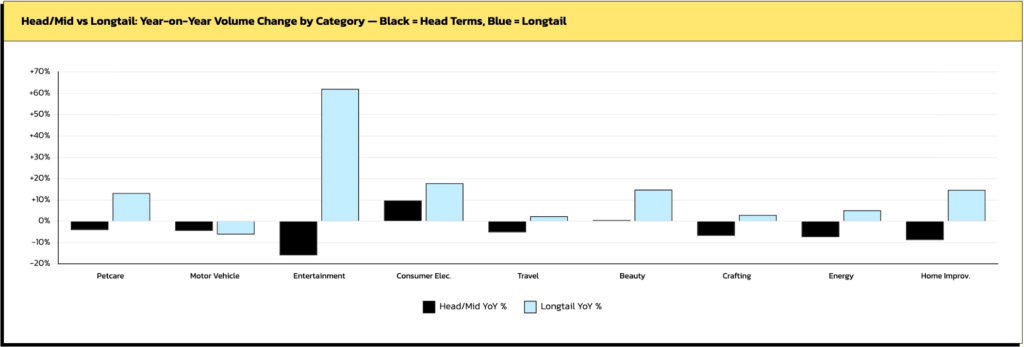
When comparing year-on-year trends for head and longtail terms side-by-side, the scale of divergence becomes apparent. In most categories, the gap is significant. Only in two sectors – Beauty and Consumer Electronics – are both longtail and head term volumes moving in a positive direction. The Motor Vehicles category is unique in that both are declining, suggesting a migration away from Google altogether towards more specialized platforms.
The Entertainment sector exhibits the most dramatic divergence, with head terms falling by -16% while longtail searches surge by +62.1% year-on-year. This substantial longtail growth signifies a profound structural shift in how entertainment-related queries are formulated. Users are moving from broad terms like "Netflix shows" or "best films" to more specific, conversational queries such as "What should I watch on Netflix if I liked Severance?" or "Best British crime drama 2026." Google is increasingly answering many of these with AI, and the volume of such queries is rapidly expanding.
Similar dynamics, albeit on a smaller scale, are observed in Home Improvement (+14.7% longtail, -8.8% head) and Petcare (+13.2% longtail, -4.1% head). While the decline in head terms is real, the growth in longtail offers meaningful compensation in total volume terms. Furthermore, the higher AIO exposure on these longtail queries significantly alters the visibility calculus.
The Motor Vehicles category deviates from this pattern entirely, with both head and longtail volumes declining. This indicates a migration away from Google towards OEM apps, dealer configurators, and automotive-specific search tools. It is the most structurally challenged category within the dataset, lacking any significant longtail recovery.
Comprehensive Category Figures
The full data across all nine categories reveals the nuanced shifts occurring:
- Petcare: Head terms declining (-4.1%), Longtail growing (+13.2%). AIO coverage is highest here.
- Motor Vehicles: Both Head terms and Longtail declining, indicating a broader migration away from Google.
- Entertainment: Head terms plummeting (-16%), Longtail booming (+62.1%). High potential for AI to replace Google search entirely.
- Consumer Electronics: Both Head terms and Longtail showing growth, driven by new product cycles.
- Travel: Significant head term decline (-5.2%), with longtail showing moderate growth.
- Beauty: Modest growth in both Head terms (+0.5%) and Longtail.
- Crafting: Head terms declining (-6.8%), Longtail showing moderate growth (+13.2%).
- Energy: Head terms declining (-7.4%), Longtail showing moderate growth (+8.9%).
- Home Improvement: Head terms declining (-8.8%), Longtail growing significantly (+14.7%).
Methodology Note: The analysis is based on 1.35 million Ahrefs keyword exports across the nine UK categories, captured in May 2026. Historical search volume data spans May 2024 to April 2026, and forecast data covers May 2026 to May 2027. AI Overview presence was identified via SERP Features within Ahrefs data. Volume-weighted AIO rates were calculated by weighting each keyword’s AIO flag against its monthly search volume. Head/mid terms are defined as 1-3 words, and longtail as 4+ words. Year-on-year trends compare average monthly search volumes between Year 1 (May 2024-April 2025) and Year 2 (May 2025-April 2026).
The Evolving Landscape: Three Objectives Where One Existed
The pronounced shift towards longtail queries necessitates a strategic response beyond simply producing more content. The challenge lies in the fact that longtail is now the highest-exposure zone for AI Overviews. Across the analyzed categories, volume-weighted longtail AIO rates range from 23.4% to a striking 58.5%. Consequently, achieving the number one ranking for a longtail query no longer guarantees significant traffic if an AI Overview effectively resolves the user’s intent without requiring a click-through.
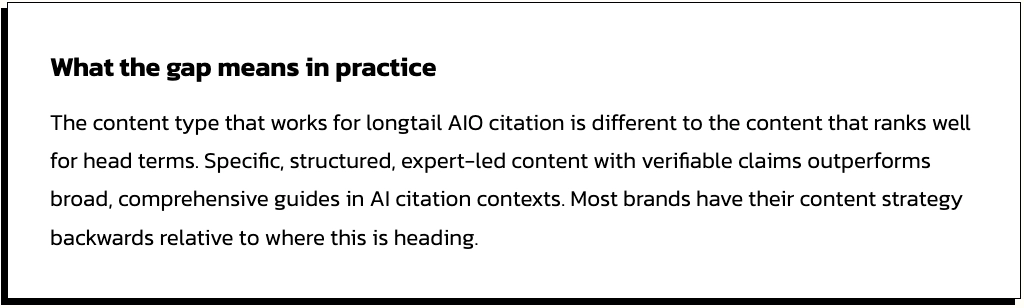
Therefore, optimizing for AI Overview citation has become a parallel objective to traditional ranking. This demands authoritative, well-structured content featuring clear, verifiable claims. This is a departure from the broad, generalized "comprehensive guide" articles that often perform well in traditional organic rankings. Google prioritizes sources it trusts, and trust in this context is built on specificity, demonstrable expertise, and factual precision in addressing the exact question posed. Many brands’ existing content libraries are not adequately structured for this new paradigm.
A third objective has also emerged in categories with high AIO prevalence: achieving zero-click brand presence. When an AI Overview cites a brand as a source, it generates credibility and awareness, even if the user does not click through to the brand’s website. Measuring this form of exposure requires different analytical frameworks than traditional organic traffic reporting, and most current analytics setups are not equipped to capture it.
The volume composition of most categories means that the decline in head term volume has a more significant impact than percentage figures might initially suggest. Head and mid-length terms still account for a substantial majority (65-85%) of total search volume across most sectors. The example of Travel, with 165 million head term searches versus 28 million longtail searches, exemplifies a pattern seen throughout the data. A 5-17% decline in head term volume represents a larger absolute loss than a 15-62% gain on a smaller longtail base, except in the Entertainment sector.
For brands in the two growing categories, Consumer Electronics and Beauty, a more aggressive content investment strategy is currently justified as demand is robust. However, this window may be transient. The projected deceleration in Consumer Electronics and the modest growth in Beauty’s head terms indicate that these positive trends could shift.
Implications for Google’s Ad Revenue Model
Google’s advertising business is heavily reliant on high-volume head term auctions. Bidding on short, broad category terms typically commands significantly higher Cost Per Click (CPC) rates compared to longer, more specific longtail queries. Head terms drive auction depth, which in turn fuels CPC inflation and ultimately boosts Google’s revenue per search. The decline in head term volume, observed at 5-16% annually in several major categories, directly impacts these auction economics. Reduced inventory and competition for the remaining impressions can lead to downward pressure on CPCs, even if advertiser budgets remain constant.
The sectors most vulnerable to this trend include Entertainment (-16% YoY), Energy (-7.4% with a further -8.9% forecast), Home Improvement (-8.8%), and Crafting (-6.8%). Travel, with its massive volume base and widespread keyword decline, presents a particularly concerning scenario.
While longtail growth offers partial compensation through increased ad impressions, the revenue per click is materially lower, inventory is more fragmented, and match type complexity rises. To offset head term revenue decline at scale, Google would require substantially higher longtail volume growth than currently observed, outside of sectors like Consumer Electronics and Entertainment.
A more profound long-term risk for Google lies in the potential for AI Overviews to facilitate a silent attrition of users. If users increasingly turn to AI tools like ChatGPT or Gemini for informational head term queries, they may bypass Google SERPs altogether. These missing queries do not migrate within Google; they simply cease to appear in the data. Entertainment and Crafting are prime candidates for this form of attrition, as conversational AI serves as a credible substitute for Google searches in knowledge and inspiration-seeking contexts.
For paid search advertisers, the immediate implication is that CPCs for head terms in declining-volume categories may experience temporary inflation before potential decline, as constrained supply meets sustained demand. The long-term dynamics will depend on whether advertisers follow the volume migration into longtail searches or maintain head term budget allocations for brand visibility. While most large advertisers will pursue both strategies, slowing the adjustment process, the overall shift is underway, and its scale is evident in the current data.
Data Gathering and Analysis Methodology
The comprehensive findings presented in this report are derived from a rigorous data collection and analysis process.
Data Source: All keyword data was exported from Ahrefs, a leading platform for search engine optimization data. Ahrefs continuously crawls the web, collecting live SERP data at scale, including the presence of various SERP features for any given keyword. AI Overview presence is specifically tracked as a SERP feature within Ahrefs’ keyword data.
Dataset Size and Scope: The analysis encompasses 1.35 million keywords across nine key UK consumer categories: Petcare, Motor Vehicles, Entertainment, Consumer Electronics, Travel, Beauty, Crafting, Energy, and Home Improvement. Each category dataset contains up to 150,000 keywords, all representing UK (gb) search queries captured in May 2026.
AI Overview Identification: A keyword was classified as having an AI Overview if "AI Overview" was present in the SERP Features column of the Ahrefs export. Volume-weighted AIO rates were calculated by weighting each keyword’s AIO flag against its monthly search volume. This methodology provides a more representative picture of user exposure to AI Overviews than a simple count of keywords, as it accounts for the actual search volume associated with each keyword.
Volume-Weighting Rationale: The use of volume-weighting is critical. For example, in Petcare, a keyword like "dog food" (500,000 searches/month) and "labrador puppy grain-free wet food pouches" (50 searches/month) would be counted equally in a simple keyword count. However, "dog food" represents 10,000 times more user experience. Volume-weighting ensures that the proportion of search volume exposed to an AI Overview is accurately reflected, mitigating the skew caused by thousands of niche longtail keywords with minimal individual search volumes. The "Overall AIO %" column, however, uses a count-based method to answer the question of what percentage of keywords in a space feature an AIO at all, providing insight into content coverage.

Search Volume Trends: Ahrefs provides a monthly search volume time series for each keyword. The historical data covers May 2024 to April 2026 (24 data points), and the forecast data extends from May 2026 to May 2027 (13 data points), generated using Ahrefs’ internal forecasting model. Year-on-year trends were calculated by comparing the average monthly volume across Year 1 (May 2024-April 2025) against Year 2 (May 2025-April 2026). Keywords with incomplete series were excluded from trend calculations.
Keyword Classification: Keywords were classified by word count: 1-3 words as head/mid terms, and 4 or more words as longtail. This standard industry classification aligns with typical shifts in query intent as length increases. All volume-weighted figures utilize the Ahrefs-reported monthly search volume as the weighting factor.
Limitations: It is important to acknowledge that AI Overview presence is a snapshot in time, as Google’s deployment of these features is dynamic. Ahrefs’ SERP crawls capture a robust sample but do not represent a complete census of every query at every moment. Forecast data is model-generated and should be considered directional rather than definitive.
The findings from this study present a critical juncture for brands operating within the digital ecosystem. The undeniable shift towards longtail queries, coupled with the pervasive influence of AI Overviews, mandates a strategic re-evaluation. The traditional emphasis on ranking may need to be augmented by a more nuanced approach that prioritizes citation within AI Overviews and cultivates a strong zero-click brand presence. The window to adapt is narrowing, and proactive strategic adjustments are essential for sustained organic search visibility and success in the evolving digital landscape.