
Crazy Egg, a pioneer in the field of user experience (UX) and conversion rate optimization (CRO), has officially launched its newest feature, the Astro Map, as part of its comprehensive Web Analytics suite. This update marks a significant shift in how digital marketers, web developers, and business owners interact with live user data, transitioning from traditional numerical tables to a fully visualized, real-time environment. By representing website visitors as extraterrestrial figures landing on planetary representations of web pages, the Astro Map aims to simplify the complexity of data interpretation. The company has confirmed that this feature is now available to all users, emphasizing that its Web Analytics service remains free across all subscription tiers, including the most basic plans.
The Evolution of Real-Time Web Analytics
The introduction of the Astro Map comes at a critical juncture in the evolution of web telemetry. Historically, web analytics platforms have relied heavily on historical data, often requiring hours or even days to process and present user interactions. While Google Analytics 4 (GA4) and other competitors have made strides in real-time reporting, the data is frequently presented in abstract formats, such as bar charts or geographic heatmaps.
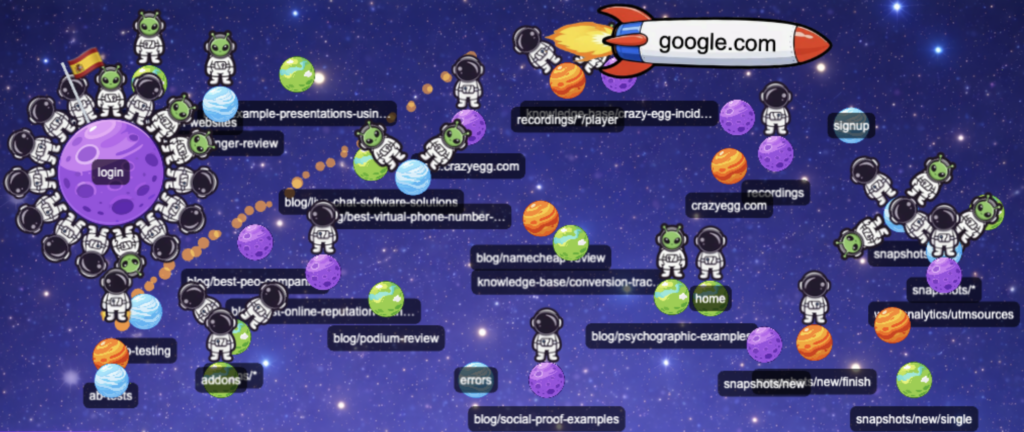
The Astro Map departs from this convention by utilizing a gamified visual interface. When a user selects the “Today” date range within the Crazy Egg dashboard, the interface transforms into a dynamic space-themed map. Individual visitors are depicted as either astronaut or alien icons, providing an immediate sense of scale and activity without requiring the user to interpret raw digits. This move reflects a broader trend in the software-as-a-service (SaaS) industry toward "data democratization," where tools are designed to be accessible to non-technical stakeholders who may find traditional data science reports overwhelming.
Technical Specifications and Visual Metaphors
The Astro Map functions through a series of logical metaphors designed to communicate complex user journeys at a glance. According to the product documentation, each visitor’s presence is tracked using real-time pings. When a visitor arrives at a site, they are shown landing on a specific "planet," which represents an individual URL or page on the website.
The navigation path is also visualized through the use of "rockets." If a visitor arrives from an external source—such as a social media platform, a search engine, or a backlink—a rocket icon is shown dropping the visitor off at their destination. This provides immediate visual feedback on which marketing channels are currently driving traffic.
Furthermore, the Astro Map incorporates real-time event monitoring. Unlike static reports that summarize behavior after the session has ended, the Astro Map displays actions as they occur. These actions are categorized into five primary triggers:
- Visits: The initial landing of the user.
- Scrolls: Indication of content engagement and depth of reading.
- Clicks: Interaction with specific UI elements or navigation links.
- Conversion Goals: Success metrics such as form submissions or purchases.
- Errors: Technical failures, such as 404 pages or broken scripts, which are highlighted to allow for immediate troubleshooting.
These actions appear in speech bubbles above the visitor icons, allowing administrators to see, for instance, if a specific group of users is currently encountering errors on a checkout page.
Detailed User Profiling and Granular Data Access
While the high-level view offers a celestial overview of site health, the Astro Map allows for deep-dive investigations into individual user behavior. By clicking on any specific astronaut or alien figure, site owners can access a detailed visitor profile. This profile includes the visitor’s geographic location (country), the device type utilized (mobile, desktop, or tablet), the specific referrer URL, and a chronological log of their recent activity on the site.
This level of detail is particularly useful for identifying "rage clicks"—a phenomenon where a user clicks repeatedly on a non-responsive element—or for understanding the specific path a high-value customer takes before completing a conversion. The integration of the activity log within the real-time map bridges the gap between high-level traffic monitoring and individual session recording, which has long been a core offering of the Crazy Egg platform.
Strategic Market Positioning and Financial Implications
The decision to offer the Astro Map and the broader Web Analytics suite for free is a strategic move by Crazy Egg to capture a larger share of the mid-market and enterprise analytics sectors. By removing the cost barrier for advanced real-time analytics, Crazy Egg positions itself as a primary alternative to both the free version of Google Analytics and paid competitors like Hotjar or FullStory.
Market analysts suggest that this "freemium" approach for analytics serves as a gateway for Crazy Egg’s paid features, such as Heatmaps, Confetti Reports, and A/B Testing tools. By providing a high-value visualization tool like the Astro Map at no cost, the company increases its platform stickiness, making it more likely that users will upgrade to paid tiers to access deeper optimization features.
In a statement regarding the release, the development team noted that the primary goal was to eliminate the need for "number crunching." For small business owners who may only have a few minutes a day to check their site performance, the ability to see a visual representation of "who is on the site right now" provides more actionable psychological satisfaction than a spreadsheet.
Industry Reaction and UX Implications
The response from the digital marketing community has been largely positive, particularly regarding the tool’s utility in live event monitoring. For e-commerce sites running flash sales or influencers launching new content, the ability to watch traffic move through the site in real time allows for immediate adjustments. If a "rocket" drops off a large number of visitors from a specific campaign and they all immediately "bounce" or encounter an "error" bubble, the marketing team can halt or fix the campaign in minutes rather than hours.
UX designers have also noted the benefits of the Astro Map for qualitative research. Understanding the "flow" of a website often requires complex path analysis. The planetary grouping of visitors on the Astro Map provides an intuitive sense of "traffic jams"—pages where users are congregating—and "dead zones"—pages that are currently empty.
However, some data privacy advocates have raised questions regarding the granularity of real-time tracking. Crazy Egg has addressed these concerns by emphasizing that the data is anonymized and compliant with major privacy regulations, including the General Data Protection Regulation (GDPR) and the California Consumer Privacy Act (CCPA). The Astro Map does not display personally identifiable information (PII), focusing instead on behavioral patterns and technical metadata.
Chronology of Crazy Egg’s Innovation
The launch of the Astro Map is the latest in a series of updates intended to modernize the Crazy Egg ecosystem.
- 2006: Crazy Egg launches as one of the first dedicated heatmap tools, founded by Neil Patel and Hiten Shah.
- 2010-2015: The company expands its toolset to include Scrollmaps and Confetti Reports, allowing users to see where traffic comes from based on click data.
- 2017: Introduction of A/B testing and basic site editing tools directly within the platform.
- 2020: Crazy Egg begins integrating more traditional web analytics to compete with Google Analytics, moving beyond simple heatmaps.
- 2023: The announcement of the free Web Analytics tier for all users.
- Current: The release of the Astro Map, signifying a shift toward immersive, real-time data visualization.
Broader Impact on the Digital Landscape
The release of the Astro Map reflects a significant change in the "attention economy" of the back-end web. As website owners are bombarded with more data than ever before, the value of that data is increasingly tied to how quickly and easily it can be understood. Tools that offer visual storytelling over raw data are becoming the standard in the industry.
Furthermore, the inclusion of error tracking within a real-time visual map changes the relationship between marketing and IT departments. Typically, a marketing team might notice a drop in conversions and then request a technical audit. With the Astro Map, the marketing team can see "error" bubbles appearing in real-time and alert the technical team immediately, potentially saving thousands of dollars in lost revenue during high-traffic periods.
As Crazy Egg continues to roll out the Astro Map to its global user base, the long-term impact will likely be seen in how small-to-medium enterprises (SMEs) approach their daily site management. By making the "unseen" visitors of the internet visible as tangible characters, Crazy Egg has humanized the data stream, providing a clearer window into the digital experience.
The Astro Map is currently live and accessible through the Web Analytics tab for all registered Crazy Egg accounts. Users can toggle the view by selecting the "Today" date range, allowing for an immediate leap into the real-time celestial visualization of their website’s ecosystem.