 Pevita Pearce
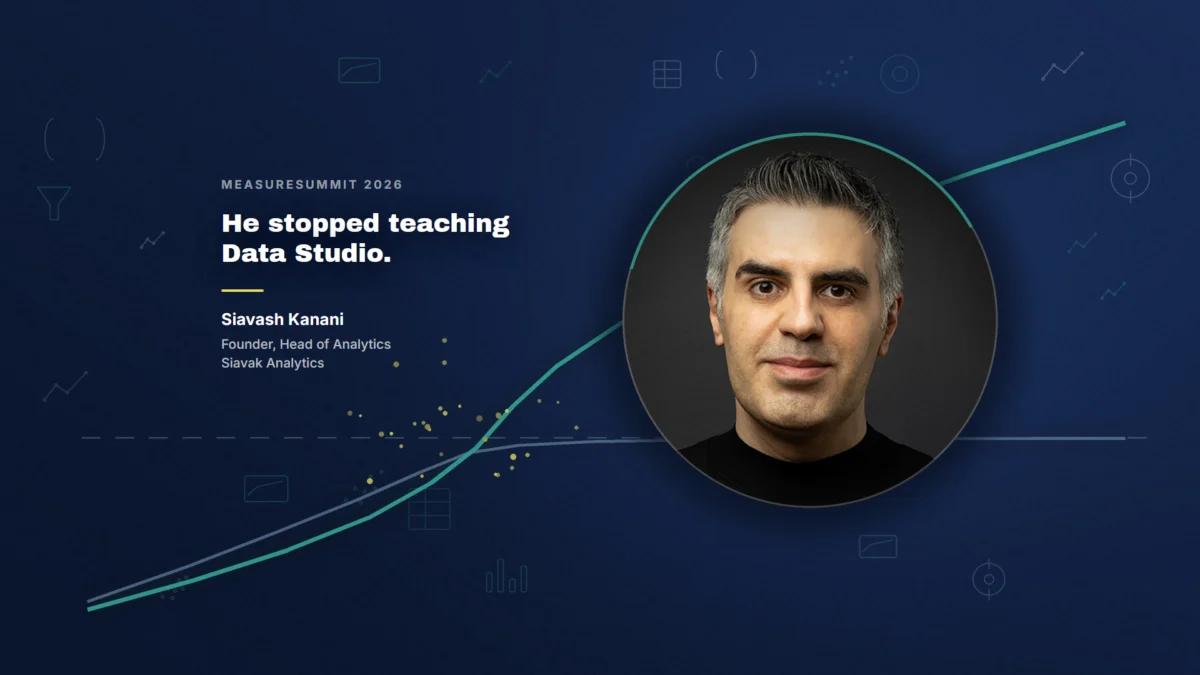
The landscape of digital measurement and business intelligence is undergoing a fundamental shift as prominent educators and practitioners begin to distance themselves from established platforms like Google’s Data Studio. Siavash Kanani, a leading figure in the analytics community who has spent the last five years training over a thousand students in the nuances of Data Studio masterclasses, recently announced a total cessation of his educational programs focused on the tool. This decision, shared during a keynote at the industry-leading MeasureSummit, signals a growing discontent among high-level power users regarding Google’s strategic direction and the inherent technical limitations of its free reporting environment. Kanani’s pivot from teaching a standardized tool to developing custom, AI-assisted software applications reflects a broader industry trend where the "ceiling" of no-code platforms is being bypassed by the accessibility of large language models (LLMs) and custom code.
The Strategic Ambiguity of Google’s Reporting Ecosystem
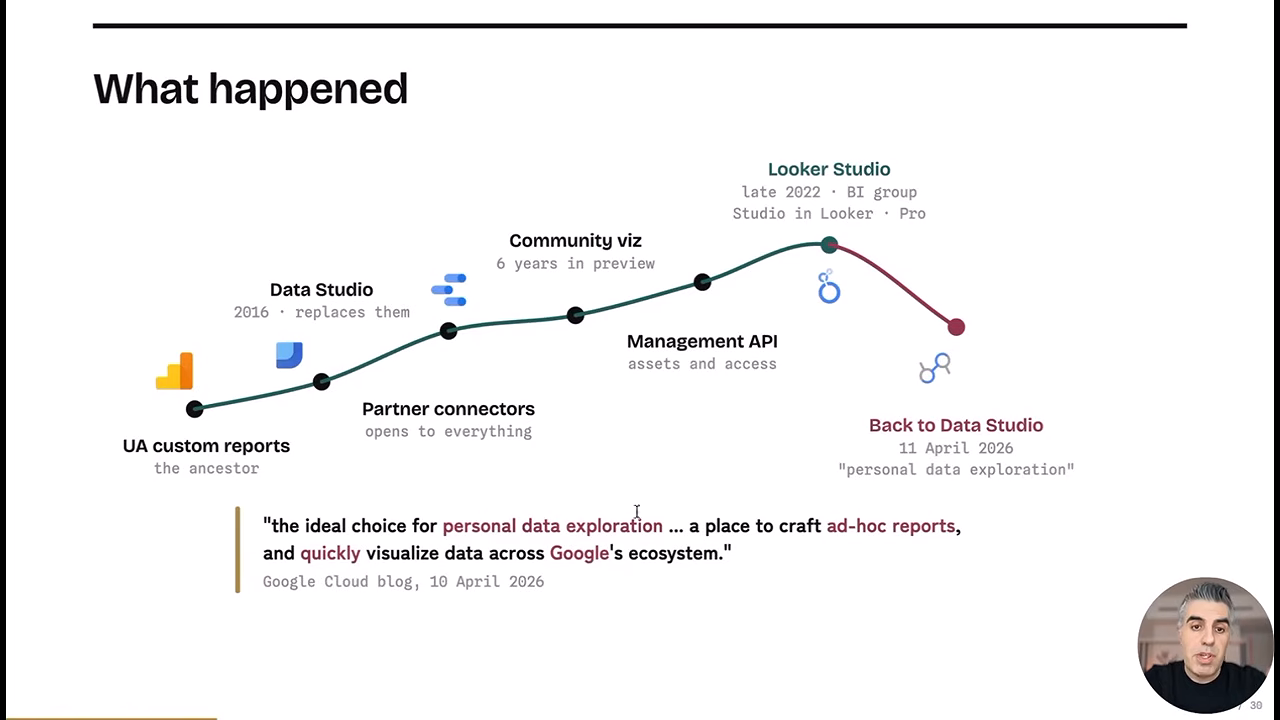
The primary catalyst for this shift appears to be a lack of clarity in Google’s long-term roadmap for its visualization products. Since its inception, the tool originally known as Data Studio has undergone several identity crises that have left agencies and enterprise users questioning its reliability as a foundational business asset. In 2016, Data Studio was launched as a user-friendly, collaborative reporting tool designed to integrate seamlessly with the Google Marketing Platform. However, following Google’s $2.6 billion acquisition of Looker in 2019, the company attempted to merge the two distinct philosophies—the "ad hoc" flexibility of Data Studio and the "governed data" rigor of Looker—under the unified brand of Looker Studio in late 2022.
Industry analysts have noted that this rebranding created significant friction. While Looker is a high-end enterprise business intelligence platform requiring specialized knowledge of LookML, Data Studio was built for accessibility. Recent updates to Google’s documentation have further muddied the waters, with references shifting back toward "Data Studio" nomenclature for certain segments of the product. Google’s own internal documentation now characterizes the tool as an "ideal choice for personal data exploration" and "ad hoc reports," a description that stands in stark contrast to the needs of professional agencies that require robust, white-labeled, and scalable client reporting solutions.
The strategic misalignment is further evidenced by the evolution of Google Analytics 4 (GA4). Rather than relying on Data Studio as its primary visualization layer, GA4 has increasingly built its own internal dashboarding and "Explore" features. This internal redundancy suggests that even within Google, Data Studio is no longer viewed as the definitive destination for data storytelling. For experts like Kanani, this lack of clear direction represents a significant risk for businesses that have built their entire reporting infrastructure on the platform.
Identifying the Local Maximum: The Technical Ceiling
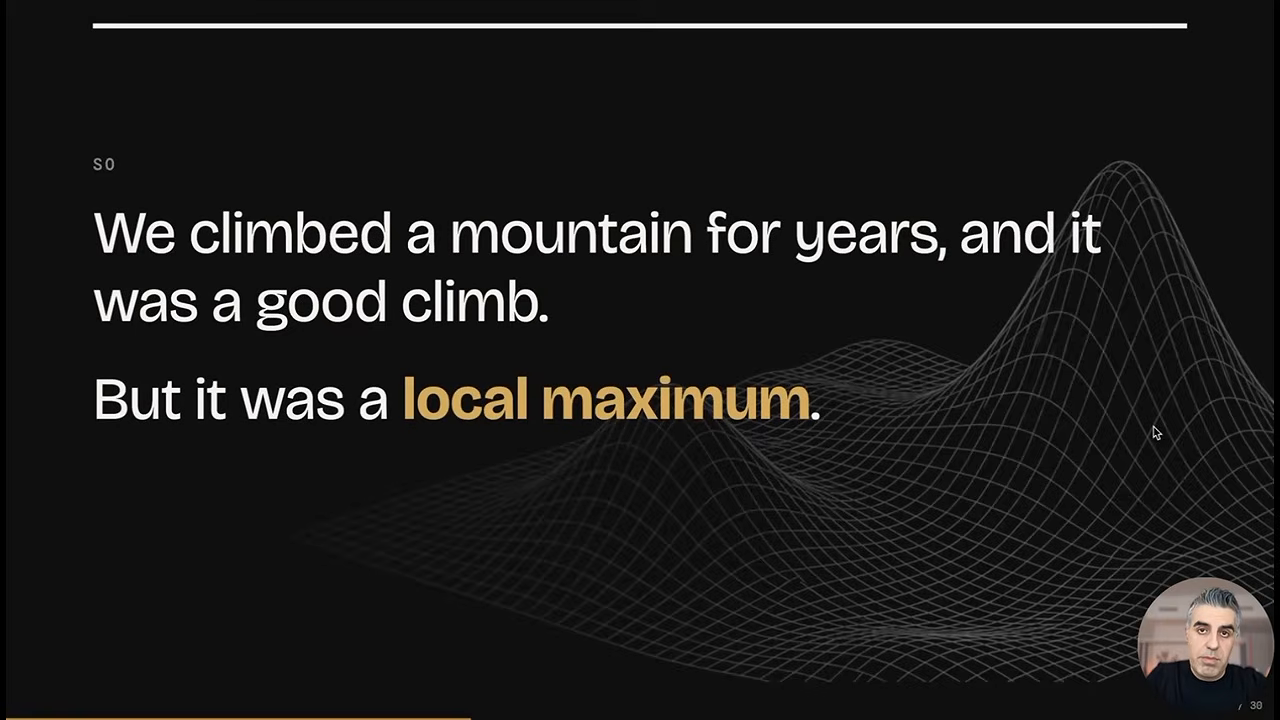
For years, the analytics community has operated within what Kanani describes as a "local maximum"—a point where users have mastered a tool to its fullest extent but find that further progress is blocked by the tool’s inherent architecture. Data Studio was designed to be a "what you see is what you get" (WYSIWYG) editor, which prioritized ease of use over deep customization. While this made it an industry standard for quick prototypes and basic marketing dashboards, it created several "deal-breaker" limitations for advanced users:
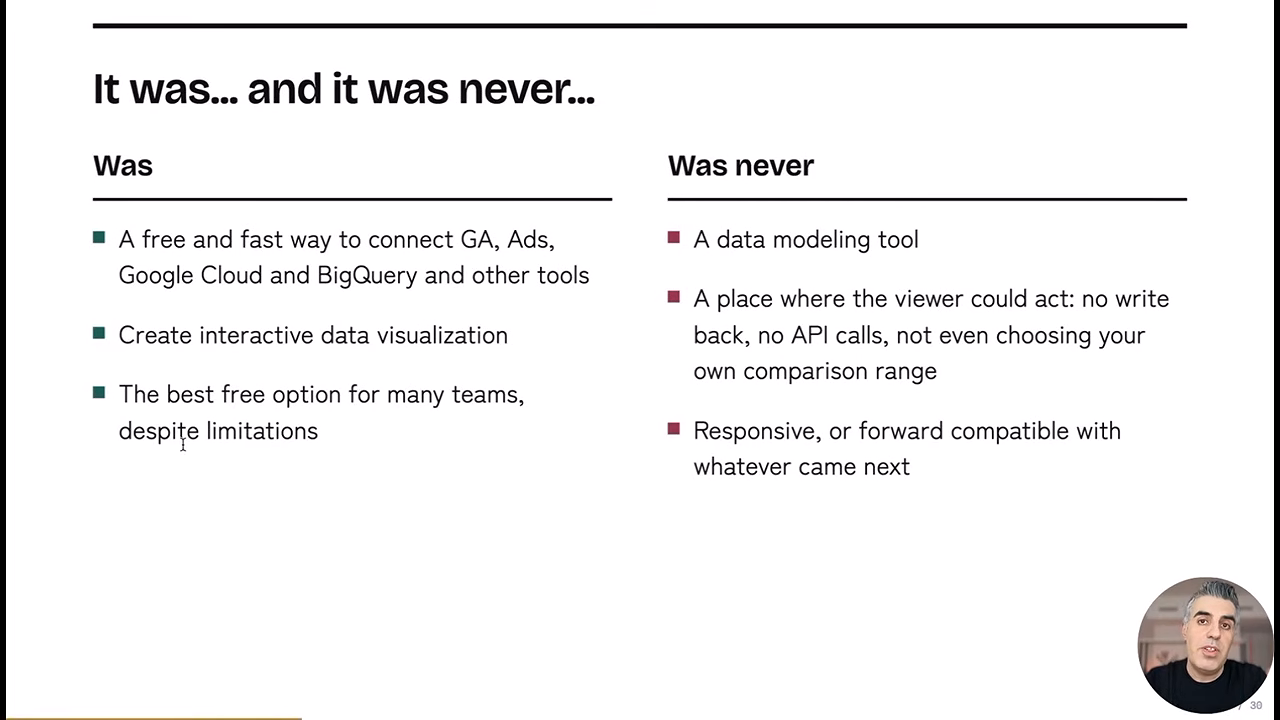
- Stagnant Developer Features: The "Community Visualizations" feature, which allows developers to build custom chart types using JavaScript, has remained in "Developer Preview" for over six years. This lack of movement into a stable, fully supported production feature has signaled a low priority for developer-centric growth.
- Branding and User Experience Constraints: Agencies are often unable to fully white-label the experience. Users are forced to interact with the Google-branded interface, and custom navigation or complex interactive elements are difficult, if not impossible, to implement.
- Performance and Caching Issues: As data sets grow in complexity, Data Studio often suffers from slow load times and rigid caching mechanisms, which can lead to a poor experience for the end client.
- The "Workaround" Culture: Power users have historically relied on third-party tools to patch the holes in Data Studio’s functionality. Tools like "Telepathy" or "Triggers" were developed specifically to add features—such as automated email alerts or advanced data blending—that the native platform lacked.
Kanani’s realization was that these third-party additions were not truly products, but rather "workarounds wearing product names." When he attempted to upgrade "Watson," his widely used GA4 audit tool, he found that nine out of ten desired features were technically impossible to execute within the confines of Data Studio. This technical wall, combined with the rising power of AI, became the turning point for his departure from the ecosystem.
The AI Catalyst: Lowering the Barrier to Custom Development
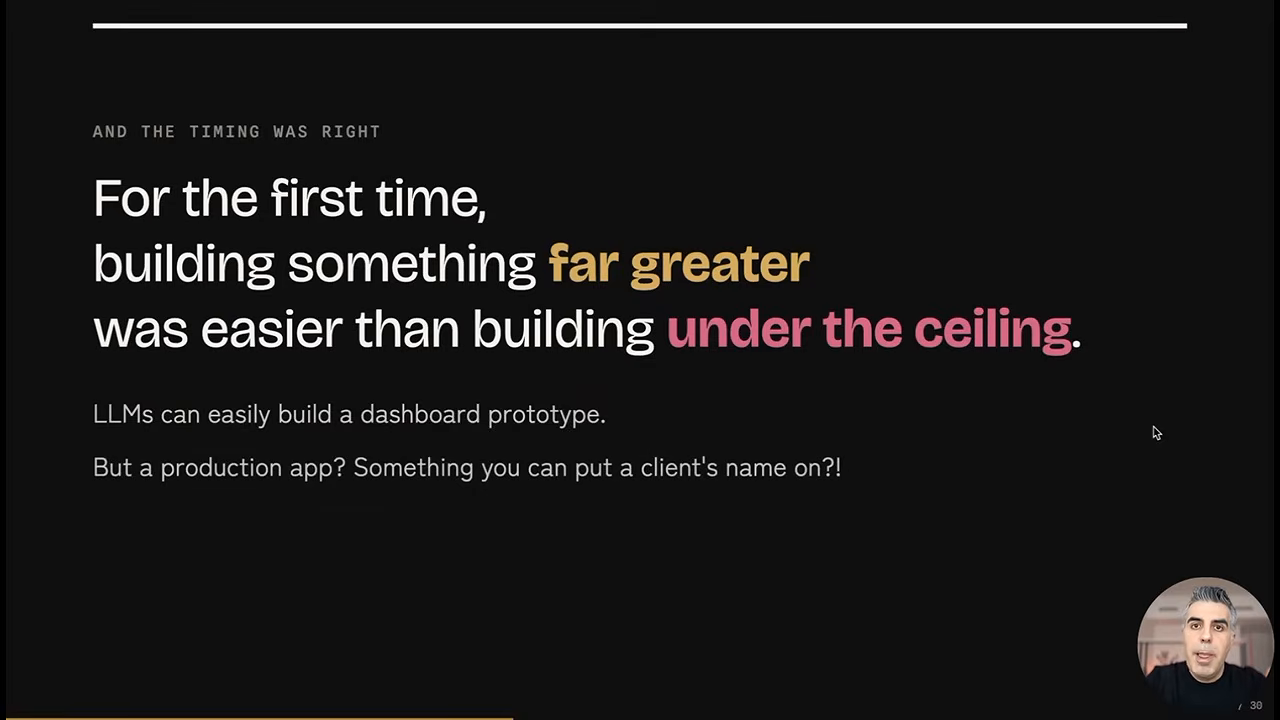
The emergence of sophisticated Large Language Models, such as Anthropic’s Claude and OpenAI’s GPT-4, has fundamentally altered the cost-benefit analysis of building custom software versus using off-the-shelf BI tools. Historically, an analytics professional would need to hire a full-stack development team to build a custom reporting application—a process costing tens of thousands of dollars and taking months to complete.
Today, LLMs can act as an intermediary, reading API documentation for platforms like Google Analytics 4, BigQuery, and Supermetrics, and then writing the necessary boilerplate code to connect these services. This allows non-developers with a strong grasp of data logic to act as "architects" of their own software. Kanani demonstrated that by using AI, he was able to rebuild his audit tool from scratch as a standalone Software-as-a-Service (SaaS) application.
This shift has enabled a new paradigm of "Adaptive Reporting." Unlike static dashboards where one view must serve all users, custom applications allow for dynamic views tailored to the viewer’s role. A CEO can see a high-level narrative view with AI-generated summaries, while an operational manager can toggle to a granular, exploratory view of the same data. Features that were once considered "impossible"—such as dynamic section titles that update based on cross-filters, or integrated commenting systems directly linked to data points—are now becoming standard in these custom-built environments.
The Boring 80%: The Reality of Production-Grade Apps
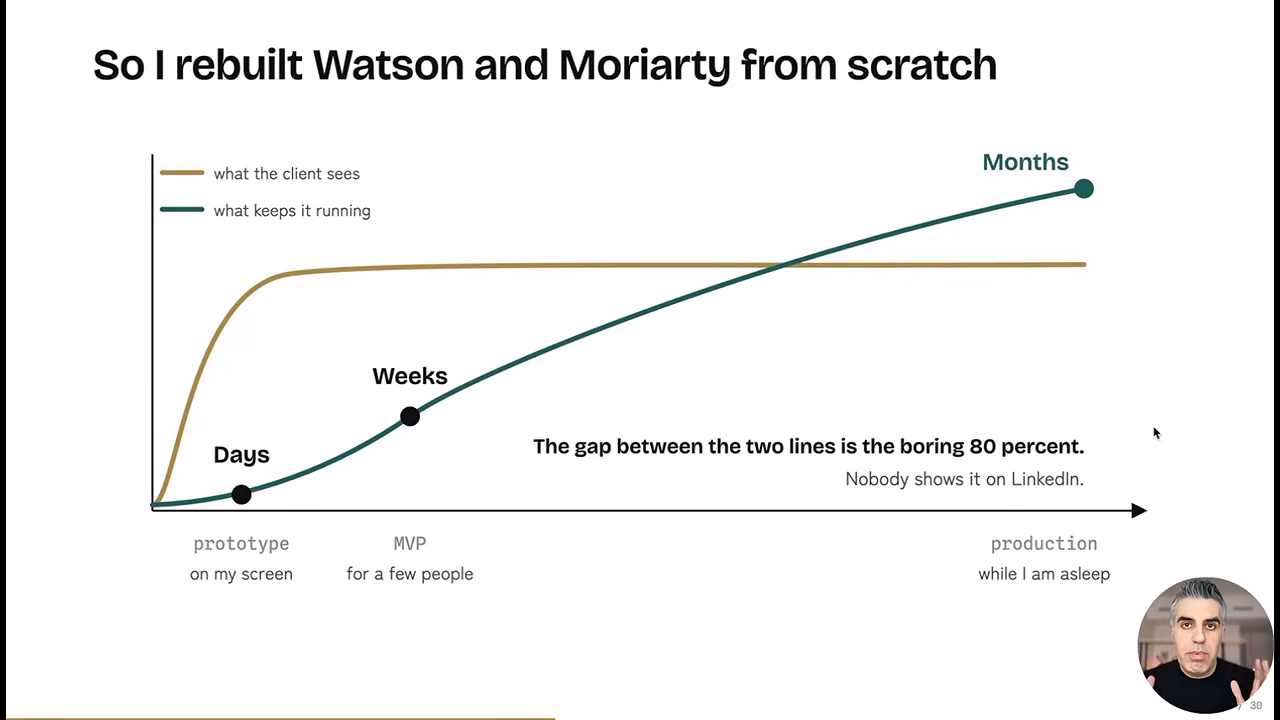
Despite the ease of creating prototypes with AI, the transition to custom software is not without its challenges. Kanani introduces the concept of "The Boring 80%," referring to the massive gap between a working demo and a production-ready application. While a prototype can be built in days, and a Minimum Viable Product (MVP) in weeks, reaching a stage where an application can be reliably sold to clients or used at scale requires months of "unsexy" production work.
This "Boring 80%" includes critical infrastructure that BI tools typically handle out of the box:
- Authentication and Security: Managing user logins, permissions, and data privacy.
- Hosting and Deployment: Setting up servers (e.g., Vercel, AWS) and managing the code repository (GitHub).
- Data Orchestration: Ensuring that APIs are called efficiently and that data is processed and cached correctly to manage costs and performance.
- UI/UX Refinement: Moving beyond basic charts to implement professional libraries like D3.js or Highcharts for superior data visualization.
The movement toward custom apps is therefore not a suggestion that Data Studio is "dead" for everyone, but rather that it is no longer the "ceiling" for those who wish to provide premium, differentiated services. For small businesses with basic needs, Data Studio remains a viable, cost-effective option. However, for agencies looking to escape the commoditization of reporting, the investment in the "Boring 80%" is increasingly seen as a necessary step to maintain a competitive advantage.
Industry Implications and the Future of Measurement
The ripple effects of this shift are already being felt within the measurement community. Other practitioners have reported similar successes in bypassing traditional BI tools. For instance, Vojtech Audy, a former student of Kanani’s masterclass, reported building a custom reporting interface connected to BigQuery in less than two days using Claude. His custom solution featured faster load times, better branding, and a secure user login—all at a speed that rivaled the creation of complex reports in Data Studio.
This trend suggests a bifurcated future for the business intelligence market. On one side, large-scale enterprise tools like Power BI and Tableau will continue to dominate the corporate landscape where governance and IT oversight are paramount. On the other side, a new wave of "Micro-SaaS" reporting tools, built by domain experts rather than traditional software engineers, will emerge to serve specific niches.
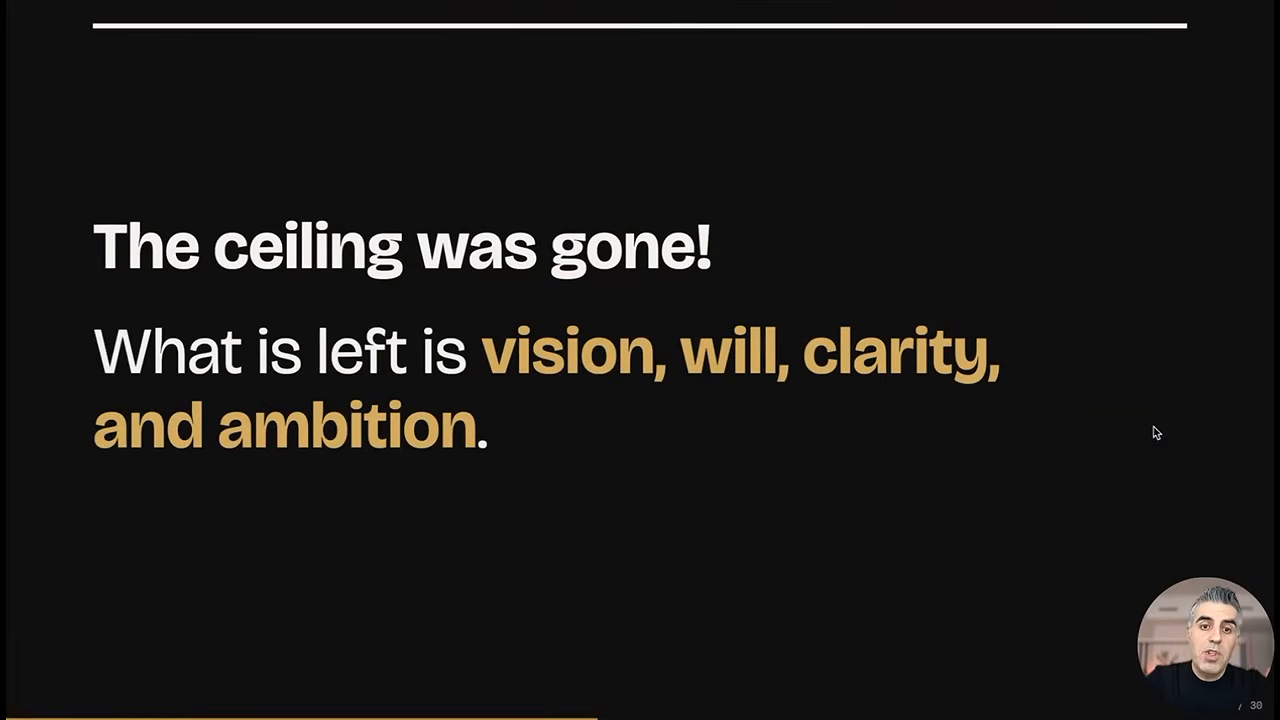
The departure of high-profile educators from the Data Studio ecosystem marks a significant moment of maturity for the industry. It signals that the "no-code" era is evolving into a "low-code" era, where the ability to direct AI in the creation of custom solutions is becoming a more valuable skill than the mastery of any single proprietary platform. For the analytics professional, the message is clear: the tools are no longer the limit; the limit is now defined by one’s own vision, clarity of purpose, and the willingness to navigate the complexities of custom development. As the "ceiling" of Data Studio disappears, the focus shifts from learning where the buttons are to understanding how to build the machine itself.

 Neng Nana