


The practice of Conversion Rate Optimization (CRO) has evolved from simple button-color testing into a sophisticated discipline centered on data science and behavioral economics. However, a persistent challenge remains at the intersection of experimentation and financial planning: the difficulty of accurately forecasting how experimental "lifts" translate into long-term revenue. Within the digital marketing industry, the leap from a statistically significant 10% lift in a controlled test to a 10% increase in monthly recurring revenue is often viewed with skepticism. This skepticism is rooted in the inherent complexity of digital ecosystems, where internal changes are constantly buffeted by external market forces.

To bridge this gap, practitioners are increasingly adopting more rigorous, conservative modeling techniques that move beyond simplistic multiplication. The goal is to provide executive leadership with a realistic financial outlook that accounts for statistical variance, novelty effects, and the natural decay of experimental impact over time.
The Foundation of Causality in Digital Experimentation
The primary reason revenue forecasting remains a point of contention is the difficulty of isolating variables in a live business environment. Traditional pre-post comparisons—where a change is made and performance is compared to the previous month—are notoriously unreliable. A 10% increase in revenue following a website redesign might be attributed to the new UI, but it could just as easily be the result of a seasonal holiday, an increased ad spend, or a competitor going out of stock.

Controlled, randomized A/B testing remains the "gold standard" for proving causality because it allows for the simultaneous comparison of a control group and a variant under identical conditions. This methodology, borrowed from clinical trials in the medical industry, ensures that any observed difference in performance is likely due to the change itself rather than external factors like keyword ranking shifts or macroeconomic changes.
However, even with a robust A/B test, the quality of a revenue forecast is entirely dependent on the statistical power of the experiment. Practitioners must ensure that their tests have sufficient sample sizes to reach a high level of confidence (typically 95%) and that the Minimum Detectable Effect (MDE) is calibrated to the business’s specific needs. Without these safeguards, any revenue projection built on top of the data is essentially built on sand.
The Reality Gap: Why Winning Tests Don’t Always Scale
A common pitfall in CRO reporting is the "linear scaling fallacy." This occurs when a team observes a 5% increase in conversion rate during a two-week test and assumes that the company’s $100 million annual revenue will consequently grow by $5 million. In practice, this rarely happens for several technical and behavioral reasons.
First, there is the "Novelty Effect." Users often react positively to a change simply because it is new. As the change becomes part of the standard user experience, the initial excitement—and the associated lift—often tapers off. Second, there is the issue of "Regression to the Mean." Extreme results in a short-term test often moderate over a longer period. Finally, there are technical discrepancies; the tools used to track experiments (like Convert or Optimizely) often use different attribution models than the back-end financial systems used by the accounting department.
Furthermore, political considerations within an organization necessitate a cautious approach. Over-promising on revenue gains that do not materialize in the quarterly earnings report can lead to a loss of credibility for the experimentation team. This can result in reduced budgets or the deprioritization of CRO as a strategic lever.
Constructing a Conservative Revenue Projection Model
To combat these challenges, industry leaders recommend a "conservative-first" approach to modeling. This involves applying a series of "haircuts" and adjustments to the raw data to ensure the final number is defensible.
The 10% "Haircut" and Baseline Adjustments
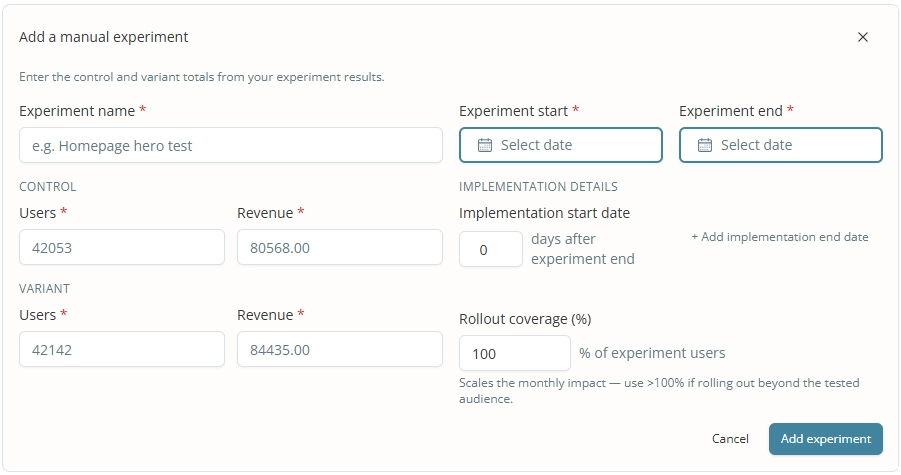
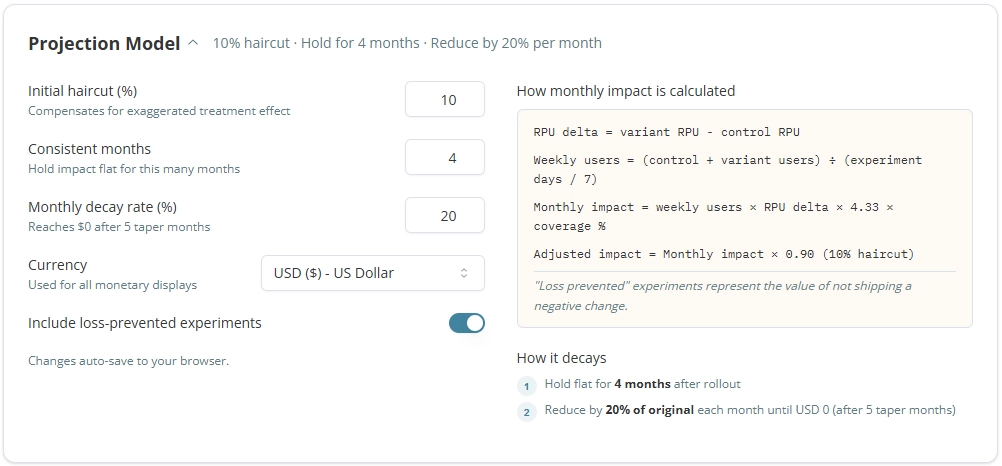
The first step in a professional forecast is to apply an immediate reduction to the observed lift. If a test shows a 10% improvement, a conservative model might only credit the experiment with a 9% lift. This accounts for the inevitable "noise" in the data and the minor discrepancies between testing tools and actual revenue collectors.
Rollout Coverage and Traffic Targeting
It is essential to distinguish between the users involved in the test and the users who will see the permanent change. If an experiment was conducted only on mobile users, but the change is implemented sitewide, the revenue impact must be weighted by the proportion of mobile traffic. Conversely, if a change is tested on a specific high-traffic product page, the forecast must reflect that the lift only applies to that specific segment, not the entire site’s revenue.

The Decay Factor and Duration of Impact
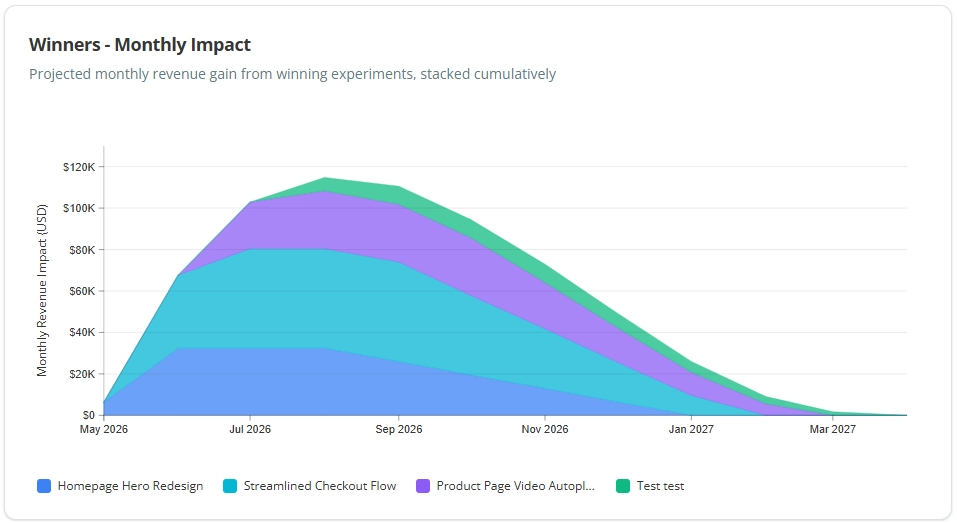
Perhaps the most overlooked aspect of revenue forecasting is the "shelf life" of an optimization. A winning headline might be highly effective for four months, but as market trends shift or competitors update their messaging, the effectiveness of that headline will likely decline. A robust model assumes a "steady state" for a few months (e.g., four months), followed by a monthly decay rate (e.g., 20%). This reflects the reality that the digital landscape is not static and that today’s "winner" will eventually become tomorrow’s baseline.
A Step-by-Step Methodology for Financial Calculation
For organizations looking to implement this level of rigor, the calculation process follows a logical progression. This methodology can be managed manually via spreadsheets or through specialized experimentation analytics platforms like Katsed.
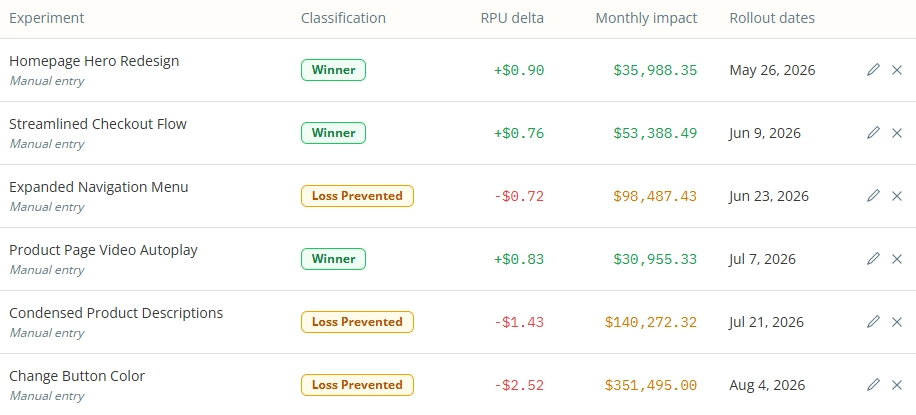
- Identify the Metric: Focus on Revenue Per User (RPU) or Average Order Value (AOV) rather than just conversion rate, as these more directly correlate to financial health.
- Calculate the Delta: Determine the absolute difference in RPU between the control and the variant.
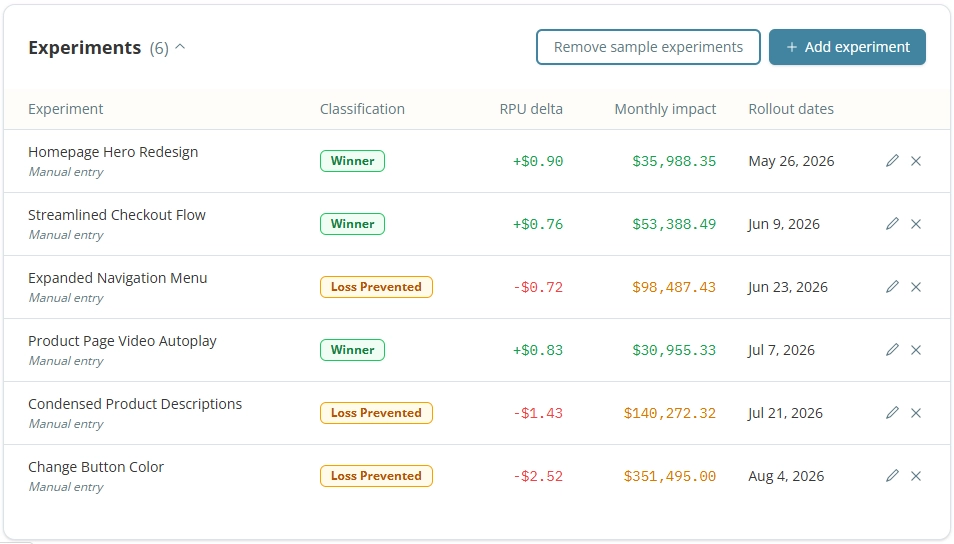
- Define Implementation Timing: Account for the "shipping delay"—the time between when a test ends and when the engineering team actually pushes the code to production.
- Apply the Projection Model: Multiply the RPU lift by the expected monthly traffic, then apply the 10% haircut, the steady-state period, and the subsequent decay rate.
- Aggregate Cumulative Gains: For teams running multiple experiments, the gains must be stacked. However, they should not be stacked linearly; the model must account for the fact that multiple changes interact with one another.
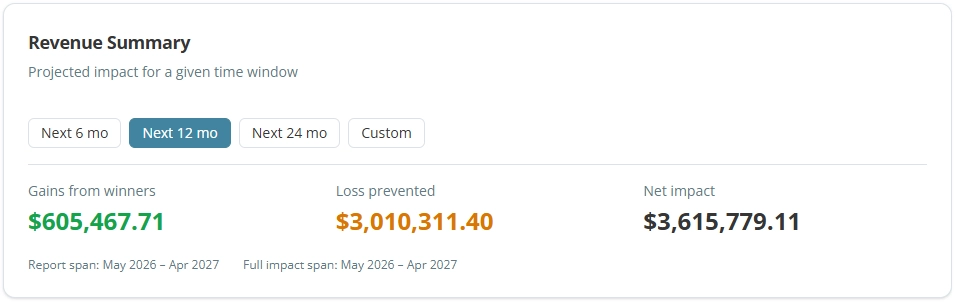
By repeating this for every winning experiment and adding the results, a team can produce a "Cumulative Projected Revenue Gain" chart. This visualization is far more valuable to an executive than a list of p-values, as it shows the total value added to the company over a fiscal year.
Proving Return on Investment (ROI)
Revenue forecasting is only one side of the coin; the other is the cost of the program. To prove the true ROI of a CRO initiative, the projected revenue gains must be weighed against the total investment. This investment includes:
- Software Costs: Subscriptions to A/B testing platforms, heatmapping tools, and analytics suites.
- Human Capital: Salaries for CRO strategists, data analysts, and UX designers.
- Engineering Opportunity Cost: The value of the developer time spent building and implementing tests instead of working on other product features.
- Agency Fees: If the program is outsourced, the monthly retainers paid to external partners.
When these costs are subtracted from the conservative revenue forecast, the resulting figure provides a clear, defensible ROI. For many mid-to-large-scale enterprises, a well-run experimentation program can yield an ROI of 5x to 10x, making it one of the most efficient uses of marketing and development capital.
The Broader Impact on Corporate Strategy
Adopting a formal revenue forecasting model for experimentation has implications that reach beyond the marketing department. It changes the culture of the organization from one based on "opinion and intuition" to one based on "evidence and probability."
When the C-suite sees that the experimentation team is using conservative, realistic models, trust increases. This trust allows the team to take bigger risks on "bold" experiments that might have a higher failure rate but offer the potential for transformative gains. It also aligns the experimentation program with the company’s broader financial goals, such as EBITDA growth or customer lifetime value (CLV) expansion.
Furthermore, this level of reporting prepares the organization for more advanced forms of personalization and AI-driven optimization. As machine learning models begin to automate the testing process, having a solid human-led framework for evaluating financial impact ensures that the technology remains tethered to business reality.

Conclusion
Forecasting revenue from CRO experiments is not an exact science, but it is a necessary discipline for any program seeking to move beyond the tactical level. By accepting that every forecast is a model—and that all models are approximations—practitioners can provide stakeholders with the clarity they need to make informed investment decisions. The key lies in the combination of statistical rigor at the experiment level and conservative financial modeling at the reporting level. When done correctly, this approach transforms A/B testing from a series of isolated wins into a predictable engine for business growth.







