The Statistical Foundation of Revenue Projections
At the heart of modern revenue forecasting is the principle of causality, established through controlled, randomized A/B testing. This methodology, often referred to as the "gold standard" in both medical research and behavioral economics, allows practitioners to isolate the impact of a single variable by comparing a variant against a control group. By ensuring that users are randomly assigned to different versions of a webpage, analysts can attribute differences in behavior—such as purchase frequency or average order value—directly to the changes made.

However, the validity of these forecasts depends entirely on the robustness of the underlying statistical framework. Journalistic analysis of industry trends suggests that many organizations fail to adequately "power" their experiments. Statistical power is the probability that a test will detect an effect when one truly exists. Without sufficient sample sizes and a clear understanding of the Minimum Detectable Effect (MDE), revenue projections become little more than educated guesses. To achieve a high level of confidence suitable for executive reporting, experiments must reach a statistical significance threshold—typically 95%—while accounting for the specific parameters of the business’s traffic and conversion volume.
Navigating the Complexity of External Market Factors
One of the primary reasons revenue forecasting is viewed with skepticism is the influence of external factors that lie outside the control of a CRO team. A 10% lift observed during a two-week window in November may not persist in February. Digital performance is consistently impacted by fluctuating advertising budgets, shifts in search engine algorithms, and the aggressive maneuvers of competitors. For instance, if a competitor launches a major discount campaign simultaneously with a website’s new checkout flow, the "lift" from the experiment might be masked by a general decline in market share.

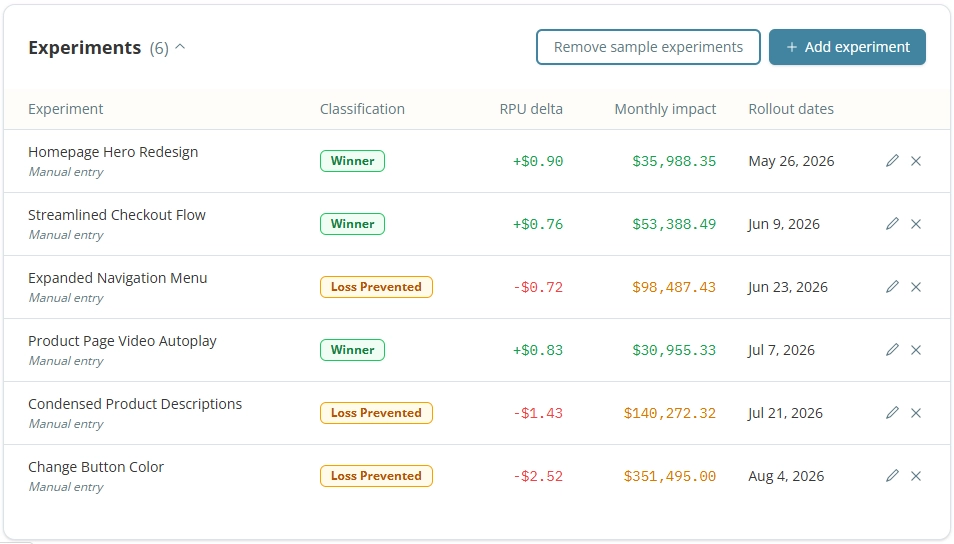
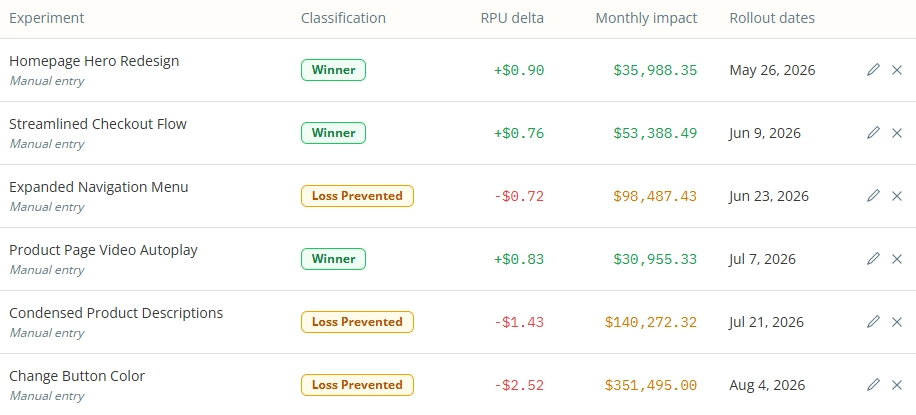
Furthermore, economic conditions and seasonal trends play a significant role. A/B testing is superior to simple pre-and-post-implementation comparisons specifically because it accounts for these "noise" variables in real-time. If overall website performance drops by 10% due to a holiday ending, but the test variant performs 10% better than the control, the net result may appear flat to an untrained observer. However, the experiment has successfully "saved" revenue that would otherwise have been lost. This concept of "loss prevention" is a critical, yet often overlooked, component of a comprehensive revenue model.
The Implementation of Conservative Forecasting Models
To bridge the gap between experimental data and financial reality, industry experts advocate for the "Conservative Forecast" approach. This model rejects the simplistic multiplication of a percentage lift by annual revenue—a practice that often leads to inflated expectations and damaged credibility with Chief Financial Officers (CFOs). Instead, a realistic model incorporates several layers of "haircuts" or discounts to account for the natural degradation of experimental effects.
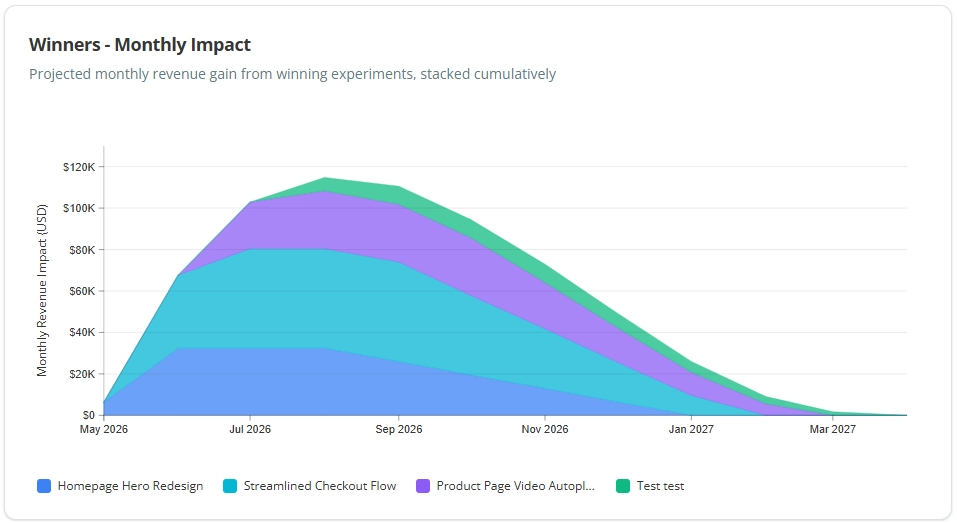
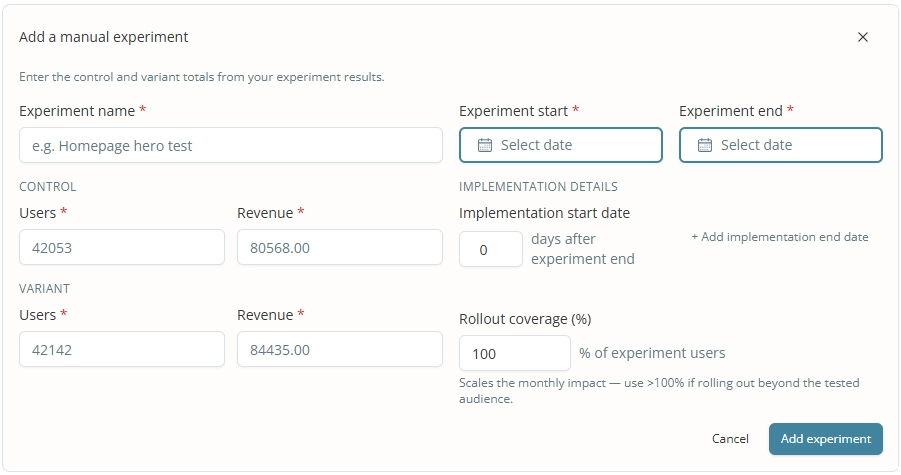
The conservative model typically begins with a 10% "haircut" on the initial results to account for the "Winner’s Curse"—a phenomenon where the initial observed effect of a winning variant is often an outlier that regresses toward the mean over time. Additionally, the model must consider the "Rollout Coverage." If a change was tested only on mobile users but is implemented site-wide, or if it was tested on a high-traffic landing page but implemented on a low-traffic sub-page, the revenue projection must be adjusted proportionally to the actual traffic that will encounter the change.
Perhaps the most vital element of a professional forecast is the inclusion of a "Decay Rate." No website optimization provides a permanent, unchanging lift. User behaviors evolve, design trends shift, and the novelty of a new feature eventually wears off. A standard conservative model might hold the full impact steady for four months before applying a 20% monthly reduction in the projected gain. This ensures that the forecast remains grounded in the reality of a shifting digital marketplace.
A Chronological Approach to Revenue Calculation
The process of generating a reliable revenue impact report follows a specific sequence of data collection and analysis. This chronology ensures that every figure presented to stakeholders is backed by verifiable experimental data.
- Experiment Conclusion and Validation: The process begins the moment an A/B test reaches statistical significance. Analysts must first confirm that the data is "clean" and that no technical glitches influenced the results.
- Revenue Per User (RPU) Comparison: The core metric for forecasting is the difference in Revenue Per User between the control and the variant. By subtracting the control RPU from the variant RPU, the organization identifies the "incremental value" provided by the change.
- Application of Implementation Delays: There is often a gap between the end of a test and the technical deployment of the winning change. The forecast must reflect this timeline, as no revenue gain can be realized while the change sits in a development queue.
- Cumulative Stacking: As multiple experiments are conducted throughout the year, their impacts must be stacked. This requires a sophisticated model that tracks the start and end dates of various "lifts" and applies individual decay rates to each, creating a cumulative view of the program’s total contribution to the bottom line.
- Continuous Adjustment: A model is not a static document. It must be updated monthly to reflect actual traffic patterns and to incorporate new findings from the latest round of experimentation.
Executive Communication and the Role of Specialized Analytics
For the CRO practitioner, the ultimate goal of revenue forecasting is to provide clarity to the executive suite. While data scientists may be interested in p-values and Bayesian versus Frequentist methodologies, executives require a clear, dollar-denominated view of the return on investment (ROI). Using tools designed for experimentation analytics, such as Katsed or similar platforms, allows teams to automate these complex calculations and present them through intuitive visualizations.
A professional revenue summary for stakeholders should include the total projected gain over a specific period (e.g., the next 12 months), a breakdown of "Winners" versus "Loss Prevented" experiments, and a transparent list of the assumptions used in the model. By making the "haircut" percentages and decay rates explicit, the CRO team builds trust with the leadership. This transparency transforms the conversation from a debate over the validity of a single test to a strategic discussion about resource allocation and program scaling.
The Broader Implications for Business ROI
The financial impact of a CRO program extends beyond mere revenue gains; it is fundamentally an exercise in capital efficiency. To calculate the true ROI, organizations must weigh the projected revenue gains against the total cost of the program. This investment includes the salaries of the experimentation team, the licensing fees for A/B testing and analytics tools, and the engineering hours required to build and implement changes.

When viewed through this lens, revenue forecasting becomes a tool for risk management. It allows a business to see which types of experiments—such as pricing tests, checkout optimizations, or top-of-funnel messaging changes—yield the highest long-term financial returns. This data-driven approach prevents the "HiPPO" (Highest Paid Person’s Opinion) from dominating the roadmap, ensuring that the company’s limited development resources are always focused on the most impactful initiatives.
Conclusion: The Future of Data-Driven Decision Making
While forecasting the effect of experiments on future revenue will likely remain a topic of healthy debate, the move toward more conservative, model-based projections represents a significant maturation of the CRO industry. By accepting that a forecast is a "model" rather than a "certainty," and by applying rigorous statistical discounts, practitioners can provide the executive level with the actionable insights they need to navigate an increasingly competitive digital economy.
The integration of automated tools and standardized decay models allows for a level of reporting that was previously impossible for most organizations. As businesses continue to shift their budgets toward data-backed strategies, those who can accurately and conservatively forecast their impact will be the ones who secure the necessary buy-in to scale their testing programs. In the end, revenue forecasting is less about having a crystal ball and more about providing a disciplined, factual framework for understanding the value of every click, every conversion, and every experimental win.