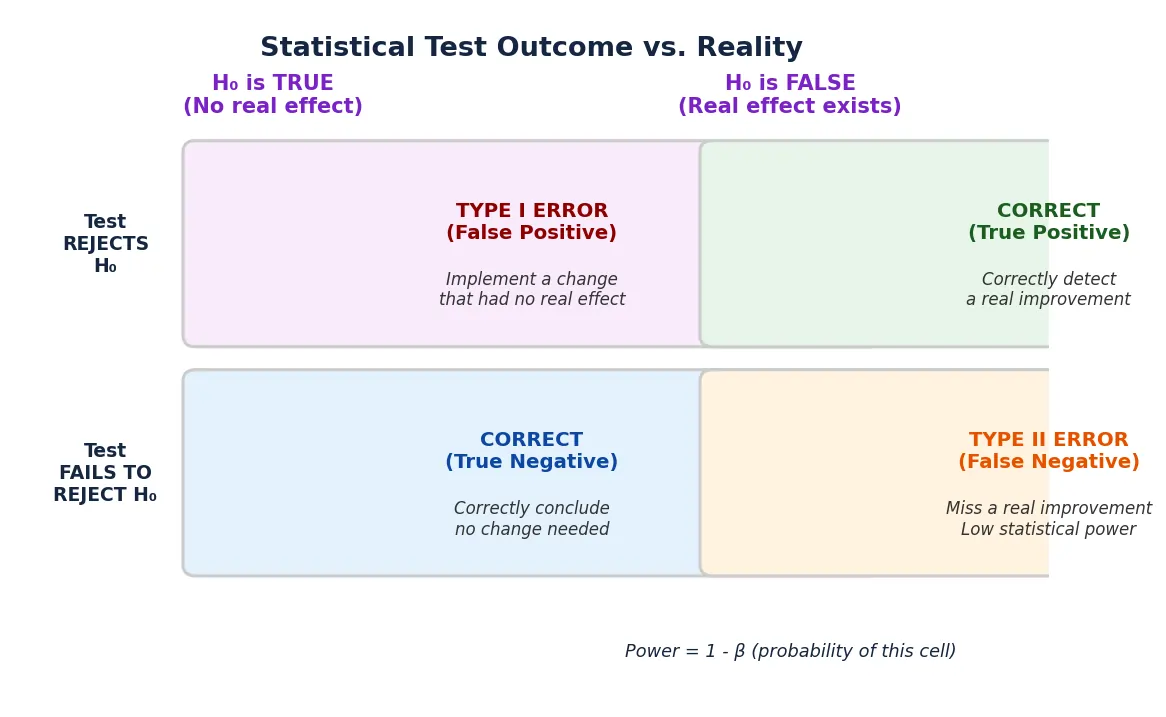
Statistical power serves as the foundational metric for determining whether a digital experiment can reliably detect an improvement in performance, yet it remains one of the most misunderstood concepts in the field of conversion rate optimization (CRO). While many marketing teams focus exclusively on statistical significance to avoid false positives, the neglect of statistical power often leads to "Type II" errors, where a winning variation is discarded simply because the test was not sensitive enough to capture its impact. In the high-stakes environment of e-commerce and Software-as-a-Service (SaaS), where a three percent lift can translate into millions of dollars in annual recurring revenue, the inability to distinguish between a "flat" result and an underpowered "win" represents a significant drain on corporate resources.

The Foundational Principles of Statistical Power
To understand statistical power, one must first distinguish it from its more famous counterpart, statistical significance. In formal terms, statistical power is the probability that a test will correctly reject the null hypothesis when a true effect of a specific size exists. It is represented mathematically as $1 – beta$, where $beta$ is the probability of a false negative. If an experiment is designed with 80% power, it implies that if the variation truly delivers the expected lift, the test will successfully identify that win in eight out of ten instances.
The evolution of these concepts dates back to the early 20th century, emerging from the competing statistical frameworks of Ronald A. Fisher, who championed the p-value and significance, and Jerzy Neyman and Egon Pearson, who introduced the concept of power and alternative hypotheses. Modern digital experimentation has synthesized these views into a standardized framework where significance protects against "false alarms" (Type I errors) and power protects against "missed opportunities" (Type II errors).

The Four Pillars of Experiment Sensitivity
The sensitivity of any A/B test is governed by a delicate equilibrium between four primary factors. Adjusting any one of these variables inevitably necessitates a change in the others to maintain the statistical integrity of the experiment.
1. Sample Size (N)
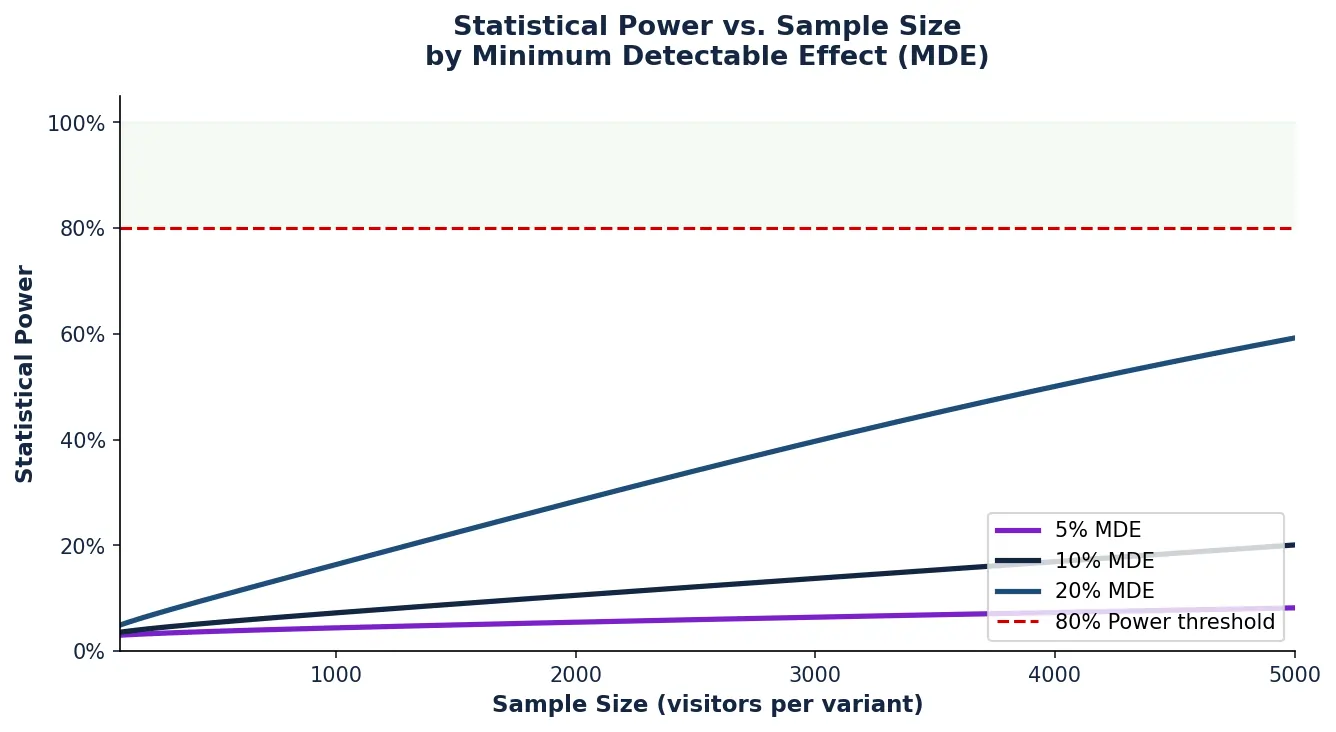
The most direct lever for increasing power is the volume of data collected. A larger sample size provides a more granular view of user behavior, allowing the mathematical model to filter out the "noise" of random daily fluctuations. In a scenario with only 100 participants, a single bulk purchase can skew results, creating an illusion of success or failure. Conversely, with a sample of 50,000 visitors, those individual anomalies are smoothed out, providing a clearer picture of the true conversion rate.
2. Minimum Detectable Effect (MDE)
The MDE is a pre-set threshold representing the smallest relative or absolute lift the experimenter wishes to detect. There is an inverse relationship between the MDE and the required sample size: detecting a massive 20% improvement requires relatively little data, whereas detecting a subtle but profitable 2% lift requires a massive influx of traffic. Setting an unrealistic MDE is a common pitfall that leads to experiments being called "inconclusive" when they were actually just underpowered.
3. Significance Level (Alpha)
The significance level, typically set at 5% ($alpha = 0.05$), dictates the burden of proof required to declare a winner. However, there is a trade-off: the more stringently a team guards against false positives by lowering alpha (e.g., to 1%), the more power is sacrificed. This increased caution makes the test "blind" to genuine but less obvious improvements.
4. Data Variability (Variance)
Variance refers to the natural dispersion within the data. In conversion testing, variance is often tied to the baseline conversion rate. In revenue testing, however, variance is driven by fluctuating order values. A store selling products at a fixed price of $10$ has low variance, making it easier to reach statistical power. A luxury jeweler with orders ranging from $50$ to $5,000$ has high variance, requiring significantly more data to achieve the same level of confidence in the results.
The Economic Consequences of Underpowered Testing
The financial implications of running underpowered tests extend far beyond the laboratory. Industry analysis suggests that a significant portion of "failed" experiments in the corporate world are actually successes that lacked the power to be recognized. For instance, a SaaS company generating $12$ million in annual revenue might run a checkout optimization test. If the team sizes the test to catch a 10% lift but the variation actually produces a 2% lift, the test will likely return a non-significant result.
While the team moves on to the next idea, they have effectively left $240,000$ of annual revenue on the table. Because these gains are cumulative, the long-term impact on the company’s valuation and growth trajectory is even more pronounced. Furthermore, low power undermines the credibility of the "wins" that are actually found. When power is low, the few results that do reach significance are often "statistical flukes" or cases of the "Winner’s Curse," where the effect size is wildly exaggerated by random chance. This phenomenon, often referred to in data science as Twyman’s Law, warns that any figure that looks particularly interesting or unusual is likely the result of an error or noise.
Chronology of a Professional Power Analysis
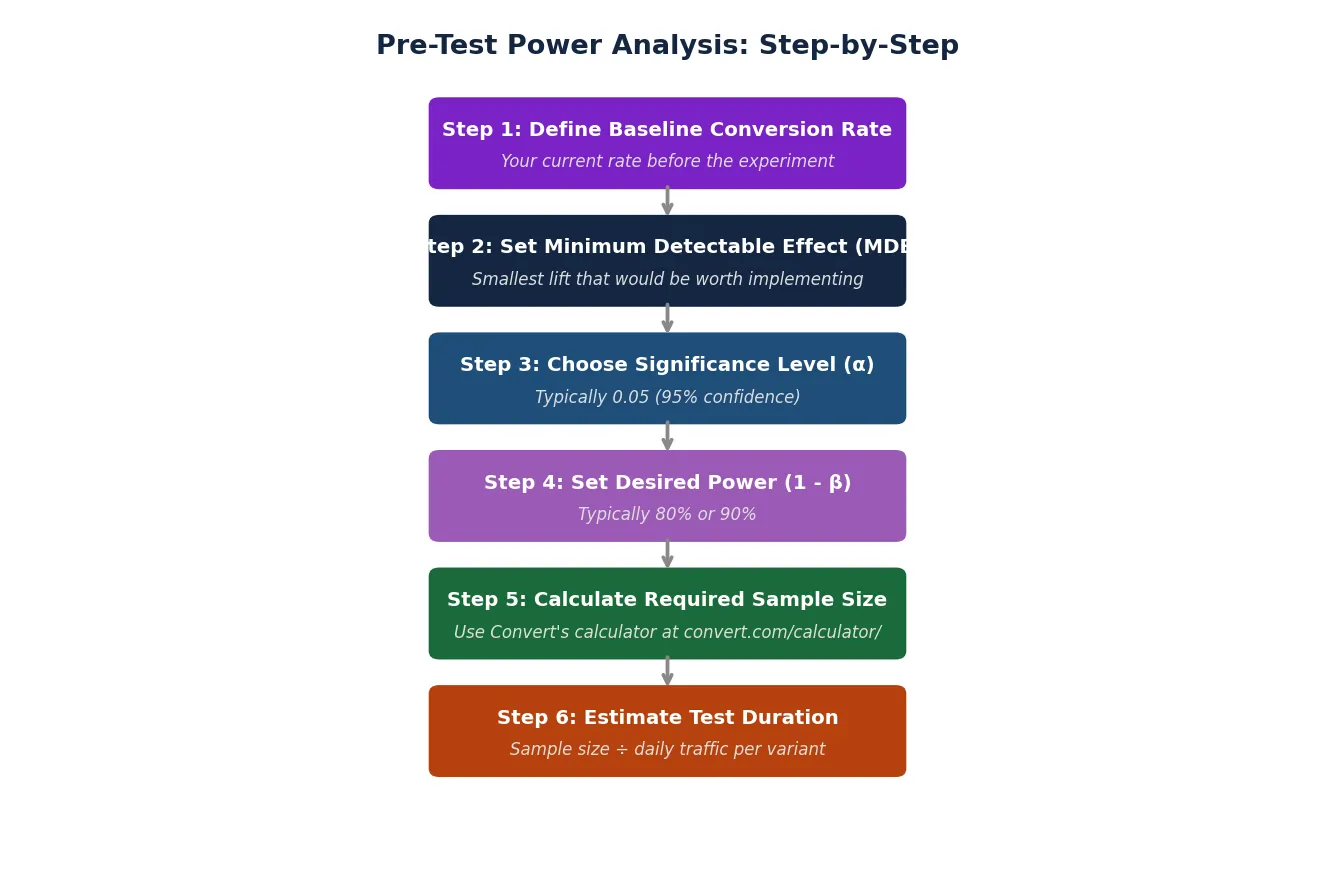
To mitigate these risks, lead data scientists at optimization platforms like Convert and Microsoft’s ExPT team recommend a rigorous six-step pre-test power analysis. This chronological approach ensures that resources are not wasted on "blind" experiments.
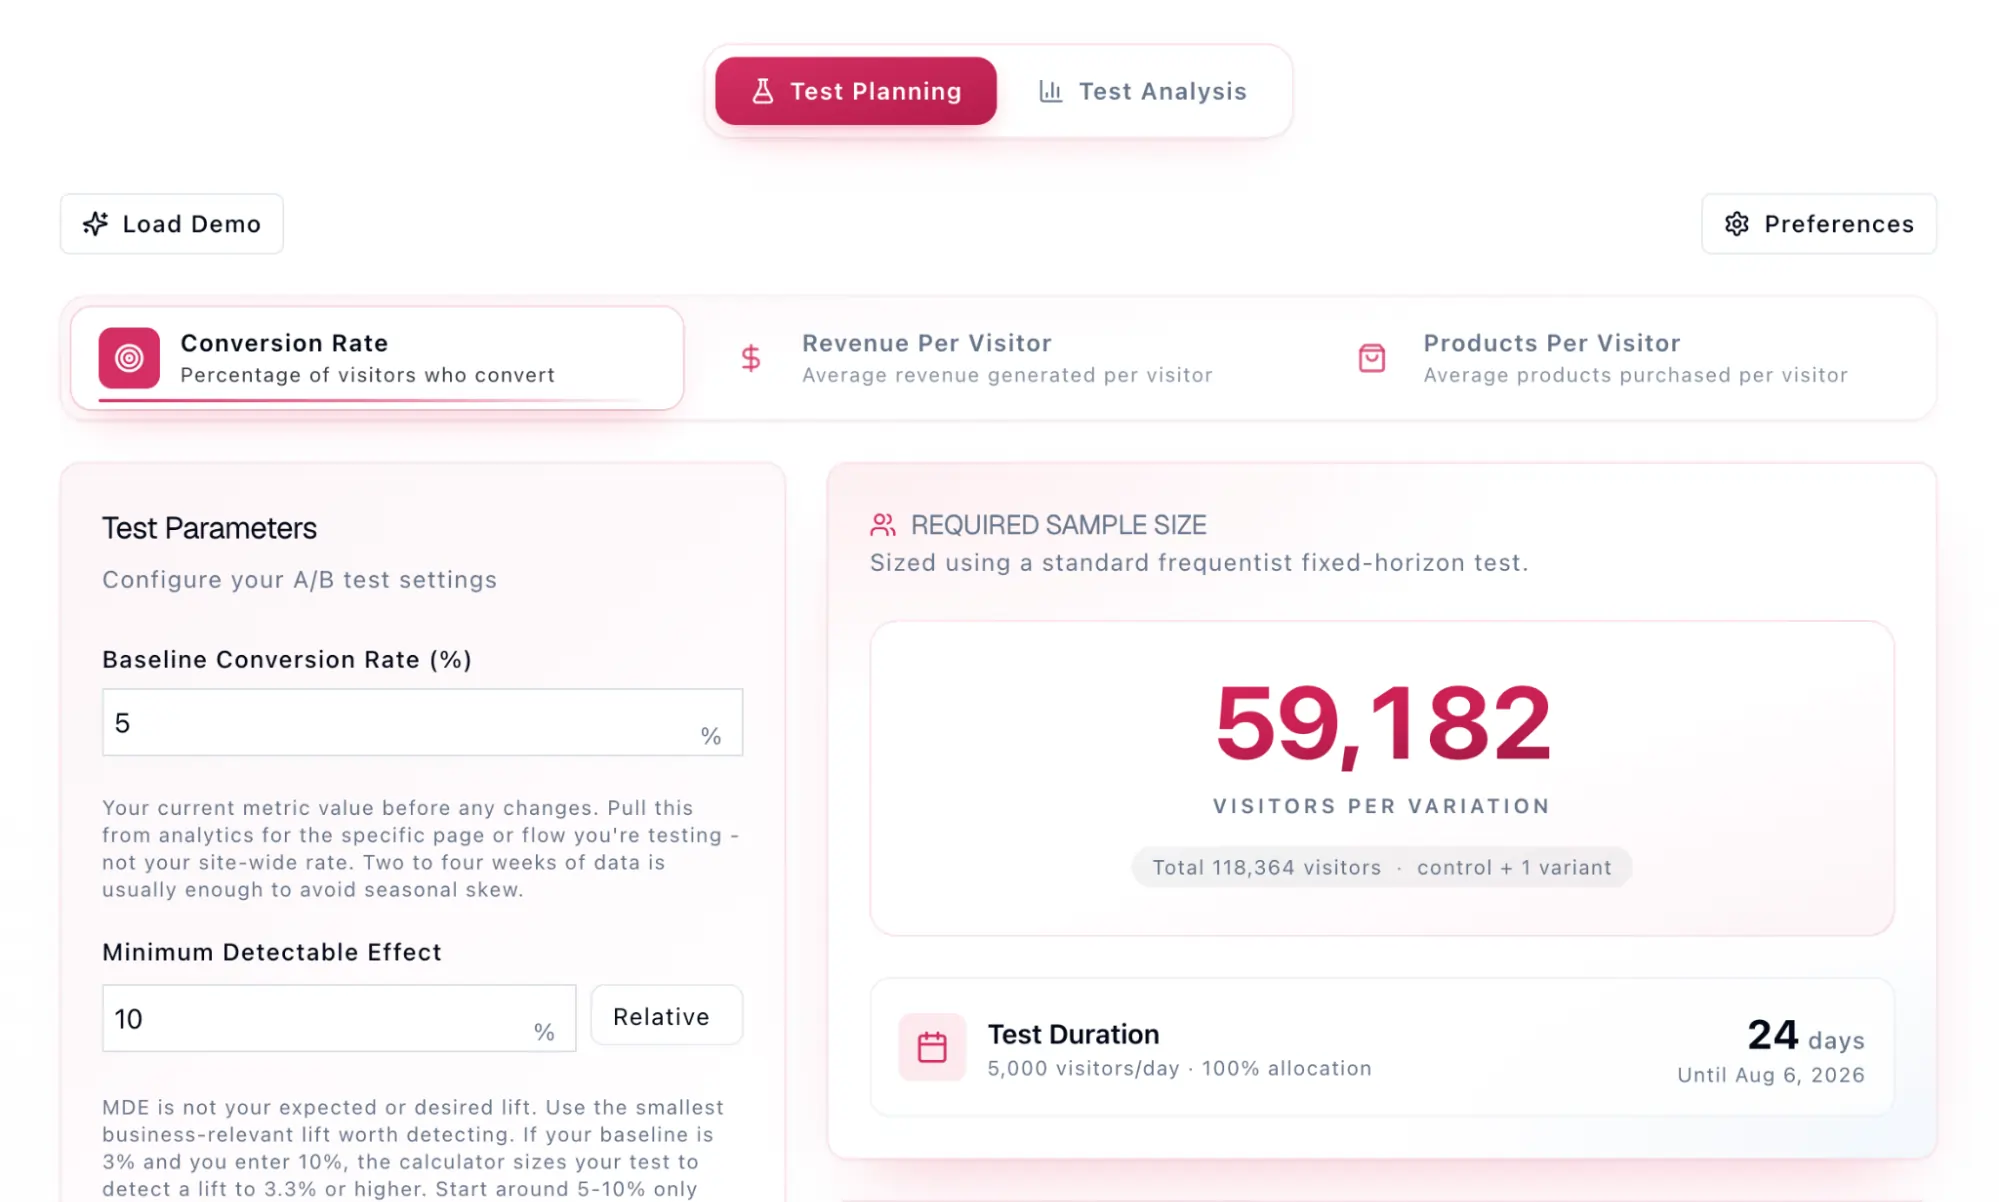
- Establishing the Baseline: The process begins with auditing historical data to find the current conversion rate (CVR) of the control page. This must be done using a recent window (30-90 days) to account for seasonality.
- Defining the MDE: The team must decide on a lift that justifies the cost of implementation. A 1% lift might be huge for Amazon but negligible for a small startup.
- Selecting Alpha: The standard 95% confidence level is applied unless the cost of a false positive is exceptionally high (such as in medical or high-risk financial changes).
- Setting the Power Target: While 80% is the industry standard, critical tests involving major brand overhauls may require 90% power to ensure no negative impact is missed.
- Calculating Sample Size: Using a power calculator, the team inputs the previous variables to determine the required visitors per variation.
- Estimating Duration: Finally, the required sample is divided by daily traffic. If a test requires 100 days to reach power but the company’s sprint cycle is 14 days, the test must be redesigned.
Methodological Variations: Frequentist, Sequential, and Bayesian
The approach to statistical power varies significantly depending on the underlying mathematical framework utilized by the testing platform.
- Frequentist Methods: This is the traditional approach where the sample size is fixed in advance. Experimenters must resist "peeking" at the data, as stopping a test early when it looks like a win—before the power target is met—artificially inflates the false positive rate.
- Sequential Testing: Developed to allow for continuous monitoring, sequential testing uses "stopping boundaries." This allows teams to end a test early if a variation is an absolute "home run" or a disastrous failure, without compromising the statistical validity of the results. This method is increasingly favored by high-velocity growth teams.
- Bayesian Frameworks: Bayesian statistics eschew the concept of "power" in the traditional sense, focusing instead on the "probability of beating the control." While this is often more intuitive for business stakeholders, it does not eliminate the need for sensitivity; a Bayesian test with too little data will simply report a high level of uncertainty.
Strategies for Constraints in High-Variance Metrics
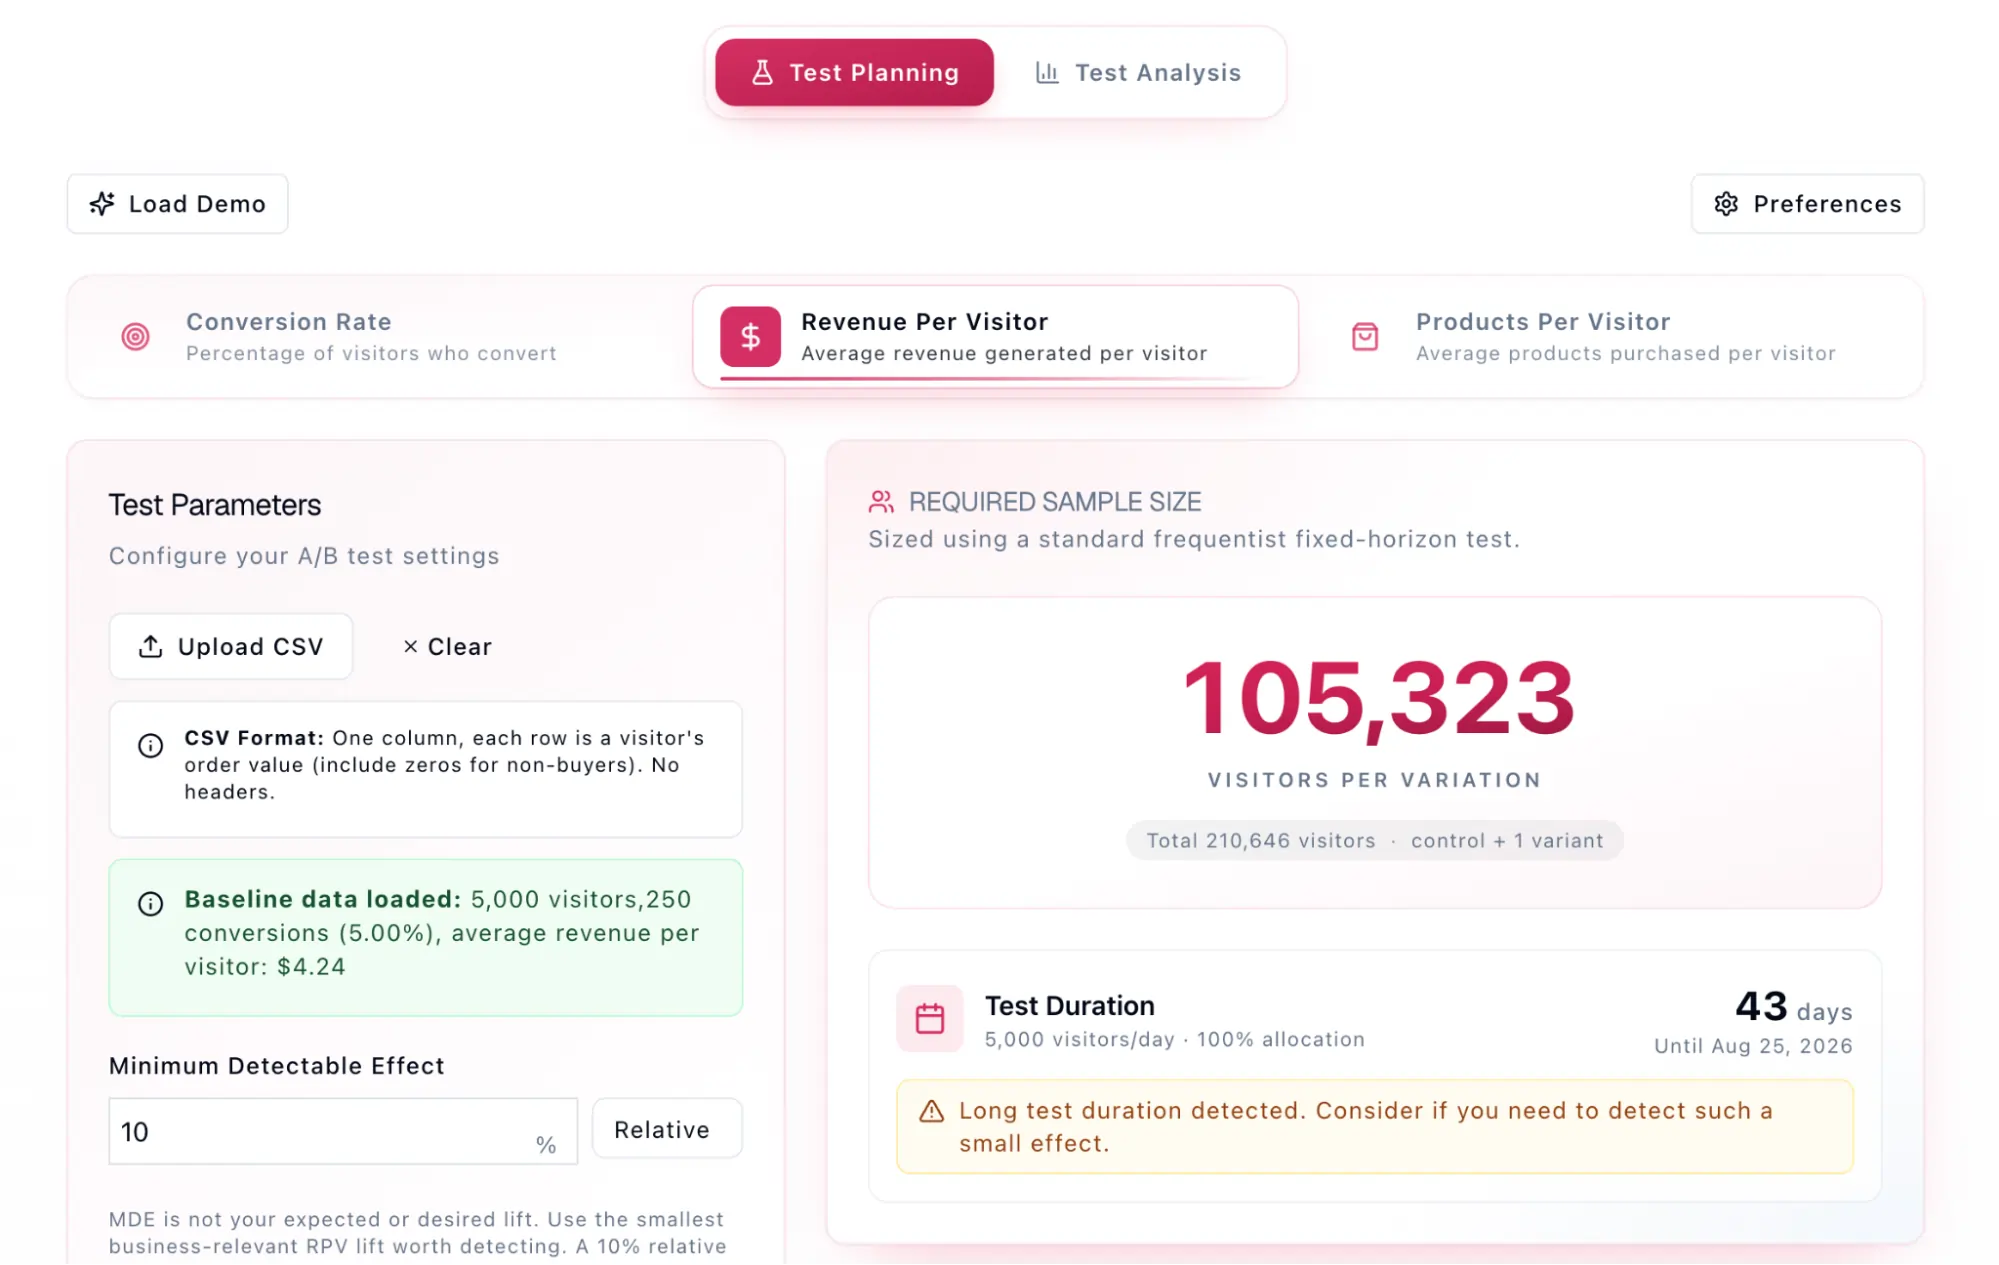
A recurring challenge in modern experimentation is the shift from testing binary conversions (yes/no) to continuous metrics like Revenue Per Visitor (RPV). Data analysis shows that RPV tests often require nearly double the sample size of conversion tests to reach the same power. This is because RPV is influenced by both the conversion rate and the Average Order Value (AOV), the latter of which can be extremely volatile.
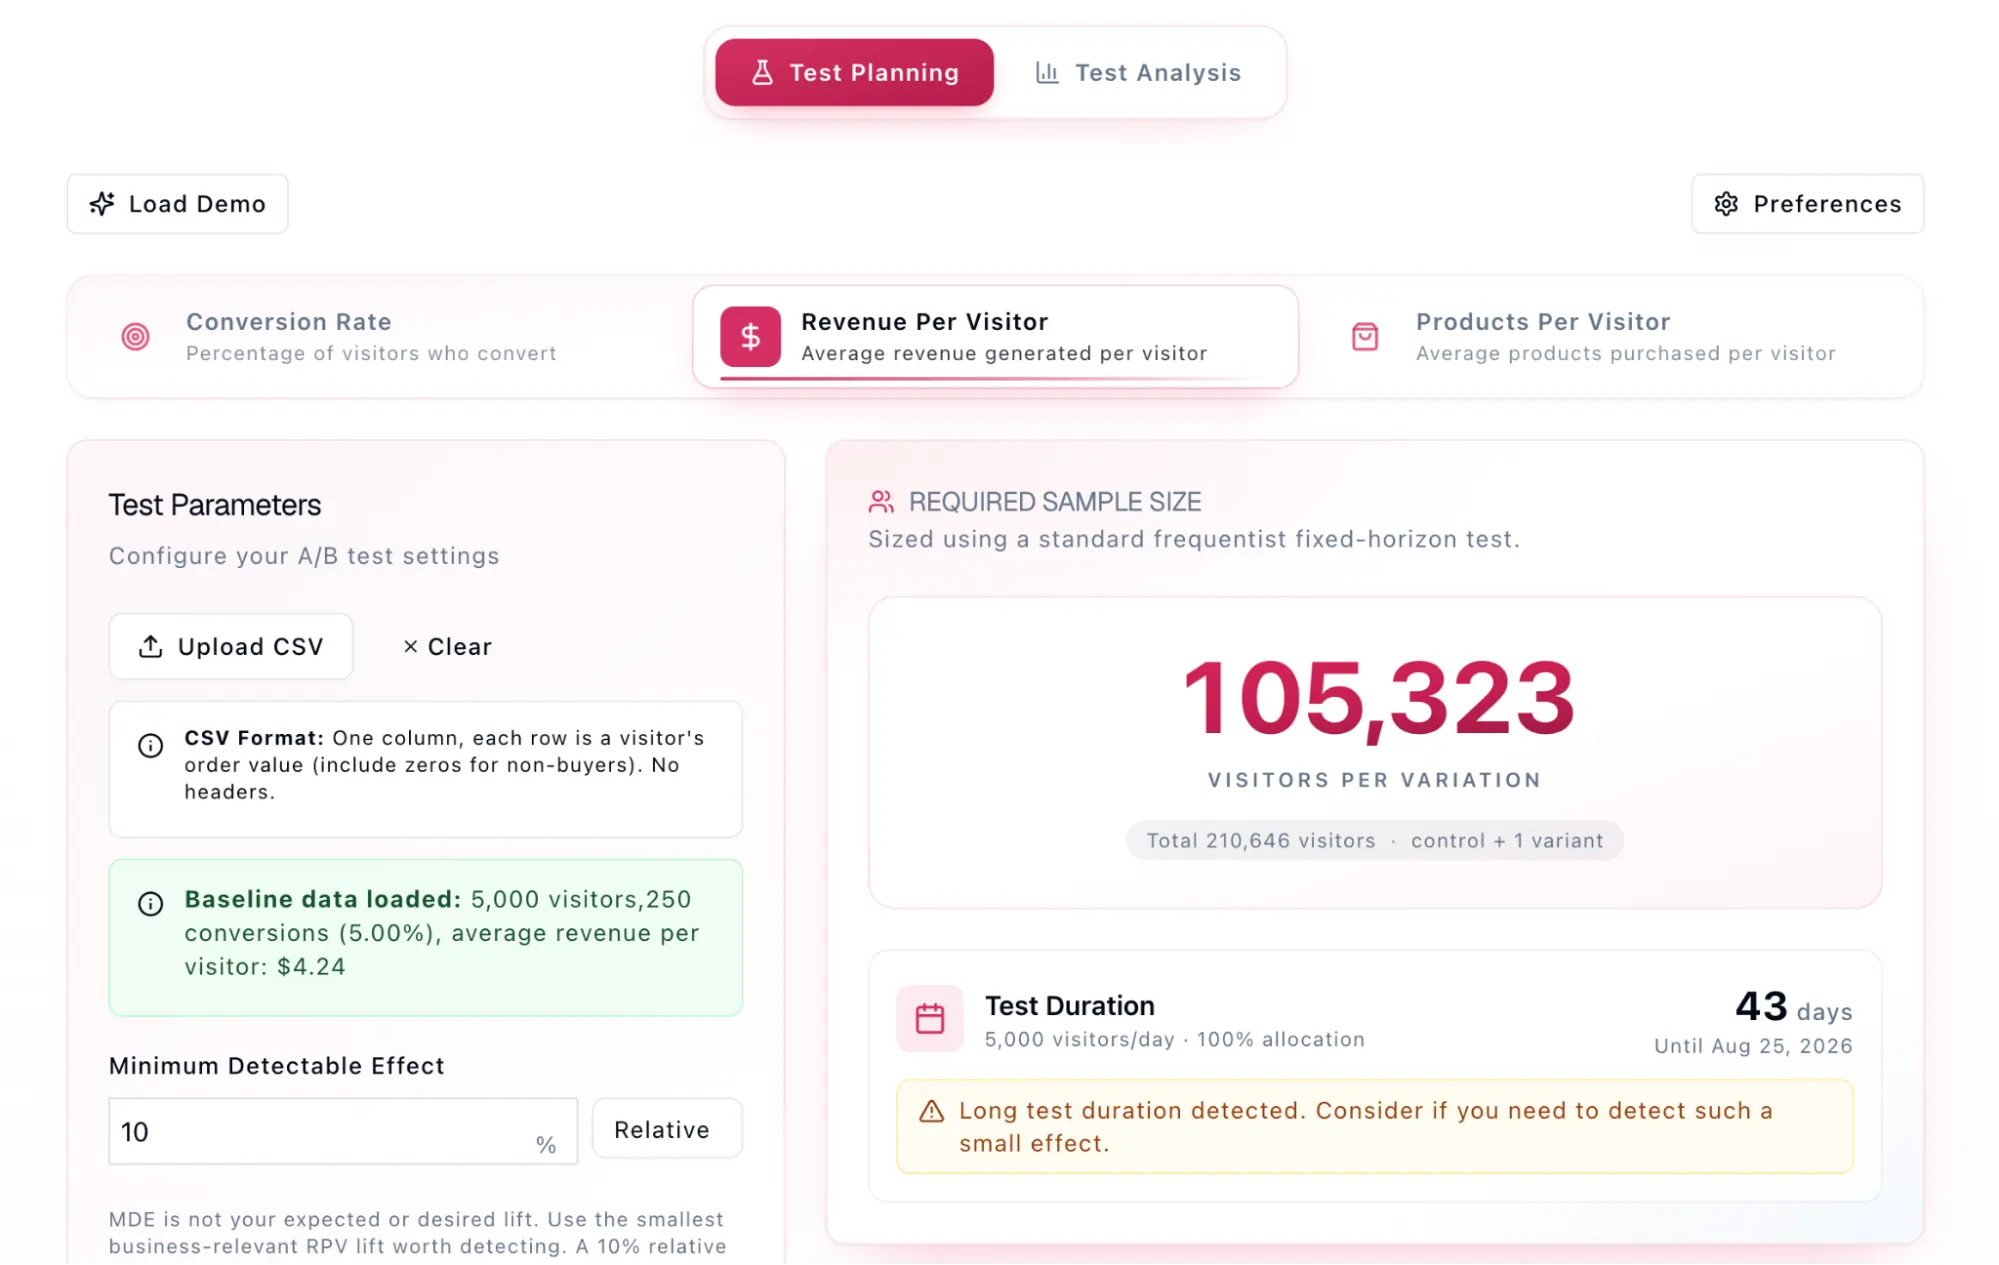
When teams face traffic constraints that make adequate power unreachable, they must employ strategic compromises. One common reaction is to "Increase the MDE," essentially deciding only to look for "big wins." While this shortens the test duration, it risks ignoring the incremental 2% to 5% gains that build long-term market dominance. Alternatively, teams may "Accept Lower Power," acknowledging that they have a 60% chance rather than an 80% chance of catching a winner. In these instances, journalistic-style reporting within the organization is vital to ensure stakeholders understand the provisional nature of the findings.
Broad Impact and Future Implications
The shift toward power-conscious experimentation marks a maturing of the digital economy. As the "low-hanging fruit" of website optimization is picked, the ability to detect subtle, incremental improvements becomes the primary competitive advantage. Companies that master statistical power can build a culture of "marginal gains," where hundreds of small, verified improvements compound into market leadership.

In conclusion, statistical power is not merely a technical checkbox but a vital component of risk management. By ensuring that experiments are sufficiently sensitive to detect the effects they seek, organizations can protect themselves against the twin threats of false negatives and exaggerated wins. As machine learning and automated experimentation continue to evolve, the fundamental principles of power and sensitivity will remain the bedrock of trustworthy, data-driven decision-making. Organizations are encouraged to utilize professional-grade calculators and frameworks to ensure that every test run is a test that can actually be won.