In the ever-evolving landscape of digital marketing, visual advertising remains a cornerstone for businesses seeking to capture audience attention and drive engagement. A recent report released by LocaliQ, a leading digital marketing solutions provider, offers an in-depth look at the performance of display and video advertising campaigns, providing crucial benchmarks for businesses to measure their success and identify areas for optimization. The comprehensive analysis, drawing from over 60,000 campaigns, highlights key performance indicators (KPIs) across various industries and ad formats, offering a vital resource for marketers navigating this complex yet lucrative channel.
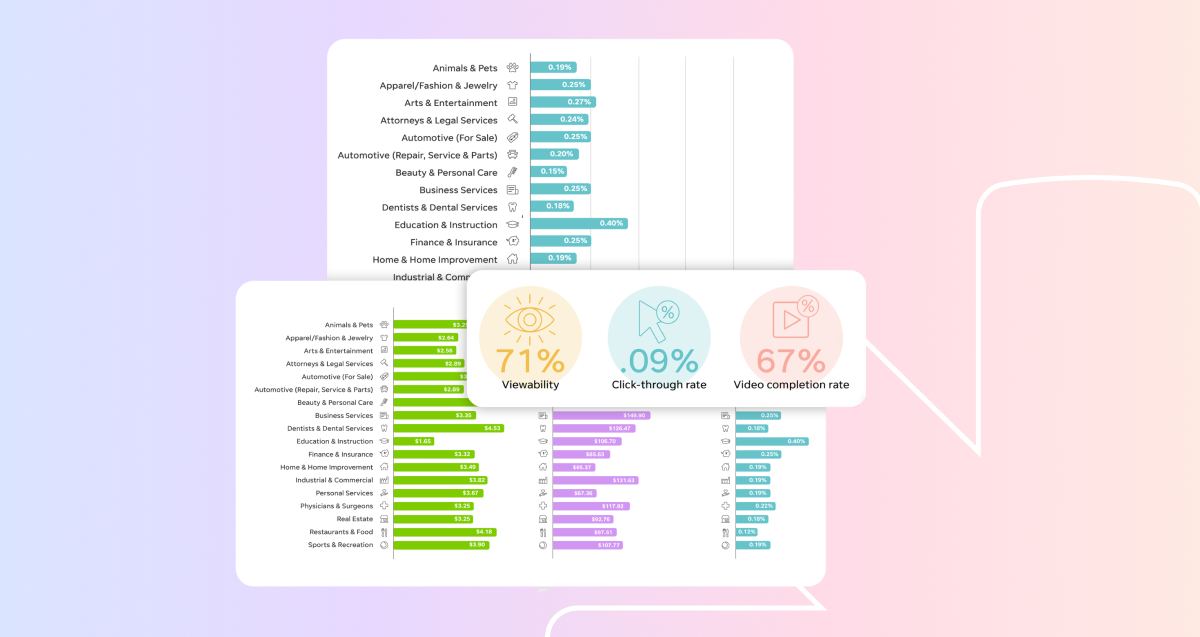
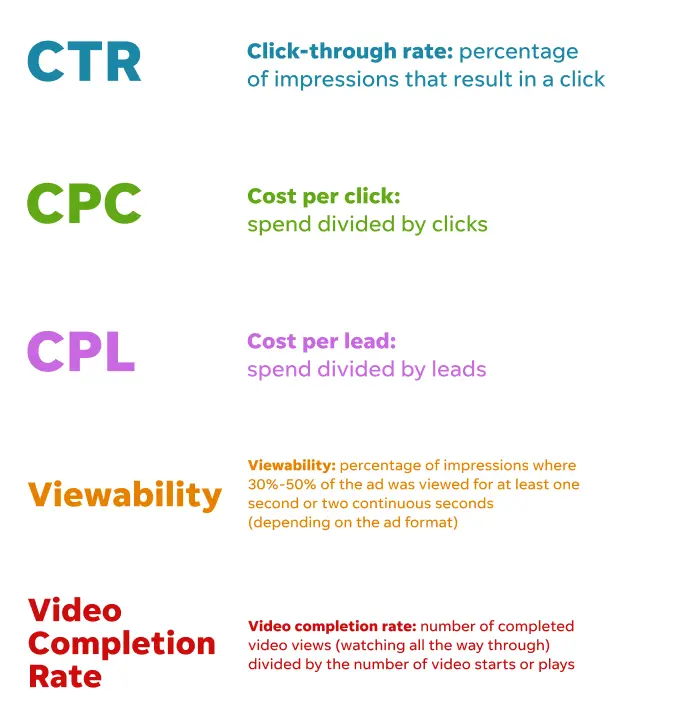
The report, titled "LocaliQ’s First-Ever Display & Video Advertising Benchmarks," aims to equip small and medium-sized businesses (SMBs) with actionable data to refine their advertising strategies. While 74% of SMBs report satisfaction with their display advertising results, the inherent complexities of these passively displayed ads necessitate a deeper understanding of performance metrics. Display ads, by their nature, generate a high volume of impressions as users browse online, making it challenging to isolate their direct impact on conversions. This new benchmark report addresses this challenge by providing industry averages for critical metrics such as click-through rate (CTR), cost per click (CPC), cost per lead (CPL), and viewability.
The data within the report is bifurcated into two primary categories: industry benchmarks for display ads running across major platforms like Google, Microsoft, and YouTube, and overall performance averages for display ads specifically within the USA TODAY Network. This dual approach allows businesses to compare their performance against a broad digital advertising spectrum as well as within a premium, high-impact publisher environment.
Understanding the nuances of display advertising performance is crucial. Experts emphasize that display ads often function as a top-of-funnel or mid-funnel strategy, building brand awareness and consideration rather than driving immediate direct conversions. Navah Hopkins, Ad Product Liaison at Microsoft, notes, "My biggest advice when evaluating visual ad formats is to honor that they might not be delivering conversions themselves. Even when they do, they should not be held to the same benchmarks as search formats." This perspective underscores the importance of viewing display ads not in isolation, but as part of a broader marketing ecosystem. The report acknowledges this by focusing on metrics that reflect engagement and potential influence, such as viewability and video completion rates, rather than solely direct conversion rates, which can be misleading for this ad type.
Greg Carter, Vice President of Marketing at Clutch, further elaborates on this point, stating, "Most people aren’t going to immediately click a display ad. They’ll come back to your site directly, weeks or months later, when they need you." This delayed attribution highlights the long-term value of display advertising in nurturing customer relationships and reinforcing brand presence.
Industry-Specific Performance Averages
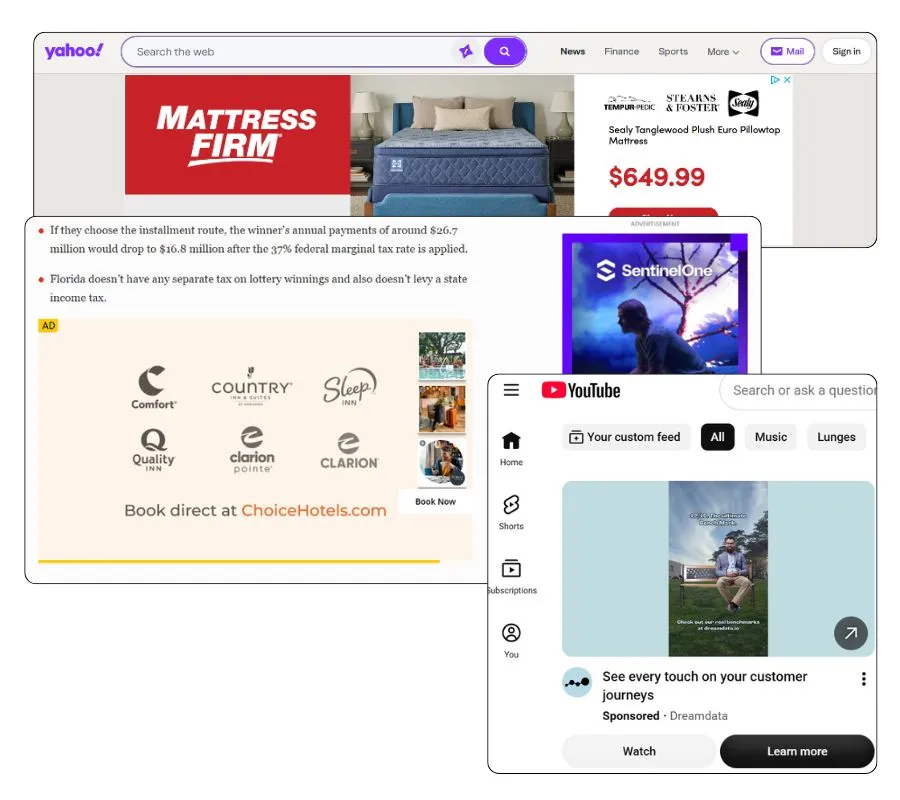
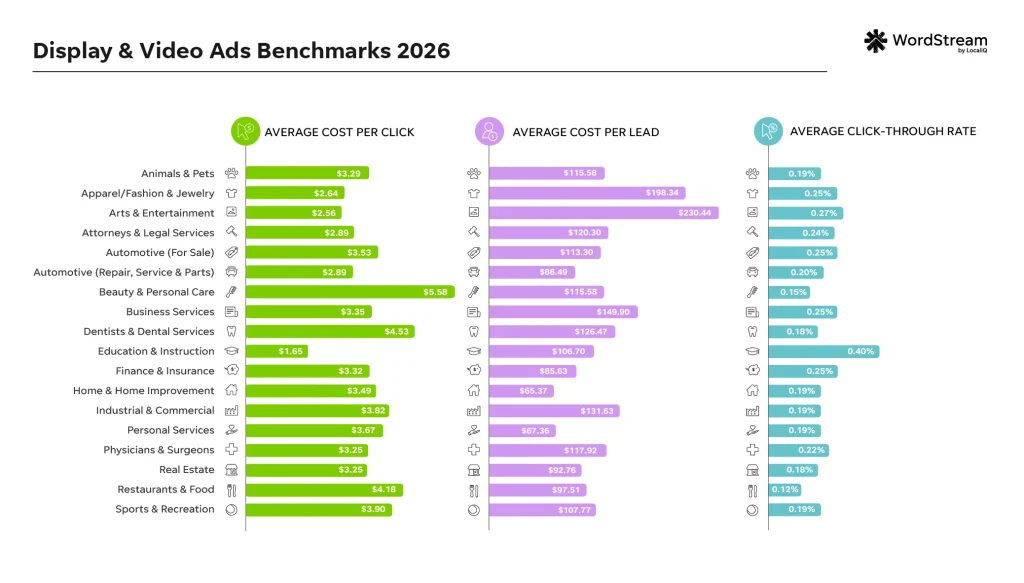
The LocaliQ report provides a granular breakdown of display advertising performance by industry, focusing on key metrics like click-through rate (CTR), cost per click (CPC), and cost per lead (CPL). These figures are derived from standard display campaigns that run across a vast network of over 350 exchanges, networks, and publishers, including prominent platforms like Google, YouTube, Meta, and Yahoo, and encompass various formats from banner ads to video content.
Click-Through Rate (CTR) by Industry:
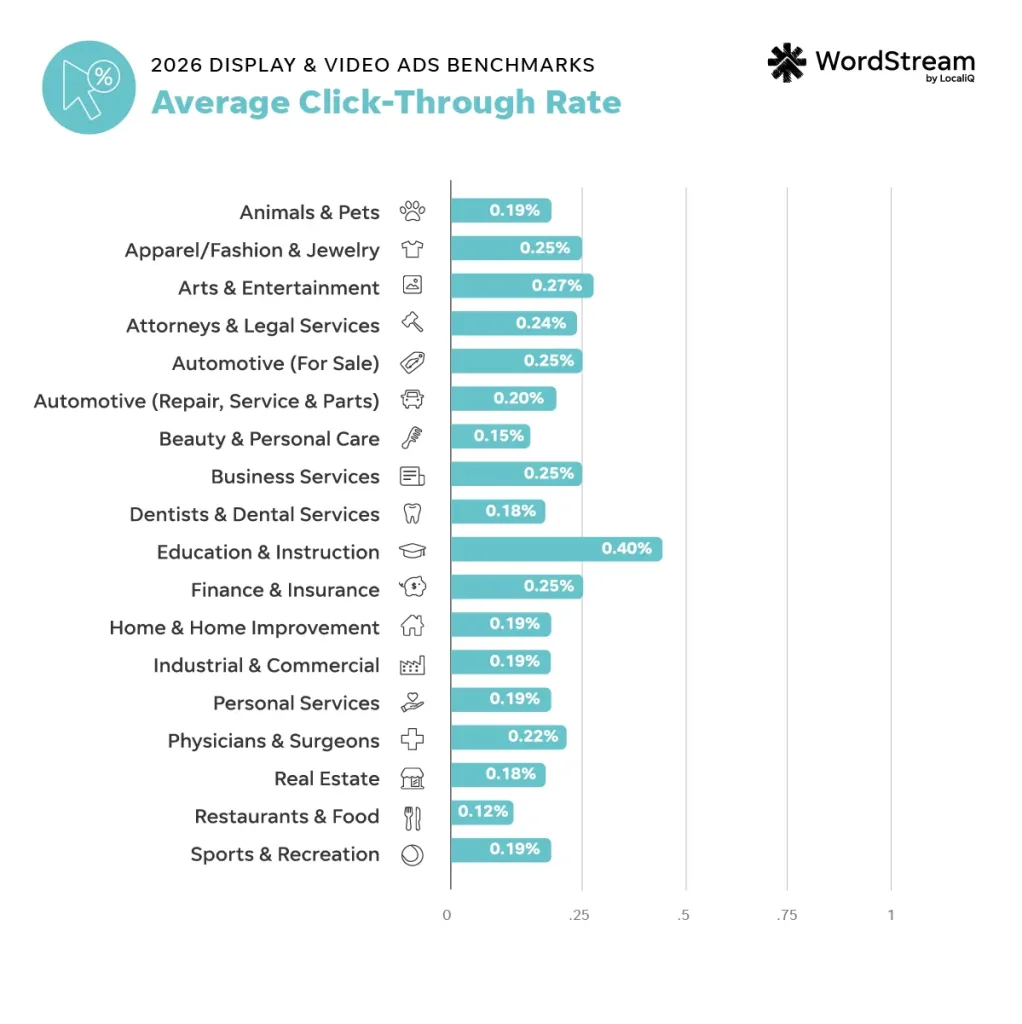
While CTR is not the sole determinant of success for display ads, it serves as an initial indicator of creative appeal and ad relevance. The data reveals significant variation across industries:
| Business Category | Average Click-Through Rate |
|---|---|
| Animals & Pets | 0.19% |
| Apparel / Fashion & Jewelry | 0.25% |
| Arts & Entertainment | 0.27% |
| Attorneys & Legal Services | 0.24% |
| Automotive – For Sale | 0.25% |
| Automotive – Repair, Service & Parts | 0.20% |
| Beauty & Personal Care | 0.15% |
| Business Services | 0.25% |
| Dentists & Dental Services | 0.18% |
| Education & Instruction | 0.40% |
| Finance & Insurance | 0.25% |
| Home & Home Improvement | 0.19% |
| Industrial & Commercial | 0.19% |
| Personal Services | 0.19% |
| Physicians & Surgeons | 0.22% |
| Real Estate | 0.18% |
| Restaurants & Food | 0.12% |
| Sports & Recreation | 0.19% |
The Education and Instruction sector emerged with the highest CTR at 0.40%, suggesting a strong receptiveness to display advertising within this segment. Arts and Entertainment followed closely at 0.27%, which is unsurprising given the visually driven nature of the industry. Conversely, Restaurants & Food recorded the lowest CTR at 0.12%.
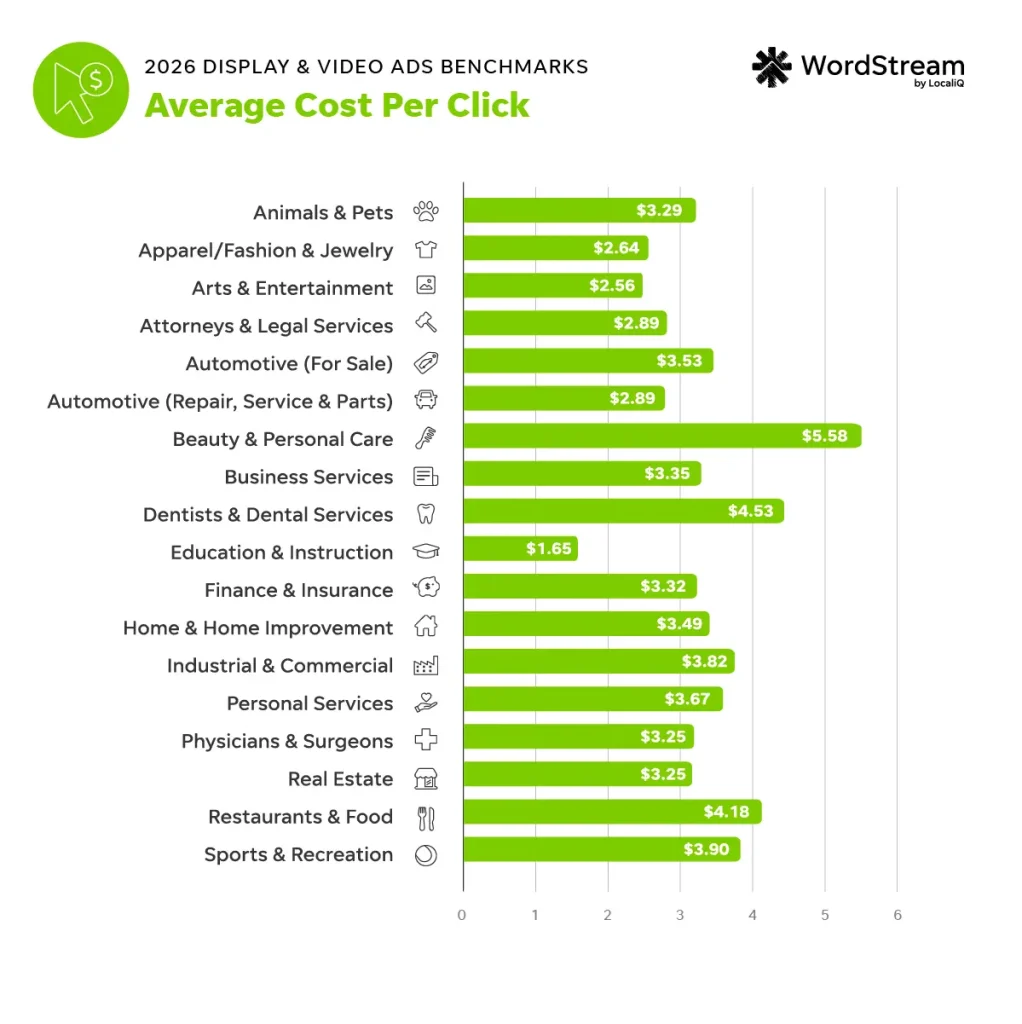
Cost Per Click (CPC) by Industry:
CPC for display ads is generally lower than for search ads, reflecting the nature of passive impression-based advertising. However, costs can escalate in highly competitive sectors.
| Business Category | Average Cost Per Click |
|---|---|
| Animals & Pets | $3.29 |
| Apparel / Fashion & Jewelry | $2.64 |
| Arts & Entertainment | $2.56 |
| Attorneys & Legal Services | $2.89 |
| Automotive – For Sale | $3.53 |
| Automotive – Repair, Service & Parts | $2.89 |
| Beauty & Personal Care | $5.58 |
| Business Services | $3.35 |
| Dentists & Dental Services | $4.53 |
| Education & Instruction | $1.65 |
| Finance & Insurance | $3.32 |
| Home & Home Improvement | $3.49 |
| Industrial & Commercial | $3.82 |
| Personal Services | $3.67 |
| Physicians & Surgeons | $3.25 |
| Real Estate | $3.25 |
| Restaurants & Food | $4.18 |
| Sports & Recreation | $3.90 |
The Beauty and Personal Care industry presented the highest CPC at $5.58, a figure attributed to its intensely competitive market. Education and Instruction, on the other hand, boasted the lowest CPC at $1.65, aligning with its higher CTR.
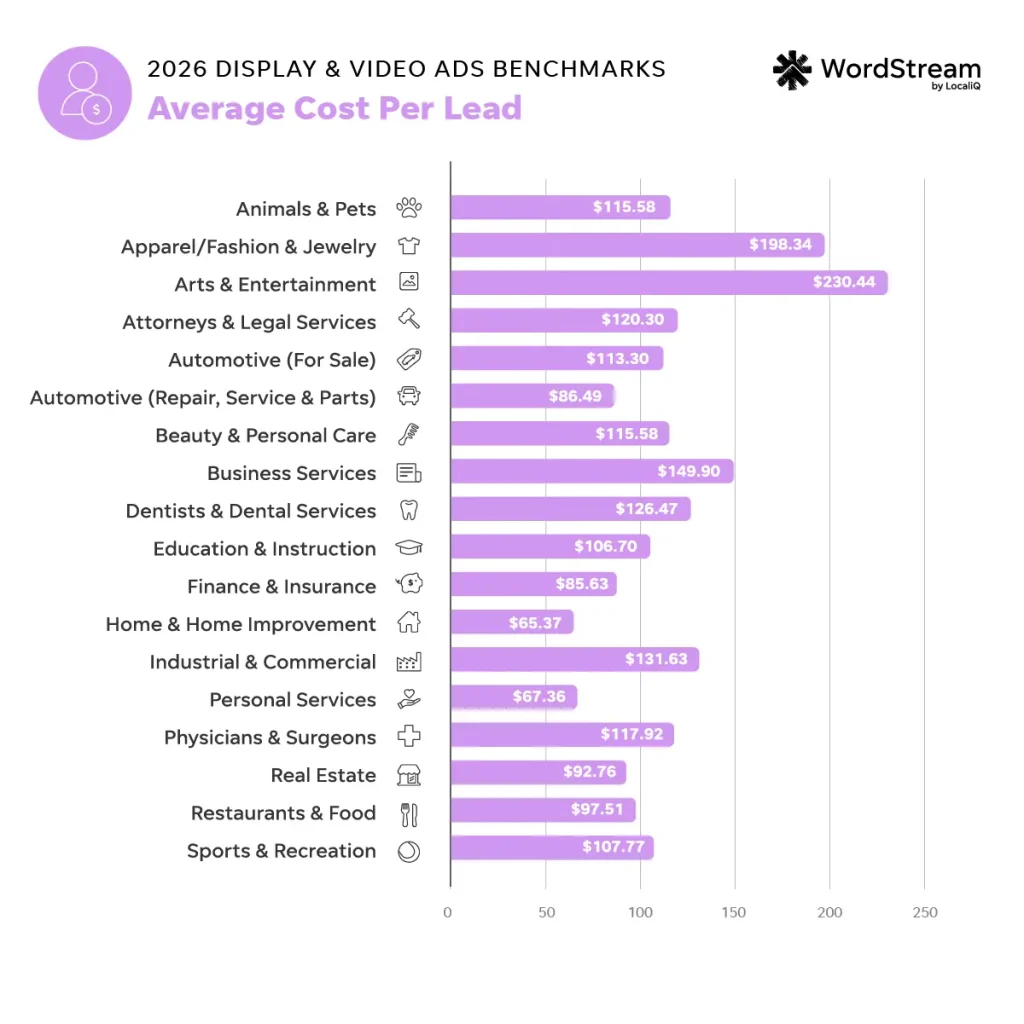
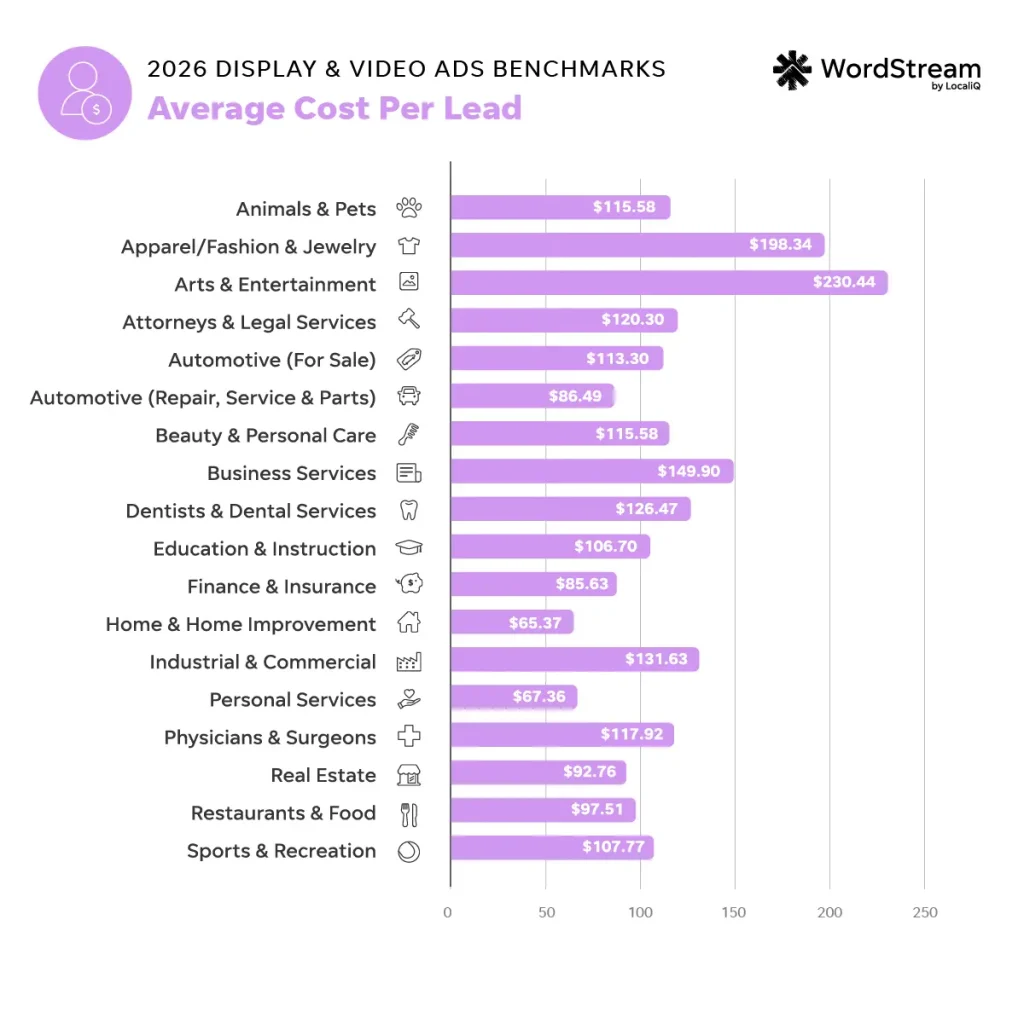
Cost Per Lead (CPL) by Industry:
The cost to acquire a lead through display advertising also shows considerable variance, influenced by industry value and campaign effectiveness.
| Business Category | Average Cost Per Lead |
|---|---|
| Animals & Pets | $115.58 |
| Apparel / Fashion & Jewelry | $198.34 |
| Arts & Entertainment | $230.44 |
| Attorneys & Legal Services | $120.30 |
| Automotive – For Sale | $113.30 |
| Automotive – Repair, Service & Parts | $86.49 |
| Beauty & Personal Care | $115.58 |
| Business Services | $149.90 |
| Dentists & Dental Services | $126.47 |
| Education & Instruction | $106.70 |
| Finance & Insurance | $85.63 |
| Home & Home Improvement | $65.37 |
| Industrial & Commercial | $131.63 |
| Personal Services | $67.36 |
| Physicians & Surgeons | $117.92 |
| Real Estate | $92.76 |
| Restaurants & Food | $97.51 |
| Sports & Recreation | $107.77 |
Industries such as Home & Home Improvement and Personal Services demonstrated notably lower CPLs, at $65.37 and $67.36 respectively. In contrast, Arts & Entertainment recorded the highest CPL at $230.44. These figures suggest that while display ads might generate broad awareness, their direct lead generation efficiency varies significantly by sector.
High-Impact and Video Display Advertising
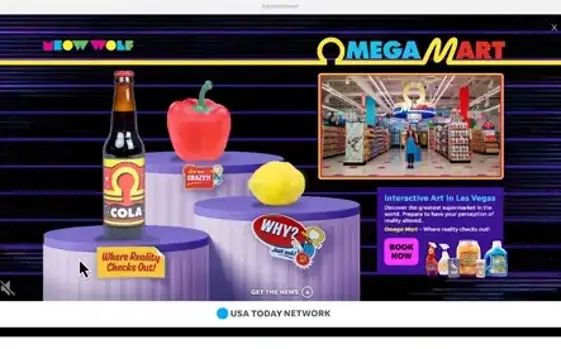
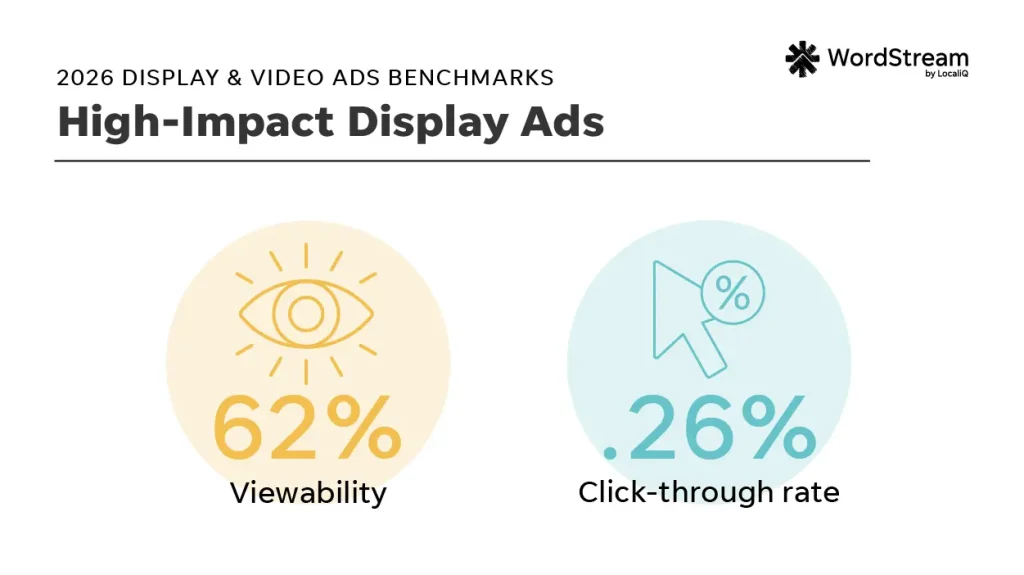
Beyond standard display ads, LocaliQ’s report also delves into the performance of more immersive formats, specifically "high-impact" display ads and video display ads, primarily within the USA TODAY Network. High-impact ads are characterized by larger, more prominent placements, often full-screen and cinematic, designed to command attention. These can include interactive elements and GIFs.
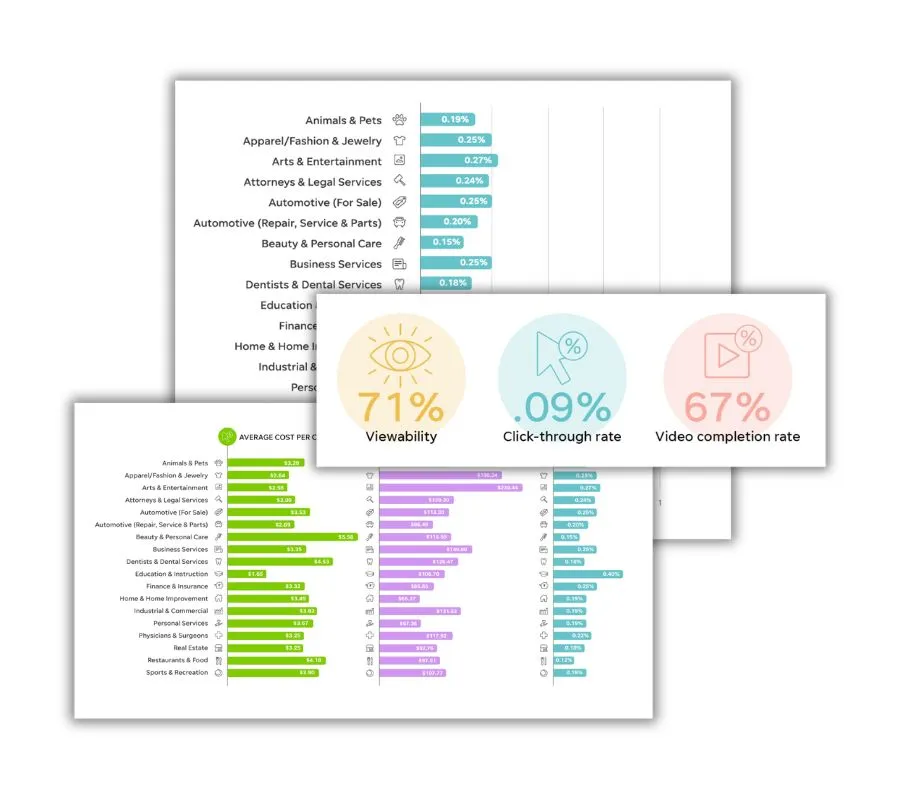
For these high-impact ads on the USA TODAY Network, the benchmark data for 2026 indicates specific performance averages for key metrics. While exact figures are presented visually in the report, the general trend suggests a strong emphasis on engagement and brand recall.
Video display ads, a format favored by many consumers due to its engaging nature, show particular promise. The report highlights that 75% of consumers have made a purchase after watching a video ad in the past year, underscoring its significant influence. For video ads on the USA TODAY Network, the benchmarks for 2026 reveal performance metrics that, while potentially showing lower CTRs, focus on the deeper engagement and memorability of the content. This aligns with the understanding that viewers may absorb the message without immediate clicks, leading to consideration and conversion at a later stage.
Native Display Ads
Native display ads, designed to seamlessly integrate into the user experience of platforms like the USA TODAY Network, offer another avenue for brands. These ads blend with editorial content, appearing within headlines, articles, and newsletters, thereby reaching audiences already engaged with the platform’s content. The report indicates that native display ads in 2026 achieved performance metrics comparable to other USA TODAY Network ad formats in terms of CTR and viewability, suggesting their effectiveness in delivering messages within a contextually relevant environment.
Expert Insights and Optimization Strategies
The LocaliQ report is enriched with expert commentary from industry professionals, offering practical advice for advertisers. Greg Carter advises viewing benchmarks as "targets" to aim for and surpass within one’s specific industry.
Key recommendations for optimizing display ad performance include:
- Diverse Placements: Utilizing a variety of placements across major networks such as the Google Display Network (including YouTube), Microsoft Audience Network, and the USA TODAY Network can maximize reach and exposure. Brett McHale, Founder of Empiric Marketing, emphasizes that display advertising "can add depth to your strategy—just simply getting in front of your target audience and reinforcing your position in their mind is deeply valuable."
- Strategic Budget Allocation: Display advertising often functions as a pre-marketing strategy, building familiarity with a brand before a purchase need arises. Navah Hopkins highlights its utility "at the beginning of the customer journey to inspire awareness, just as easily as it can remind a customer to complete their transaction towards the end with remarketing." Therefore, prioritizing display budgets, understanding that they often operate on a cost-per-view or impression model, is crucial for sustained visibility. Rhett Chassereau, Supervisor of Programmatic Buying & Optimization at USA TODAY Co., suggests that "More budget means more impressions, and more data to optimize with."
- Continuous Creative Testing: Regularly testing different creative elements, such as color schemes, imagery, and calls to action, is essential for identifying what resonates best with the target audience. Brett McHale advocates for cycling in new creative, creating multiple copy variations, and identifying top performers for further refinement.
- Leveraging AI for Scale: Artificial intelligence can be a powerful tool for scaling display campaigns by assisting with test idea generation and creative duplication. However, a manual review of AI-generated assets is recommended to ensure brand consistency and avoid potential errors.
Broader Implications and Data Methodology
The overarching message from LocaliQ’s benchmark report is that display advertising, when strategically implemented, can be a potent tool for businesses across all industries. It facilitates reaching a broad yet qualified audience, enabling both remarketing to interested prospects and pre-marketing to entirely new customer segments. Flexibility and adaptability to evolving test results and placement trends are key to capturing audience attention effectively.
The data underpinning this report is derived from a substantial sample size. Industry-specific data for display and video ads comes from 7,074 LocaliQ customer display advertising campaigns spanning April 2025 through June 2026. Benchmarks for high-impact, video, and native display ads on the USA TODAY Network are based on 55,798 location-based display advertising campaigns conducted between July 2025 and June 2026. The report clarifies that "averages" are technically median figures, used to mitigate the impact of outliers. All monetary figures are presented in U.S. Dollars.
By providing these comprehensive benchmarks and expert insights, LocaliQ aims to empower businesses to make data-driven decisions, optimize their display and video advertising investments, and ultimately achieve greater marketing success in the competitive digital landscape of 2026 and beyond.