 Pevita Pearce
The landscape of social media analytics has undergone a significant transformation with X, formerly Twitter, moving its comprehensive analytics dashboard behind a Premium paywall. This strategic pivot, implemented as part of a broader monetization effort under new ownership, has reshaped how marketers, brands, and content creators access and interpret their performance data on the platform. While individual post-level insights remain accessible for free via the mobile application, the overarching view of impressions, engagement rates, profile visits, and follower growth—once freely available—now necessitates an X Premium subscription, a change that has prompted a re-evaluation of data strategies across the digital marketing ecosystem.

A Chronology of Change: From Twitter to X and the Analytics Evolution
The shift in X’s analytics accessibility is intrinsically linked to the platform’s rebranding and strategic redirection following its acquisition by Elon Musk in late 2022. Historically, Twitter offered robust, free-of-charge analytics through its native dashboard, providing invaluable insights for users to gauge content performance and audience engagement. This open access was a cornerstone for many businesses and individual creators relying on the platform for brand building and community interaction.
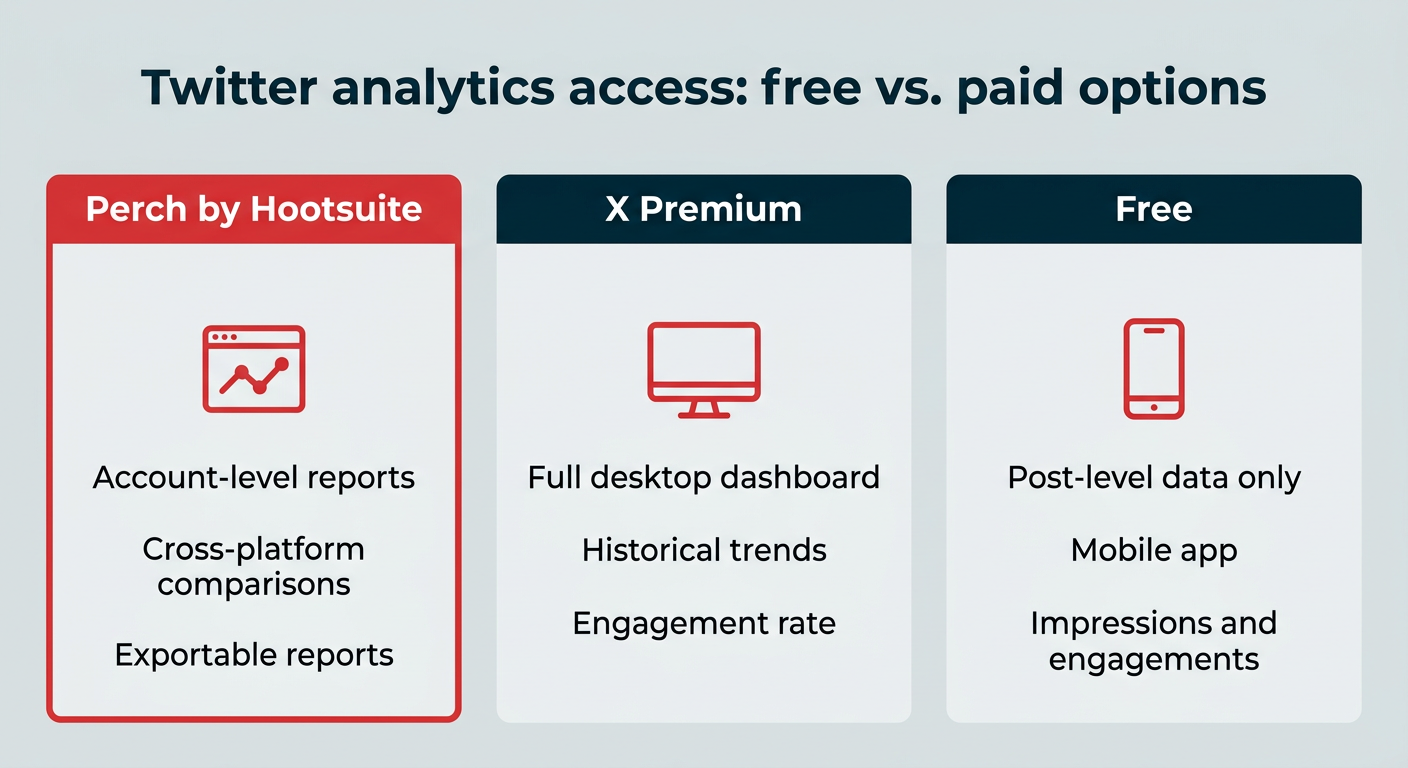
However, as part of a concerted effort to diversify revenue streams and foster a subscriber-centric model, X began phasing in significant changes. The rebranding to "X" in mid-2023 signaled a broader ambition to transform the platform into an "everything app," with monetization playing a central role. By early 2026, the complete analytics dashboard, offering aggregated account-level data and detailed trend analysis, was exclusively reserved for X Premium subscribers, which numbered approximately 4.4 million at that time. This move was framed by the platform’s management as a way to enhance the value proposition for paying members and incentivize subscriptions, aligning with a global trend among social media platforms to monetize features previously offered for free. For non-Premium users, access was limited to basic metrics on individual posts viewed directly within the mobile app, creating a distinct two-tier system for data visibility.
The New Analytics Landscape: Free vs. Premium Access
Understanding the current state of X analytics is crucial for any entity operating on the platform. The core distinction lies in the depth and breadth of data available:

- X Premium (Desktop Access): Subscribers gain full access to the comprehensive analytics dashboard via
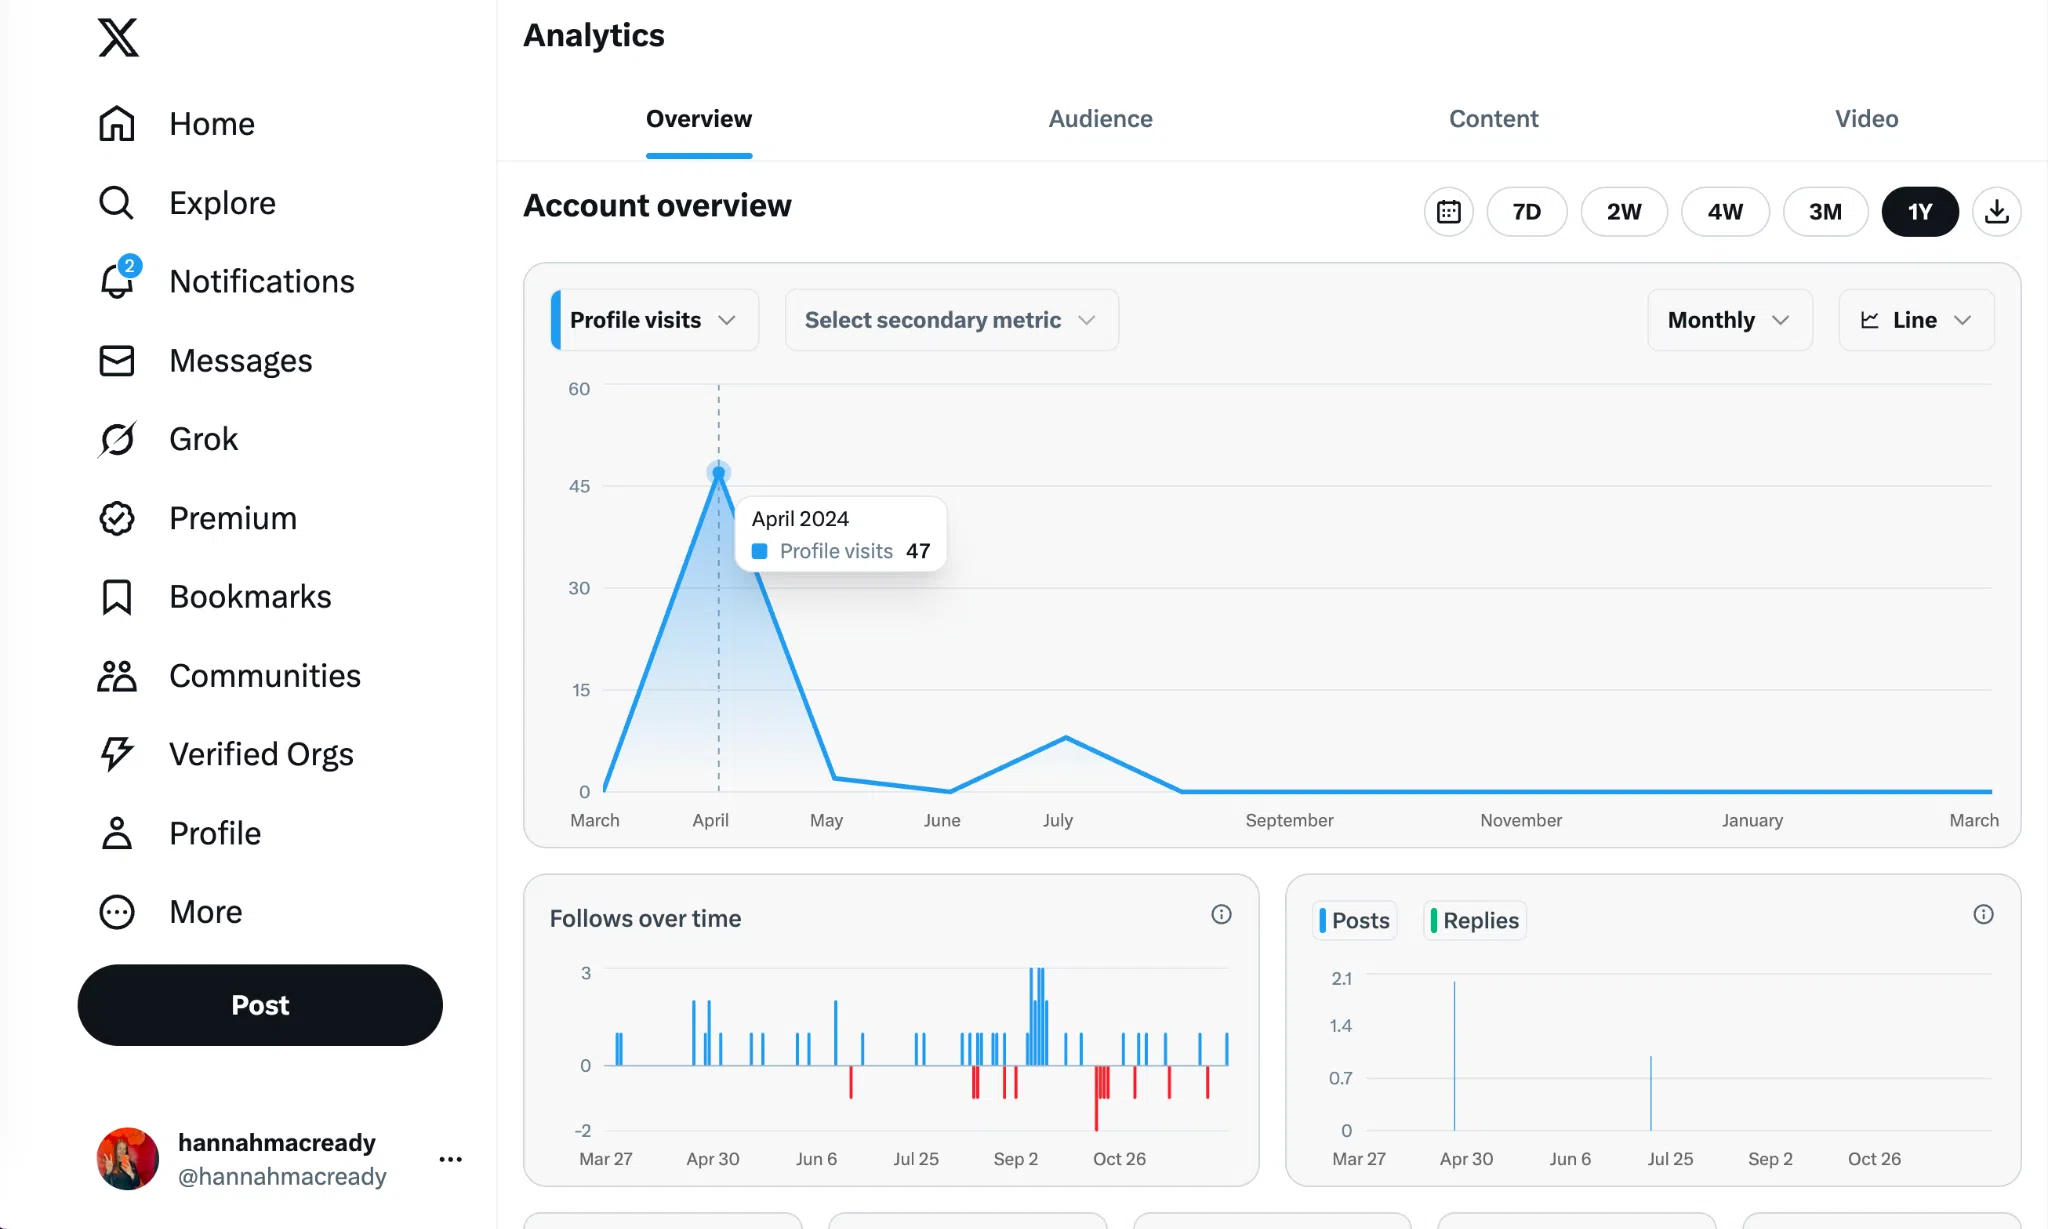
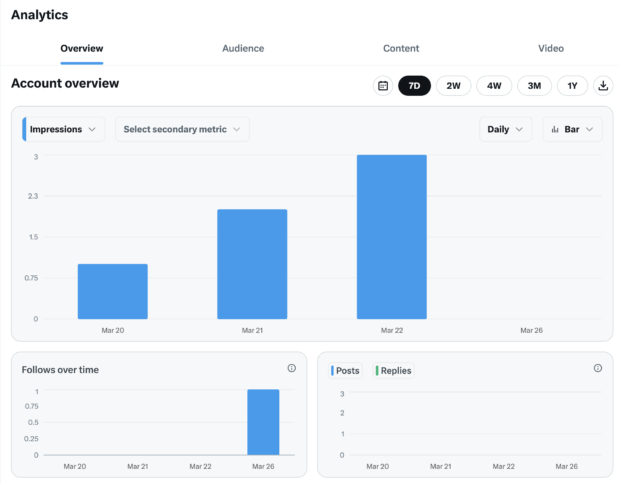
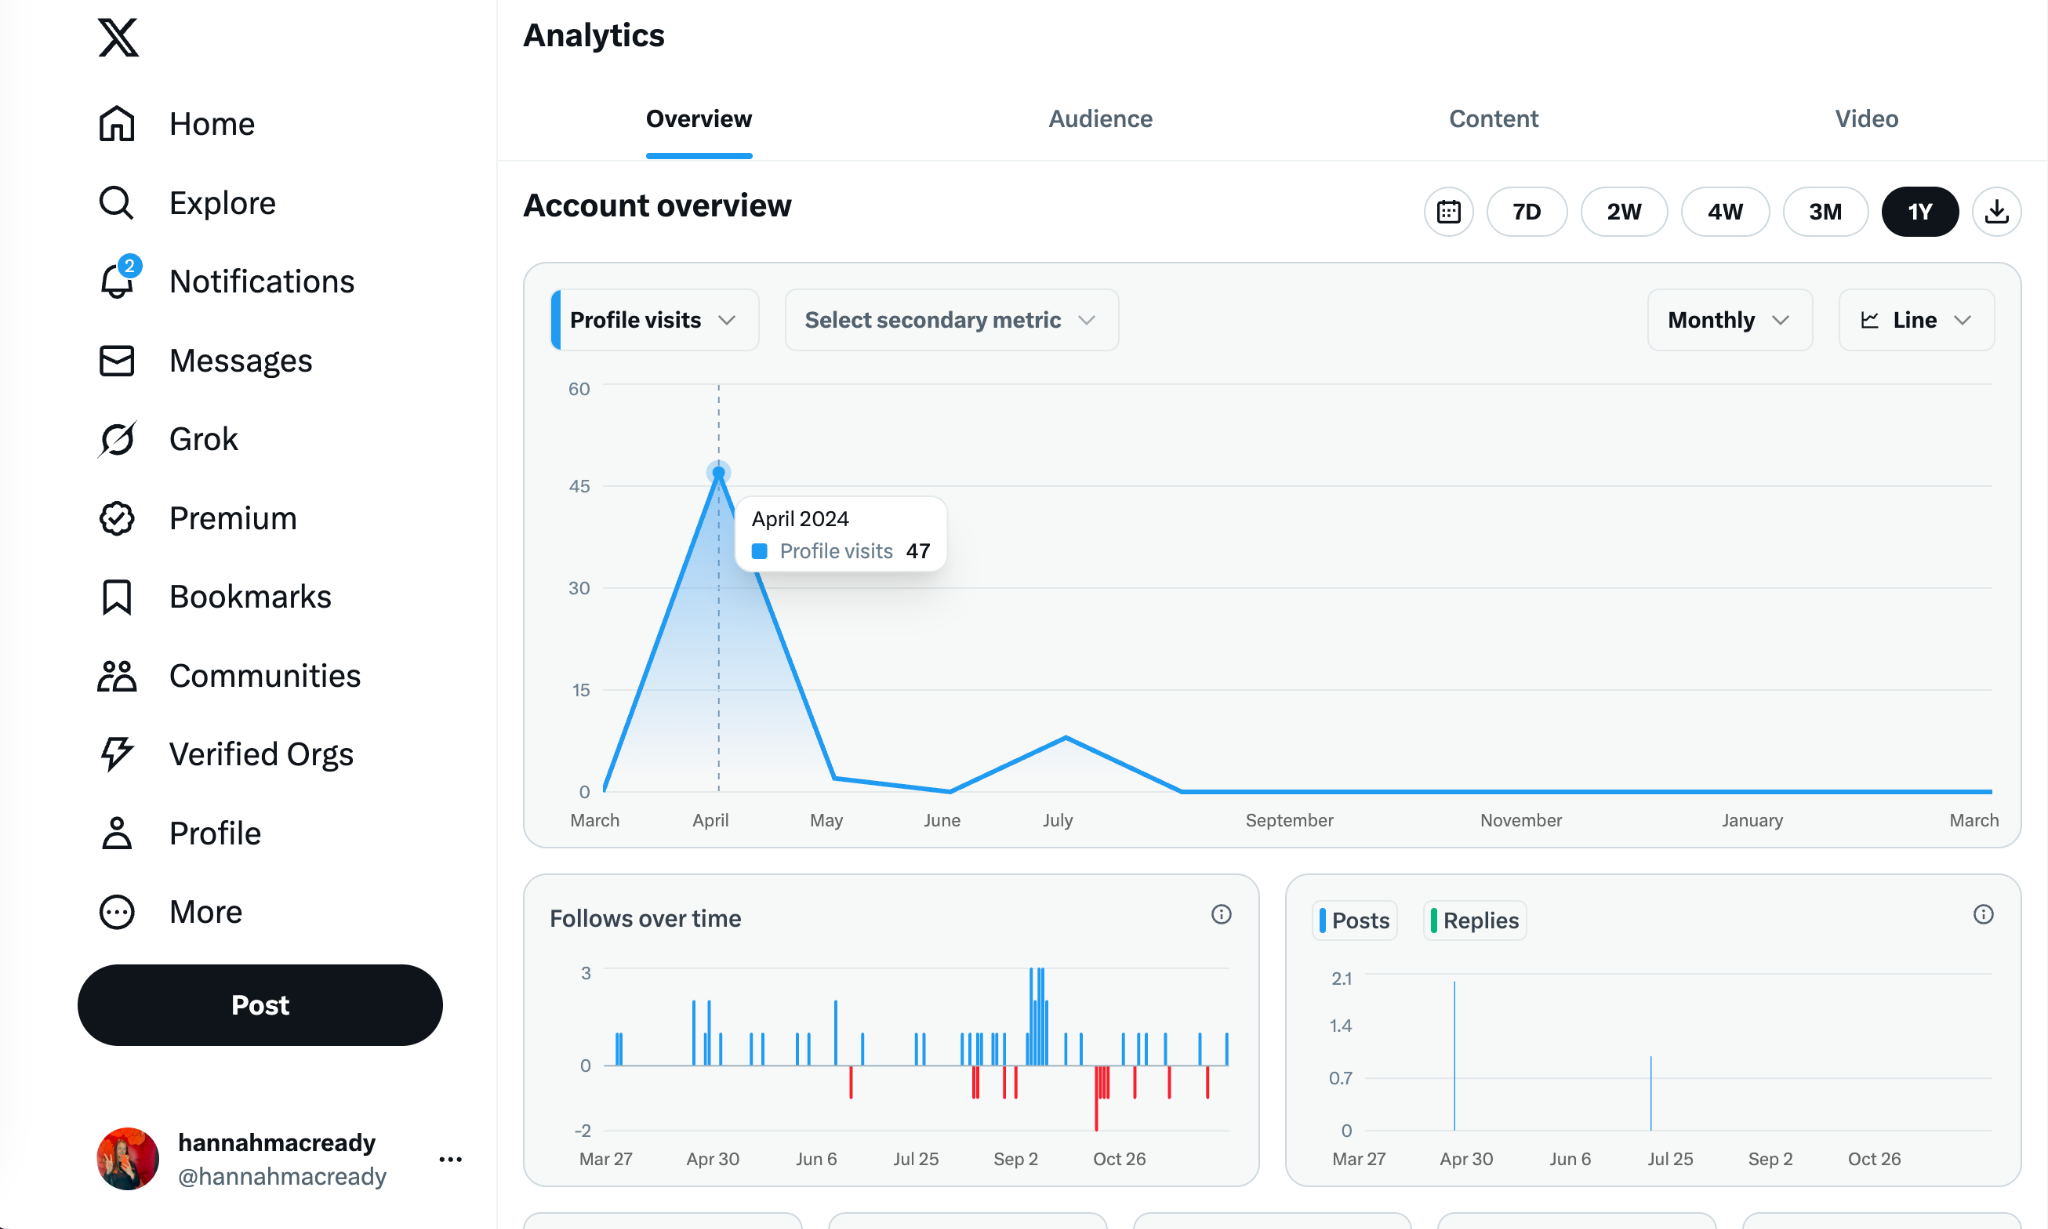
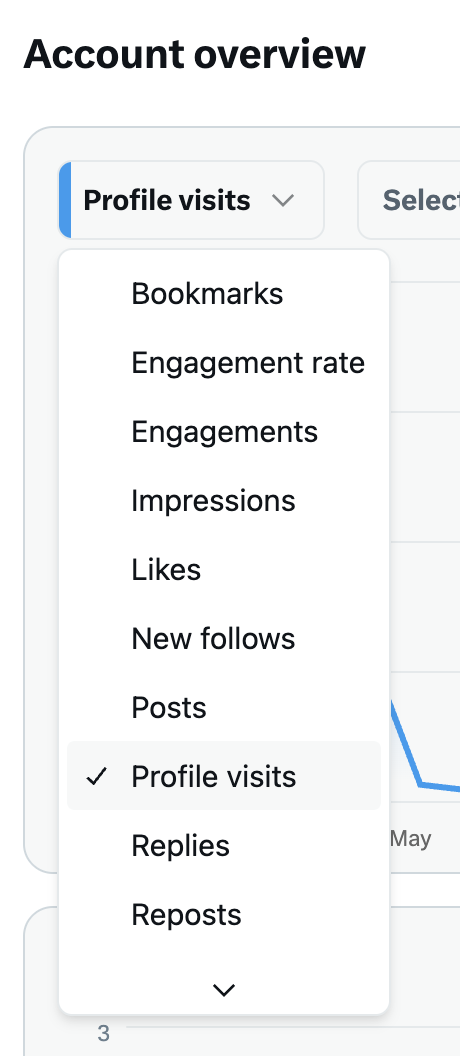
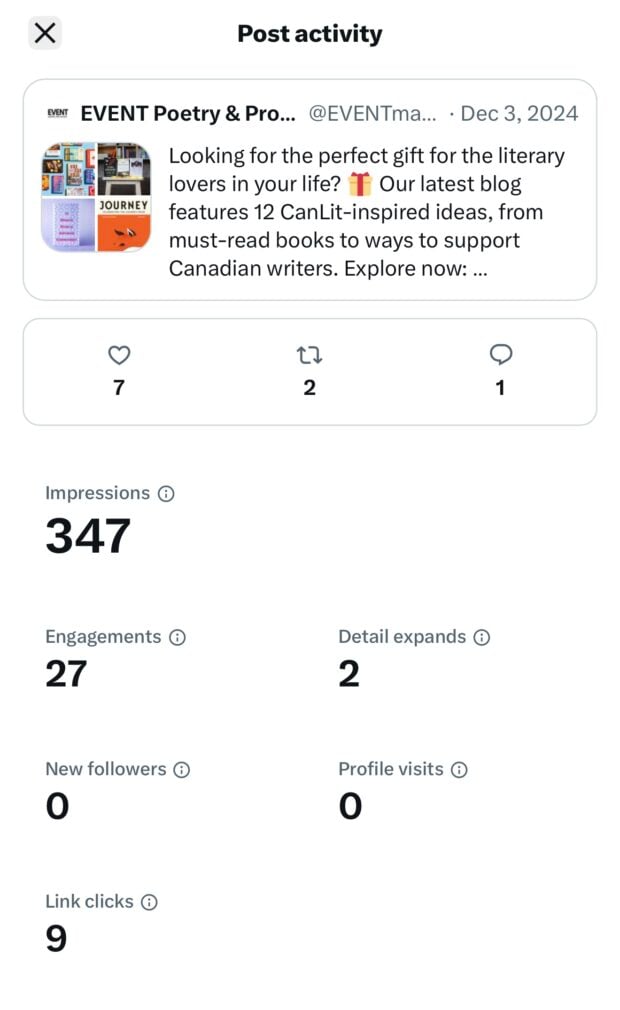
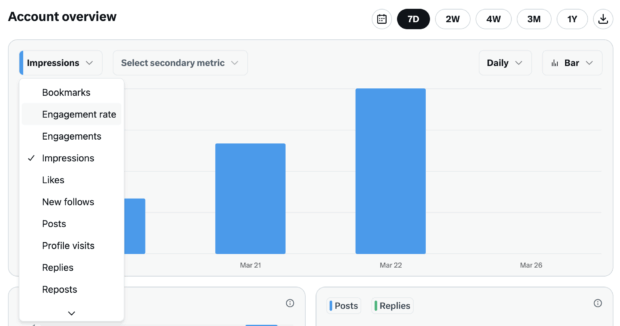
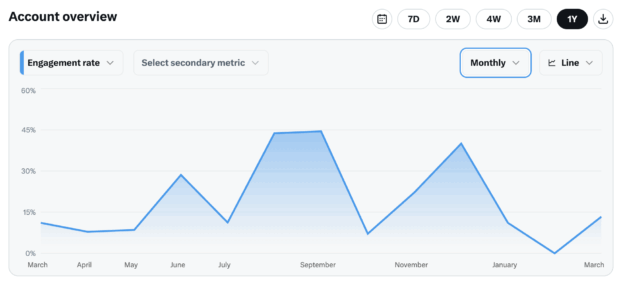
x.com/i/account_analytics. This dashboard provides a holistic overview of account performance, including daily, weekly, monthly, and even "pay period" metrics. Users can track impressions, engagement rate, profile visits, and new follower counts, with the ability to toggle between various metrics like replies, reposts, likes, and bookmarks, visualizing performance trends over time through customizable line and bar graphs. A dedicated "Content" tab allows for in-depth analysis of individual posts within this aggregated view. - Free Access (Mobile App): Without an X Premium subscription, users are limited to post-level analytics directly on the mobile application. By tapping on any individual post and selecting "View analytics" from the three-dot menu, users can see a quick breakdown of impressions, engagements, and other basic interactions for that specific piece of content. This provides immediate feedback on singular posts but lacks the aggregated, historical, and comparative data essential for strategic planning and comprehensive reporting.
This bifurcated access has led to a noticeable impact on marketers. Industry observers note that while X’s monetization strategy aims to create a more robust ecosystem for paid users, it simultaneously places significant hurdles for smaller businesses and independent creators who previously relied on free insights to refine their content strategies. The average X post in 2025 garnered approximately 33 likes and 7 reposts, a benchmark that becomes harder to contextualize and improve upon without access to broader account trends. Furthermore, average impressions fell by 5% year-over-year in 2025, underscoring the increasing challenge of organic reach and the heightened need for granular data to optimize content.

Key Metrics in the Data-Driven X Strategy
Despite the changes in access, the fundamental metrics for evaluating performance on X remain critical. Marketers must prioritize data that aligns directly with their overarching marketing goals, whether these are brand awareness, engagement, traffic generation, or audience growth.
- Engagement Rate: This metric measures the percentage of people who interacted with content after seeing it, encompassing clicks, likes, replies, and reposts. It serves as an immediate indicator of content relevance and resonance. A consistently low engagement rate signals a need to refine content hooks, topics, or formats, potentially exploring videos, multi-image posts, or interactive polls. For Premium users, this is directly available on the dashboard; free users must calculate it manually from individual post data.
- Follower Growth: This tracks the net change in an account’s audience, reflecting both new follows and unfollows. It’s a direct measure of audience expansion and provides immediate feedback on content strategy. Stagnant growth suggests a need for more compelling content that encourages long-term interest, potentially through consistent posting or a refined tone.
- Reposts (formerly Retweets): Reposts signify that content was compelling enough for users to share with their own networks, dramatically increasing reach. They are a powerful indicator of content virality and algorithmic favor. Low reposts suggest content may not be sparking strong opinions or offering enough value to warrant sharing.
- Impressions: This metric counts the total number of times content appeared in users’ feeds. While distinct from "reach" (which counts unique users), impressions indicate content visibility and algorithmic distribution. A decline in impressions, such as the observed 5% drop in 2025, highlights the necessity for strategies that boost visibility, such as tapping into trending topics or utilizing video content.
- Reach: Distinct from impressions, reach quantifies the unique number of accounts that saw a post. It provides a clearer picture of the actual audience size being touched, particularly important for awareness objectives. X’s native dashboard primarily focuses on impressions for organic posts, making third-party tools more valuable for tracking unique reach.
- Link Clicks: For campaigns aimed at driving external traffic (e.g., to a website, blog, or product page), link clicks are paramount. This metric directly measures conversion interest and the effectiveness of calls-to-action (CTAs). Low click-through rates point to a need for stronger hooks, more persuasive CTAs, or better-optimized link previews.
- Likes: A fundamental form of engagement, likes indicate passive approval or appreciation for content. While less impactful than replies or reposts, consistent likes can signal content that resonates broadly and serves as a useful benchmark for creative testing.
- Replies: Replies represent direct conversations sparked by content, fostering community and deeper engagement. They are vital for building brand connection. Low reply rates suggest content may not be prompting discussion; incorporating questions or inviting opinions can significantly improve this.
- Mentions: This metric tracks instances where an account’s @handle is tagged, including direct tags, replies, and organic discussions. More mentions indicate increased word-of-mouth and broader brand conversation. To increase mentions, brands can engage more actively in trending conversations or run user-generated content campaigns.
- Profile Visits: Profile visits occur when users click on an account’s name or handle to view their profile, indicating heightened interest. This often precedes a follow or further investigation into the brand. Low profile visits may signal a need to optimize the profile itself with a clear bio, pinned high-performing content, and strong CTAs.
- Video Views and Completion Rate: With X’s increased emphasis on video content, these metrics are crucial. Video views track how many times a video was watched, while completion rate indicates the percentage of viewers who watched until the end. A low completion rate suggests the video’s hook, pacing, or length needs adjustment, often benefiting from tighter intros and captions for sound-off viewing.
Strategic Adaptations for the Modern Marketer
In response to X’s evolving analytics access, social media professionals are adopting more sophisticated and adaptive strategies:
- Integrated Data Review: As Nick Martin, Social Media Marketing Manager at Tipalti, emphasizes, it’s crucial to examine both immediate post-level feedback and broader profile performance trends. Marketers must zoom out to analyze weekly, monthly, and quarterly performance to identify sustained patterns and make agile adjustments to content. This includes maintaining a running list of content experiments (e.g., image vs. video, thread vs. single post) to quickly pivot from underperforming content.
- Establishing Robust Benchmarks: Without consistent benchmarks, performance metrics lack context. Marketers must establish baselines for typical impressions, engagement rates, and clicks. Tools that offer historical data or industry averages (like Hootsuite’s social media benchmark report) are invaluable for understanding what constitutes a "good" performance relative to past efforts and industry peers.
- Goal-Centric Metric Prioritization: The sheer volume of data can be overwhelming. As Martin notes, focusing only on metrics that directly support defined marketing goals (e.g., impressions and engagements for brand awareness) prevents "drowning in numbers." This selective approach ensures that resources are allocated to tracking what truly drives business objectives, rather than chasing vanity metrics.
- Leveraging Competitive Intelligence: While direct competitor analytics are unavailable, social listening tools and private lists of competitor accounts enable marketers to monitor their peers’ content strategies and audience responses. This competitive intelligence can inform content experimentation, helping identify successful formats or topics within the industry.
- Cross-Departmental Insights Sharing: Social media data holds value beyond the marketing team. Sharing top-performing content, customer feedback, and competitive intelligence with product, sales, and creative teams can inform broader business decisions, from product development to sales enablement and design choices. This positions social media analytics as a strategic asset for the entire organization.
The Rise of Third-Party Analytics Tools
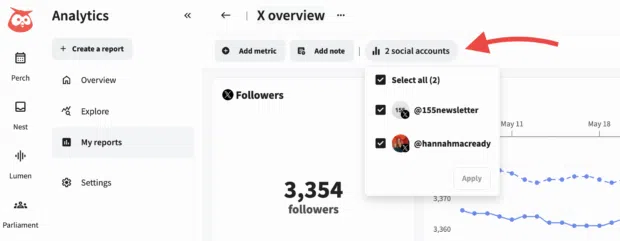
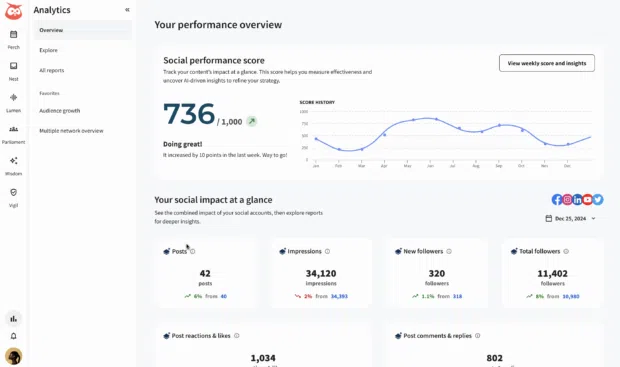
The changes at X have significantly increased the reliance on third-party social media management and analytics platforms. These tools offer a unified view across multiple social networks, customizable reporting, and often, more granular insights than the native X Premium dashboard provides.
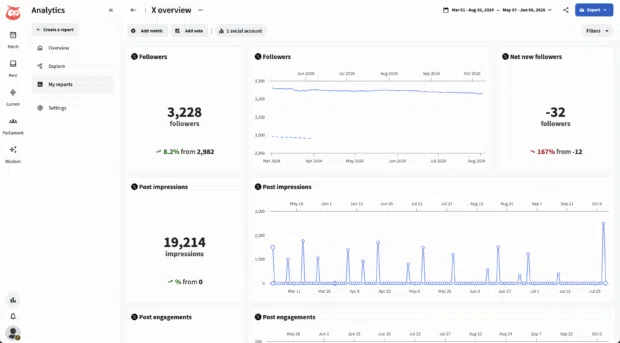
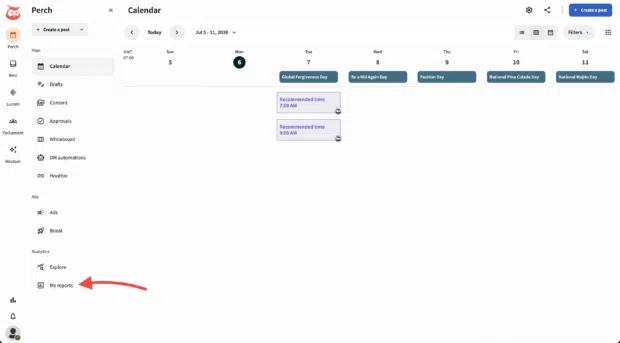
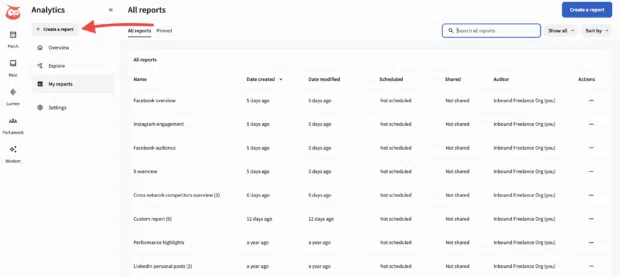
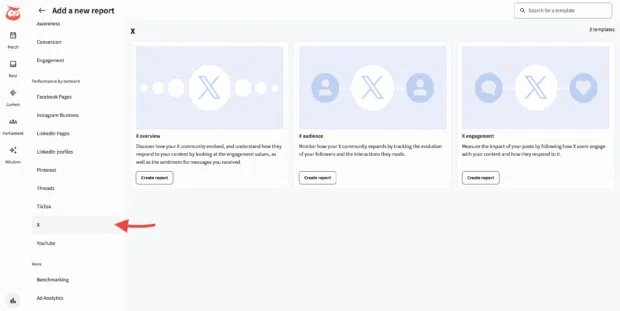
- Perch by Hootsuite: Positioned for teams and enterprise brands, Perch offers comprehensive, cross-platform reporting. It allows users to track key X metrics alongside data from other social channels, filter by custom tags, and generate export-ready reports. Its strength lies in customizable dashboards, competitive analysis features (via Lumen by Talkwalker), and the ability to track the entire customer journey, linking social interactions to CRM data. While its pricing is higher, its depth of features justifies the investment for larger organizations.
- Buffer: An excellent choice for solo marketers and small teams, Buffer provides straightforward analytics for core post metrics. It offers a clear overview of content performance, engagement, and follower growth, helping users spot trends and maintain consistency without a steep learning curve. Its limitations include a lack of social listening or competitor tracking, but its user-friendly interface and affordable plans make it a strong contender for those needing basic yet effective insights.
- Later: Primarily catering to creators who schedule content through its platform, Later’s Twitter Analytics monitors growth and engagement for scheduled Tweets. It offers insights into follower growth and allows sorting by engagement, favorites, reposts, or clicks. While useful for its specific user base, its limitation to only tracking posts published via Later and a typical three-month data window might not suffice for comprehensive, long-term analysis.
Monetization and the Creator Economy: X’s Payouts
Beyond analytics, X’s creator ad revenue sharing program represents another facet of its monetization strategy. While X does not publish a fixed rate per million views, payouts are highly variable and depend on the ad revenue generated from ads displayed in the replies to a creator’s posts. Factors influencing these payouts include the number of verified users viewing the posts, the level of engagement (especially replies), and the overall demand for ads on the platform. Payouts are calculated on a rolling two-week basis, aligning with a specific "pay period" filter available in the X analytics dashboard for Premium users. For marketers, the program should be viewed as a potential bonus rather than a primary revenue or reporting metric, with the core focus remaining on tangible business outcomes like clicks, conversions, and brand uplift.
Conclusion: Adapting to the Data-Driven Future
The transformation of X’s analytics access underscores a broader industry trend where social media platforms increasingly seek to monetize data and advanced features. For businesses and marketers, this shift necessitates a proactive and adaptive approach to data strategy. Relying solely on free, native tools is no longer sufficient for comprehensive insights. Instead, a combination of leveraging available free data, considering X Premium for deeper native insights, and critically, integrating robust third-party analytics platforms becomes essential. By focusing on goal-aligned metrics, establishing clear benchmarks, and leveraging competitive intelligence, organizations can continue to harness the power of X for brand building, community engagement, and ultimately, measurable business success in an ever-evolving digital landscape. The ability to track impact across the customer journey—from awareness (impressions) to consideration (engagement, reposts) and conversion (link clicks, profile visits)—and to communicate these KPIs effectively to senior stakeholders remains paramount in proving the tangible ROI of social media efforts.

 rifanmuazin
 Lina Irawan