

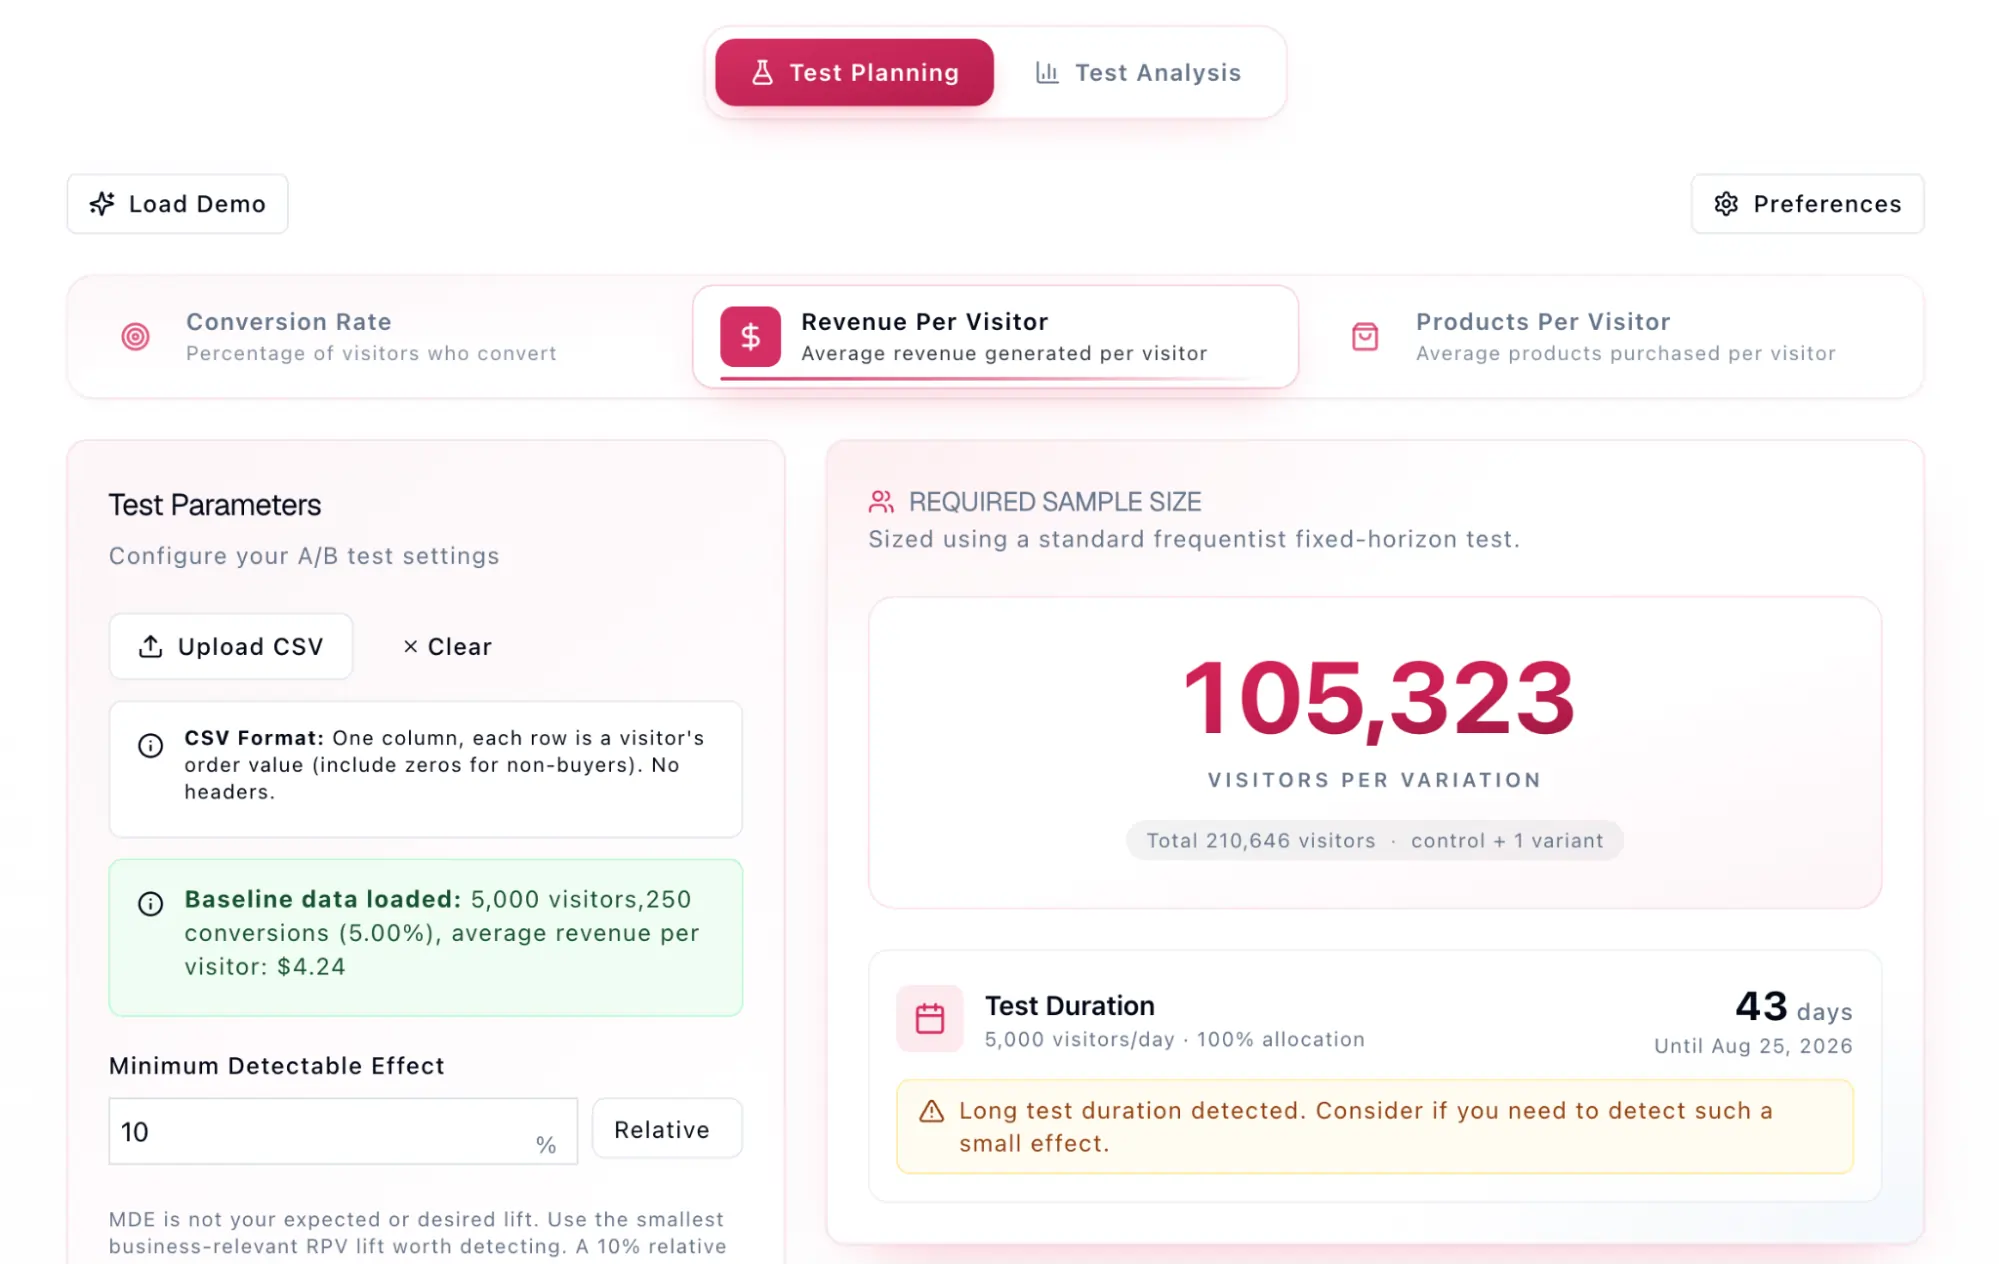
Statistical power represents the foundational probability that an experiment will detect a true effect of a specified magnitude when that effect actually exists, serving as a critical safeguard against the pervasive risk of false negatives in digital growth strategies. In the competitive landscape of digital optimization, where a marginal increase in conversion rates can translate into millions of dollars in annual recurring revenue, the concept of statistical power has emerged as the definitive measure of an experiment’s sensitivity. While statistical significance is often the primary focus of marketing teams—serving to minimize false positives—statistical power acts as the inverse, ensuring that legitimate improvements are not discarded due to insufficient data or poorly designed parameters.

The history of digital experimentation has seen a shift from rudimentary "gut-feeling" changes to rigorous, data-driven frameworks. Early A/B testing in the early 2000s often neglected power analysis, leading to a phenomenon known as the "winner’s curse," where initial gains could not be replicated upon full-scale rollout. Today, as organizations like Google, Amazon, and Microsoft run tens of thousands of concurrent experiments, the mathematical rigor behind power analysis has become standardized. It is no longer sufficient to simply wait for a "p-value" to drop below 0.05; modern data scientists demand that tests are adequately powered—typically at 80% or higher—before they are even launched.
The Four Pillars of Experimental Sensitivity
The determination of statistical power relies on the interplay of four primary variables: sample size, minimum detectable effect (MDE), significance level (alpha), and data variability. Understanding these factors is essential for any organization seeking to move beyond superficial metrics and into high-fidelity optimization.

Sample size, denoted as N, is the most direct lever available to researchers. As the number of independent randomized units—usually unique visitors—increases, the "noise" in the data tends to average out, making it easier to identify the "signal" of a true conversion lift. In a scenario where an e-commerce platform sees 50,000 visitors monthly, a test running for 30 days provides significantly more power than a two-day snapshot, as it accounts for the natural fluctuations of weekday versus weekend shopping behavior.
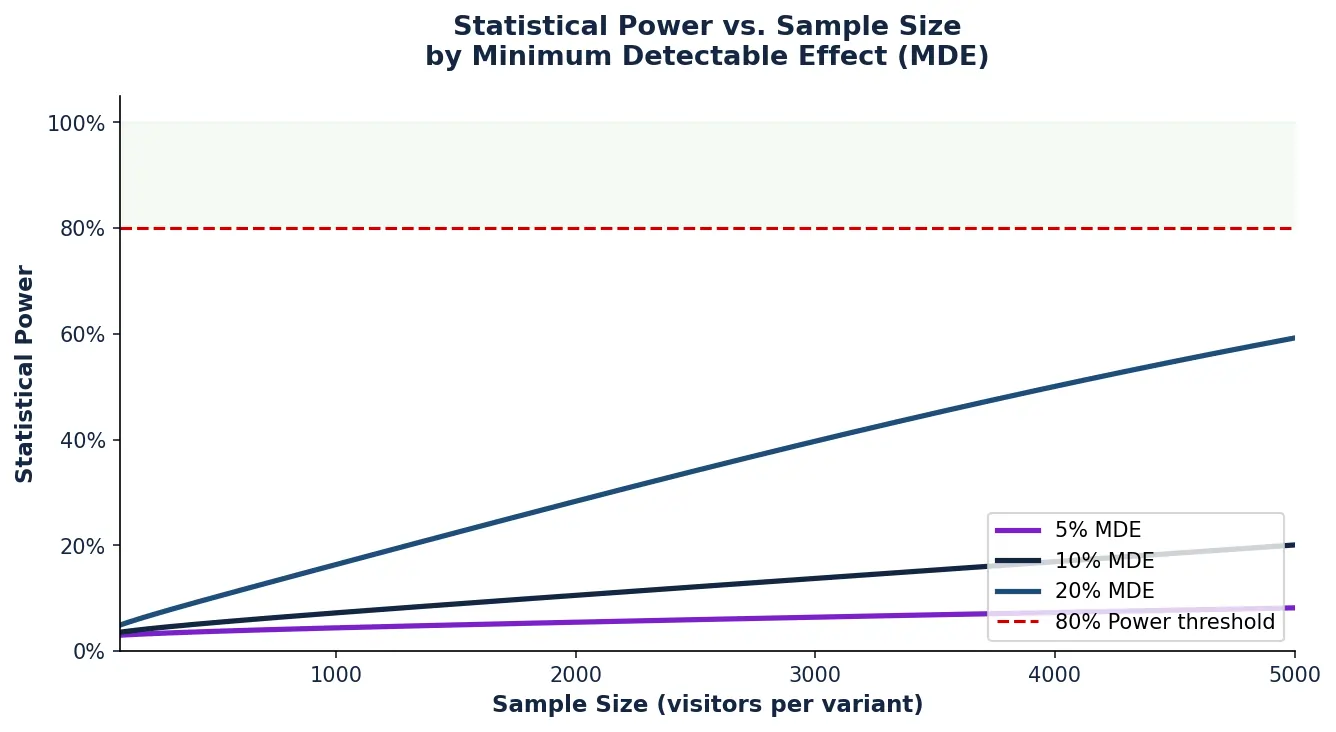
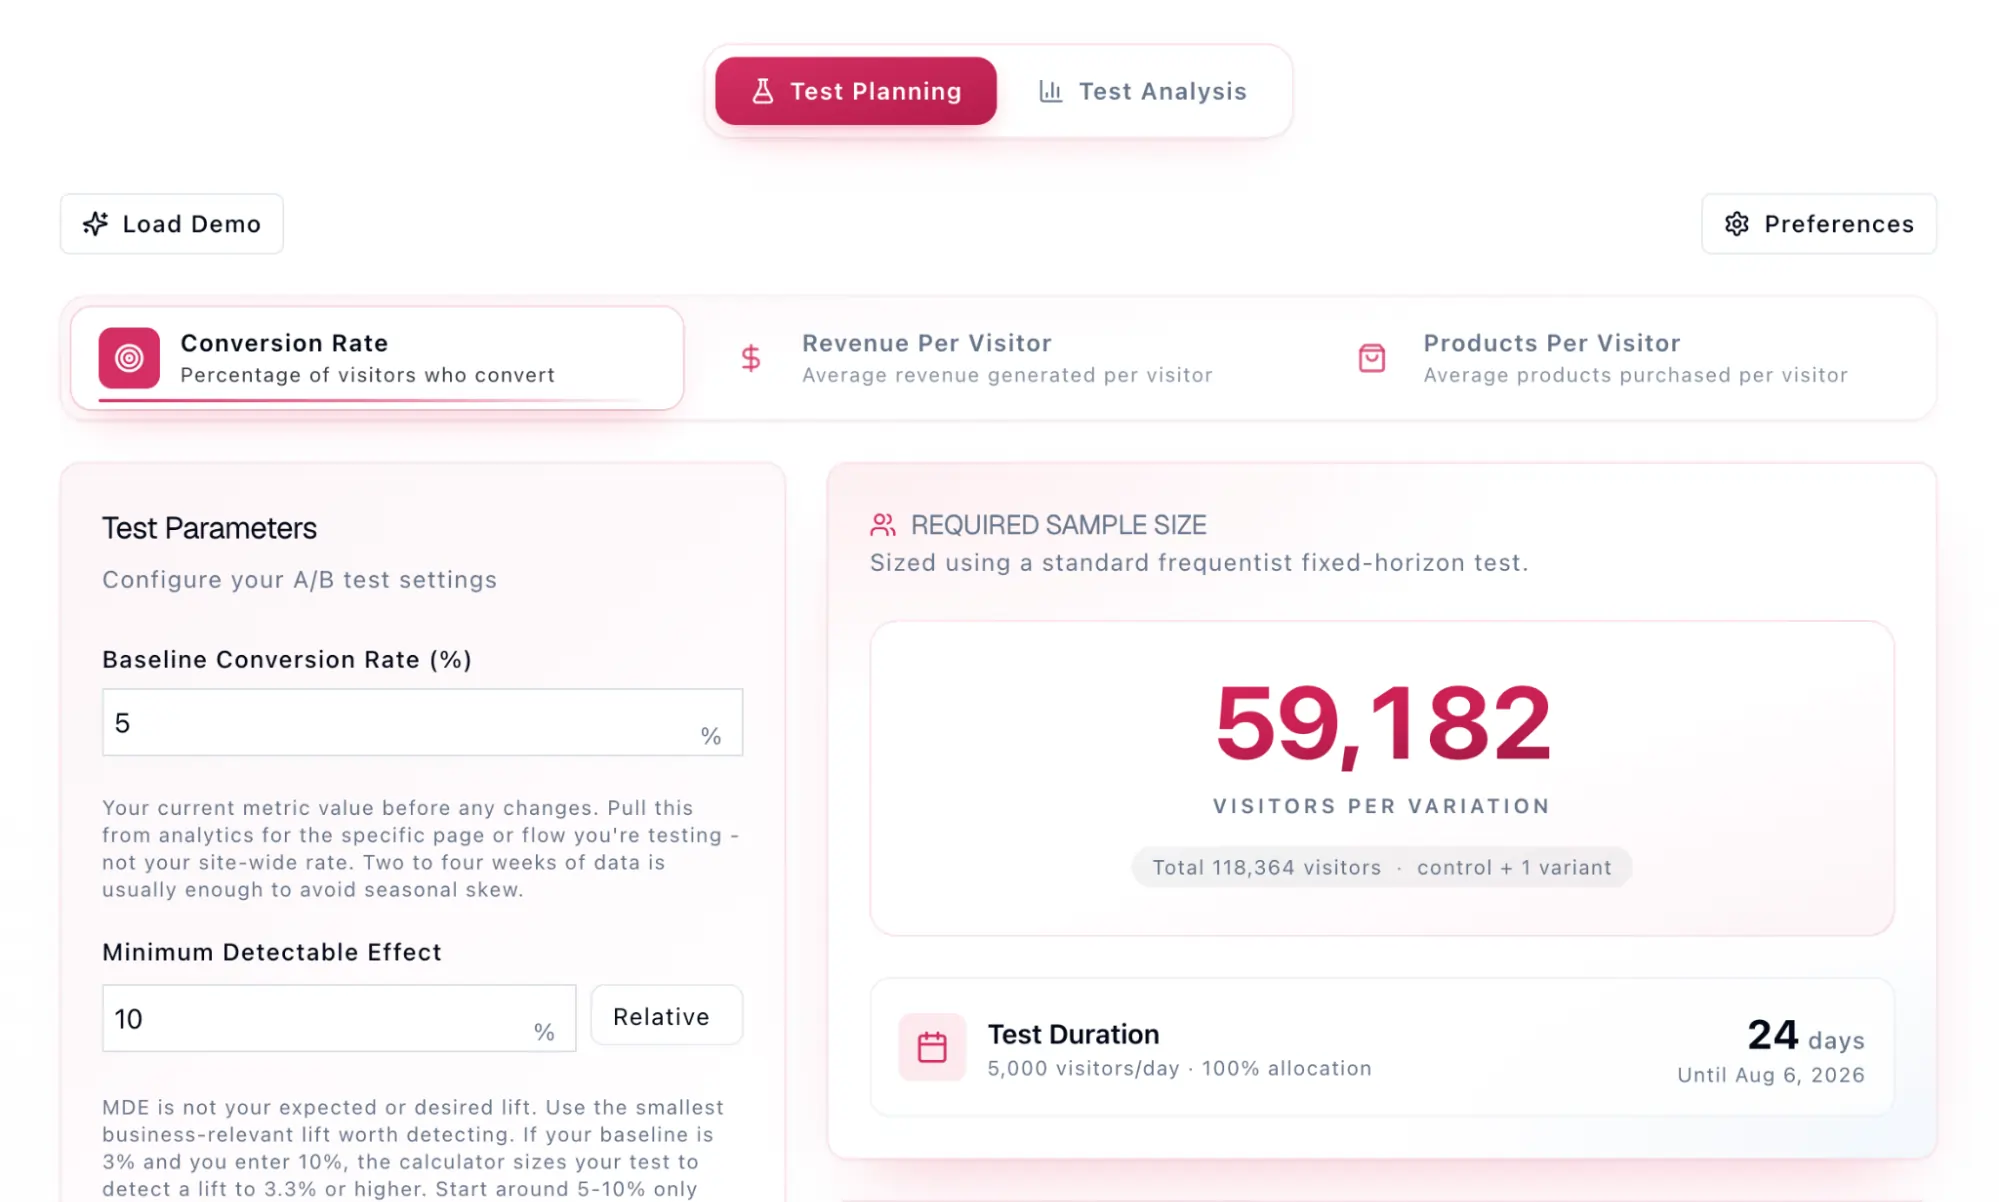
The Minimum Detectable Effect (MDE) represents the smallest relative or absolute improvement that the business deems worth detecting. There is an inverse relationship between MDE and the required sample size: to detect a massive 20% lift, a relatively small sample is needed; however, to reliably detect a subtle 2% lift, the sample size must grow exponentially. Setting an unrealistic MDE is a common pitfall in digital marketing; if a team sets an MDE of 10% but the actual change only produces a 3% lift, the test will likely return a non-significant result, even though the variation was objectively superior to the control.
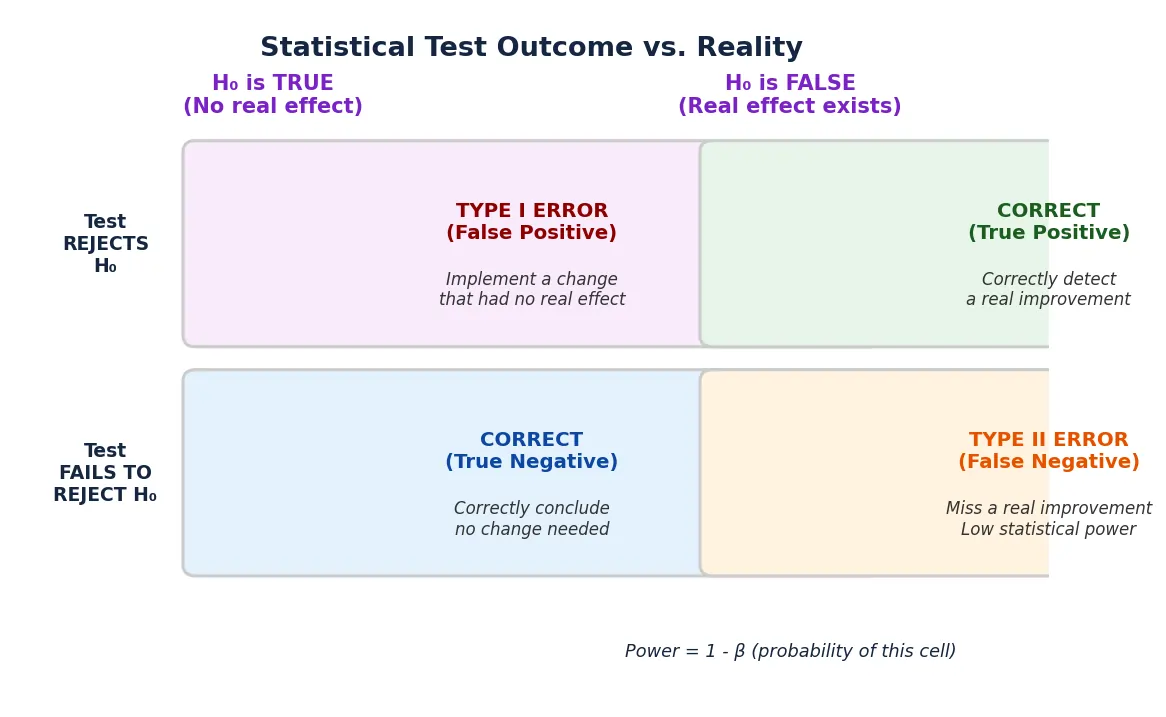
The significance level, or alpha, is the threshold for rejecting the null hypothesis. While the industry standard is often set at 5% (a 95% confidence level), this choice directly impacts power. A more stringent alpha (e.g., 1%) reduces the risk of a false positive but simultaneously lowers the test’s power, as it requires more overwhelming evidence to declare a winner. This creates a strategic trade-off for decision-makers: do they prioritize avoiding "fake wins" or avoiding "missed opportunities"?
Finally, data variability or variance measures the natural dispersion within the metric being tested. In binary metrics, such as a click-through rate where the outcome is either 0 or 1, variance is naturally constrained. However, for continuous metrics like Revenue Per Visitor (RPV), where one customer might spend $10 and another $5,000, the variance is high. High-variance metrics require substantially larger samples to achieve the same statistical power as low-variance metrics.
The Economic Consequences of Underpowered Testing
The financial implications of running underpowered tests are profound. In the SaaS sector, where growth is compounded through recurring subscriptions, a missed win is not merely a neutral event—it is a significant loss of potential capital. Consider a business generating $12 million in annual revenue. If an experiment designed to optimize the checkout flow produces a 2% lift that goes undetected because the test was underpowered, the company effectively forfeits $240,000 in annual growth. Because this revenue is recurring, the loss extends into subsequent years, impacting the company’s valuation and long-term scaling trajectory.
Furthermore, low power compromises the integrity of the results that do achieve significance. This is often explained through the lens of "Twyman’s Law," which posits that any statistic that looks particularly interesting or unusual is likely erroneous. In underpowered tests, the only results that can cross the threshold of significance are those that have been exaggerated by random sampling noise. This leads to "effect size inflation," where a variation appears to provide a 15% lift in a small test, but provides 0% when implemented site-wide. This erosion of trust in data can lead to organizational skepticism regarding experimentation as a whole.
Methodological Variations: Frequentist, Sequential, and Bayesian
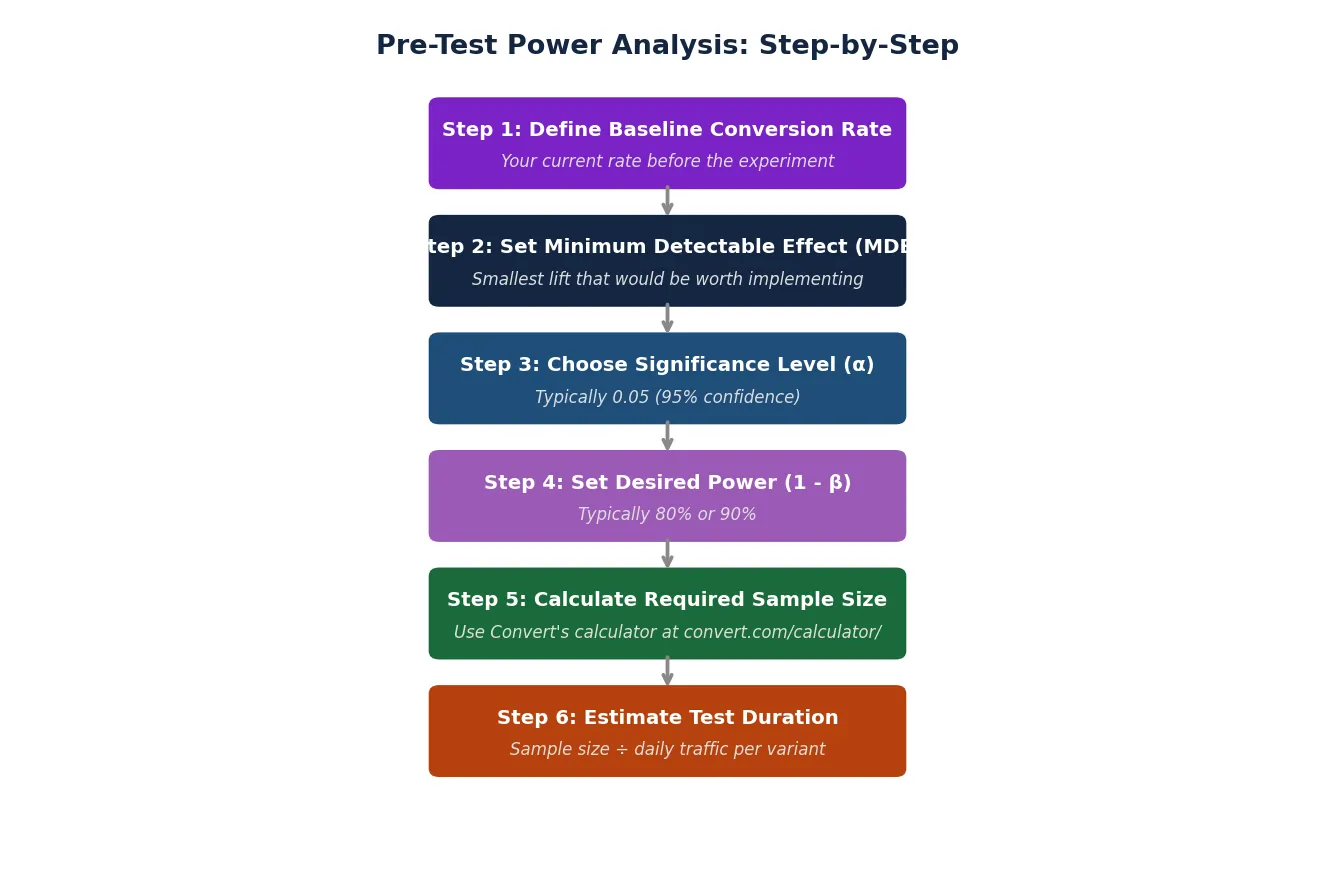
The application of power varies significantly across different statistical methodologies. The Frequentist approach, which remains the most common in corporate environments, requires a fixed-sample design. In this model, power analysis is a pre-test requirement. Researchers must determine the sample size in advance and refrain from "peeking" at the data until the full sample is collected. Failure to adhere to this protocol inflates the false positive rate, rendering the power calculations moot.
In contrast, Sequential testing allows for continuous monitoring. By adjusting the statistical boundaries as data accumulates, sequential models can allow for "early stopping" if a variation is performing exceptionally well or poorly. While this provides more flexibility, it does not eliminate the need for power. The "horizon" of the test must still be planned to ensure that a lack of early significance does not lead to premature abandonment of a potentially winning idea.
Bayesian statistics offers a different paradigm, focusing on the "probability of beating the control" rather than p-values. While Bayesian methods do not use a formal "power" threshold in the classical sense, the underlying principle of sensitivity remains. A Bayesian test with a small sample will have a wide "credible interval," meaning the certainty of the win remains low until more data is gathered.
Strategic Recommendations for Traffic-Constrained Environments
A common challenge for startups and niche B2B companies is the lack of sufficient traffic to reach 80% power for small MDEs. In these instances, practitioners must adopt alternative strategies. One approach is to increase the MDE, essentially using the experiment as a "filter" to catch only the most impactful changes. While this risks missing smaller wins, it ensures that the wins that are detected are substantial enough to justify the engineering effort of implementation.
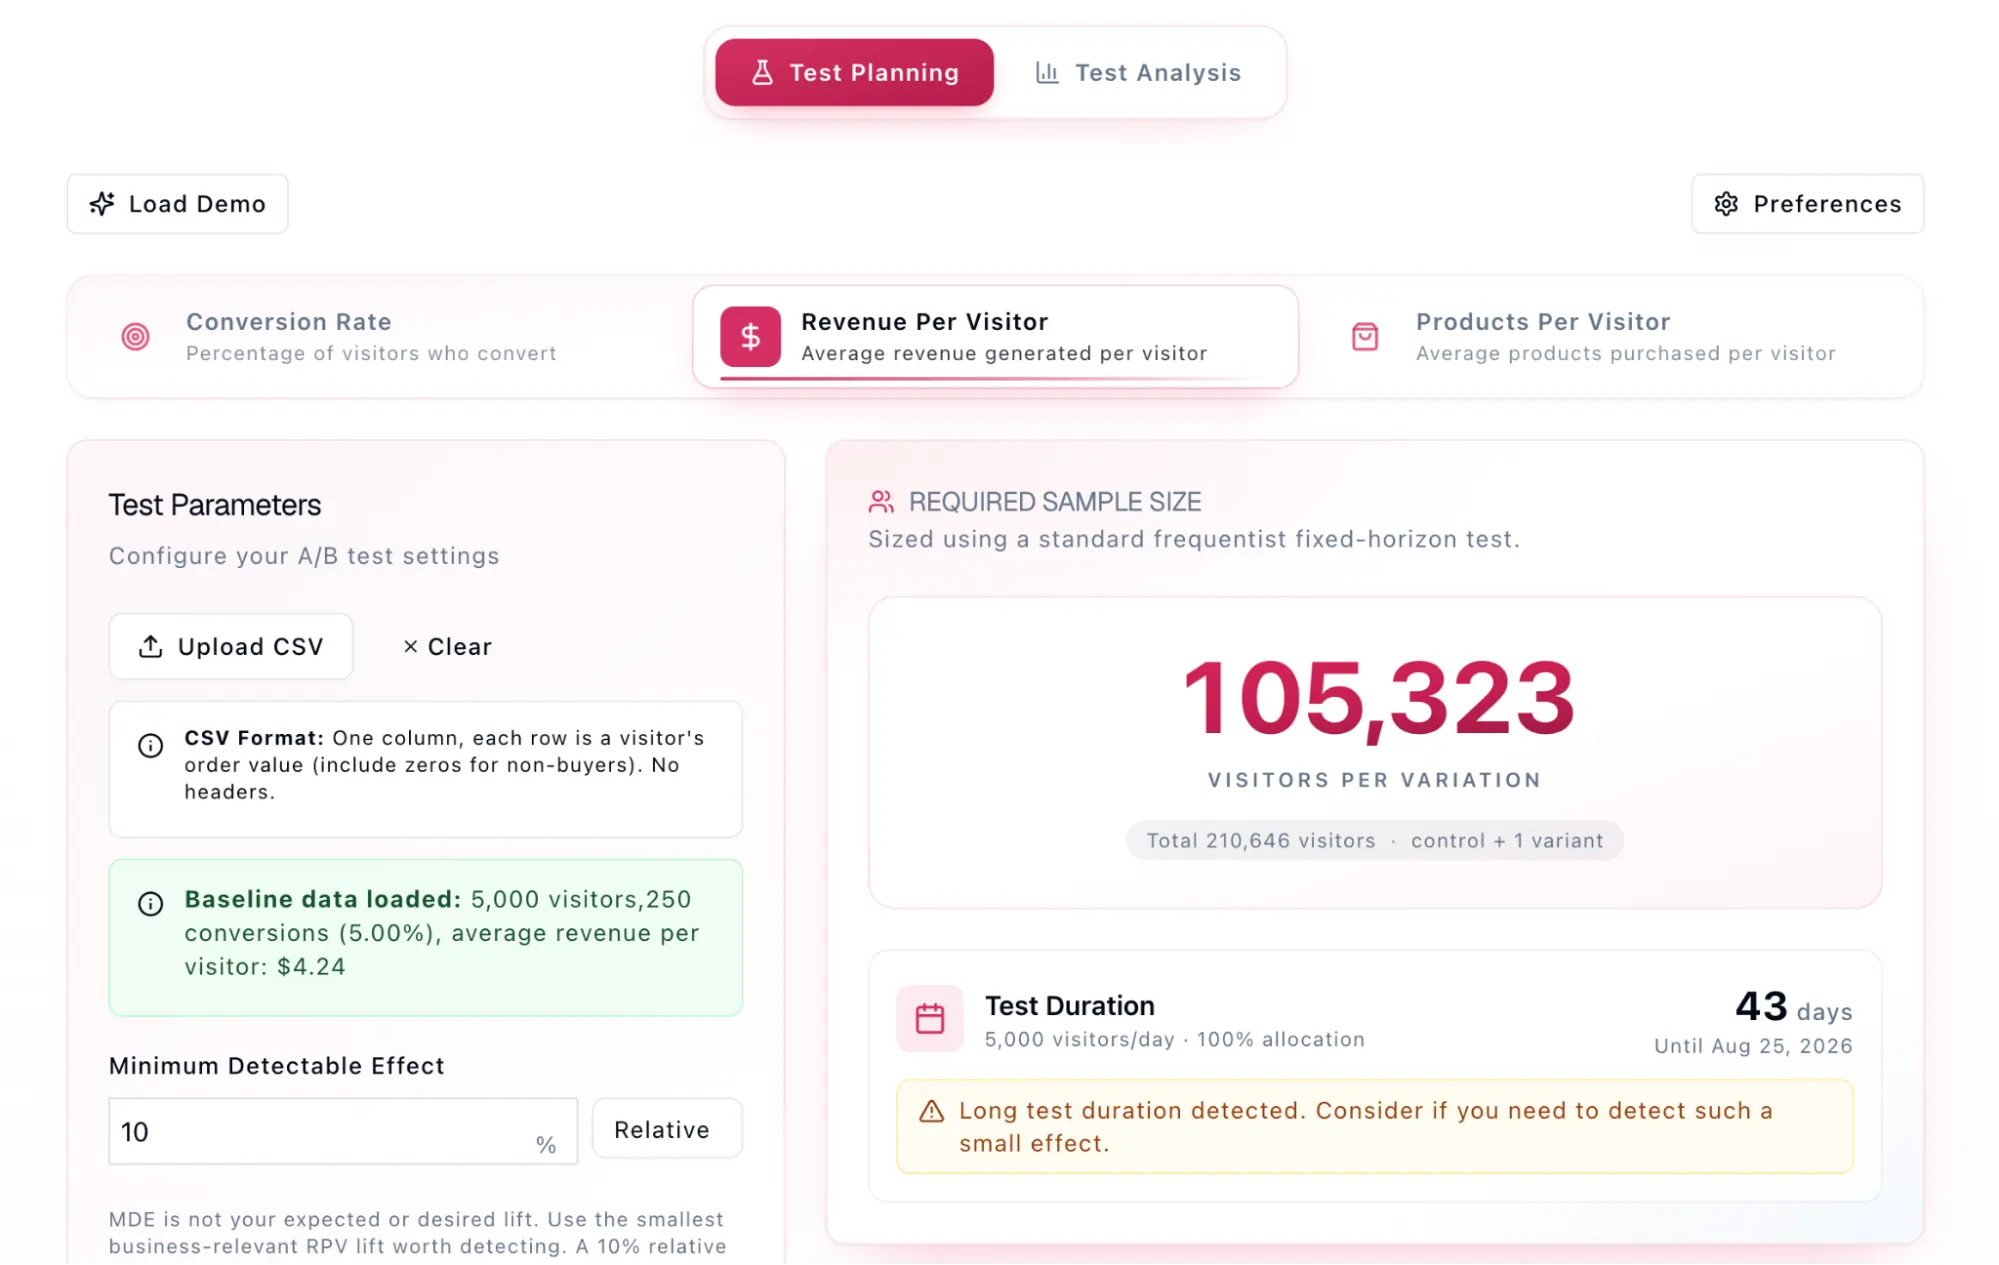
Another strategy involves testing on higher-traffic segments or pages further up the funnel. While a checkout page might have low traffic, a homepage or a major landing page may provide the volume necessary for a high-power test. Additionally, using "micro-conversions"—such as "add to cart" instead of "completed purchase"—can increase the number of conversion events, thereby reducing the time required to reach statistical power.
Broader Implications for Data-Driven Governance
The rigorous application of power analysis is becoming a hallmark of mature data organizations. Experts, including those referenced in technical studies by Ron Kohavi, emphasize that controlled experiments are the only reliable way to establish causality in a complex digital ecosystem. Without adequate power, experimentation becomes "data theater"—a process that looks scientific but lacks the mathematical foundation to drive reliable business growth.

As machine learning and automated personalization become more integrated into web platforms, the role of human-led A/B testing will shift toward validating these automated systems. In this future, understanding the nuances of statistical power will be the primary differentiator between organizations that guess at their growth and those that engineer it. The conclusion for digital leaders is clear: statistical power is not a secondary technical detail; it is the fundamental metric that determines whether an experimentation program is an asset or a liability. Organizations must invest in the tools and education necessary to ensure every test is designed with the sensitivity required to turn data into a competitive advantage.







