

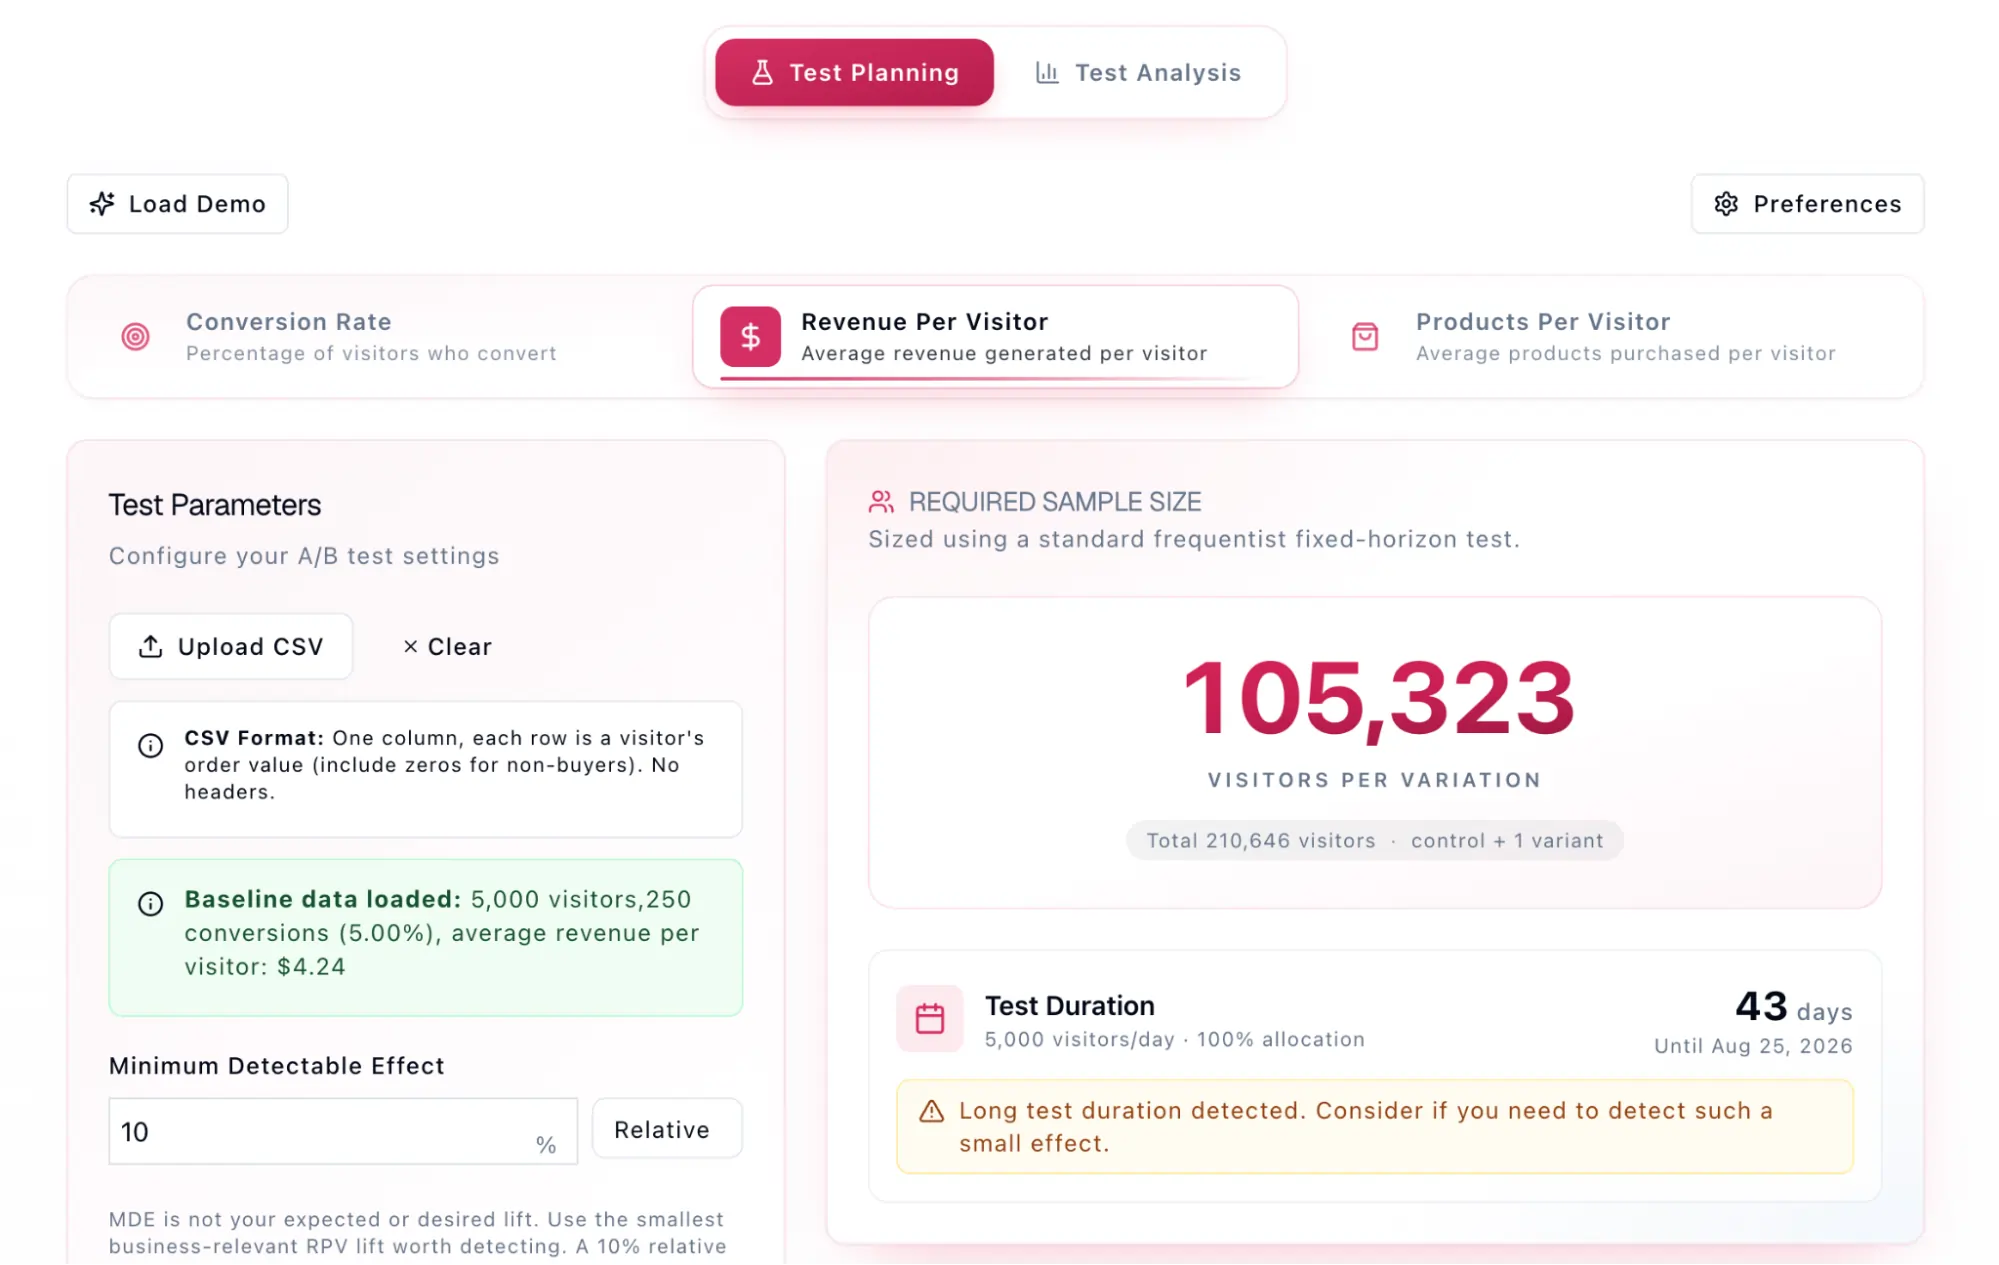
Statistical power remains the most misunderstood yet critical component of modern digital experimentation, serving as the primary safeguard against "false negative" results that can cost enterprises millions in unrealized revenue. In the high-stakes environment of A/B testing, where companies like Amazon, Netflix, and Google run thousands of experiments simultaneously, the ability to distinguish a true performance lift from random noise is the difference between strategic growth and stagnation. While most practitioners focus heavily on statistical significance to avoid false positives, the industry is increasingly sounding the alarm on underpowered tests—experiments that are effectively "blind" to the very improvements they are designed to measure.

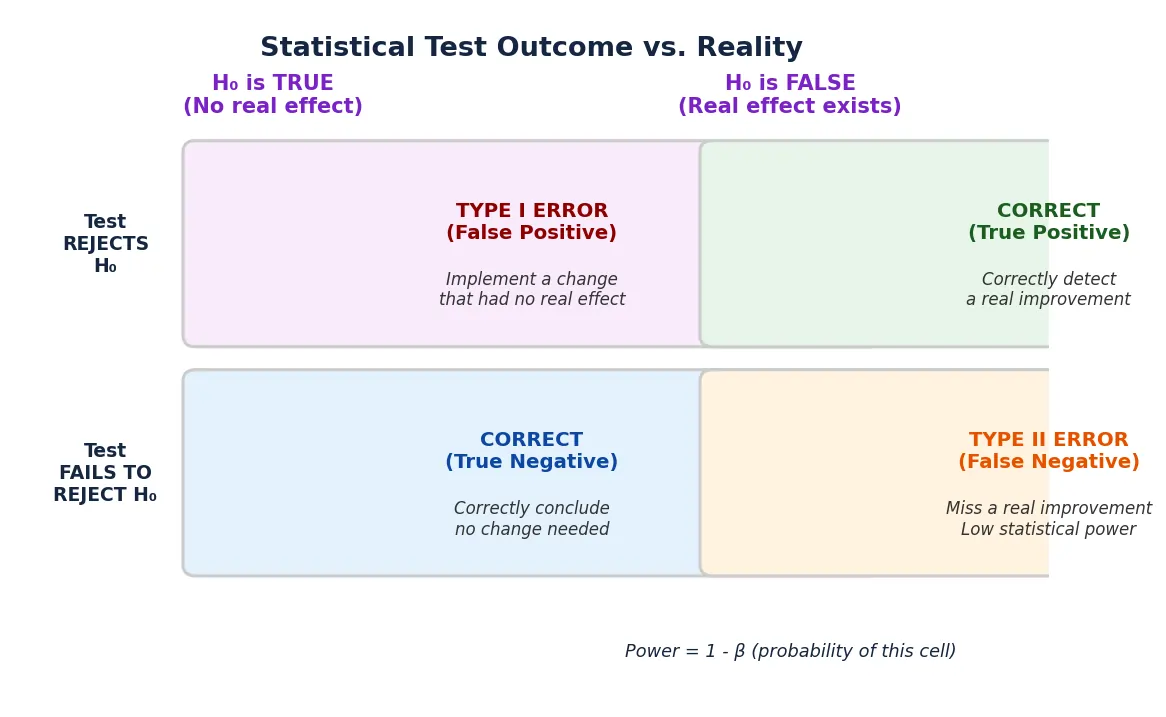
The fundamental challenge in data science is the management of two distinct types of errors. A Type I error, or a false positive, occurs when a researcher claims a variation is a winner when it actually has no effect. This is controlled by the significance level, typically set at 5%. However, a Type II error, or a false negative, occurs when a test fails to detect a real improvement. Statistical power is the mathematical insurance against this second error; it is the probability that a test will correctly identify a winning variation if one truly exists. In professional testing environments, the standard for power is 80%, meaning the experiment has an 80% chance of detecting a specified effect and a 20% risk of missing it.
The Evolution of Experimentation Sensitivity
The concept of statistical power originated in the early 20th century within the realm of clinical trials and agricultural science, but its application in the digital economy has undergone a radical transformation. In the early days of the internet, massive "home run" wins were common, and even crude testing methods could detect 20% or 30% lifts in conversion rates. As digital markets have matured, however, the "low-hanging fruit" has been harvested. Modern optimization now relies on "marginal gains"—lifts of 1%, 2%, or 5% that, when compounded, drive significant enterprise value.

This shift has made statistical power the central focus of the experimentation roadmap. A test designed without a rigorous power analysis often results in a "flat" or "inconclusive" result. To the untrained eye, this suggests the new feature or design change was a failure. In reality, the variation may have been a significant winner, but the experiment lacked the "sensitivity"—the power—to prove it. This phenomenon leads to the "discarded winner" problem, where valuable innovations are shelved due to inadequate data volume or poor experimental design.
The Four Pillars of Experimental Power
To understand why some tests succeed in finding winners while others fail, analysts point to four interlocking factors that determine the sensitivity of any given experiment.
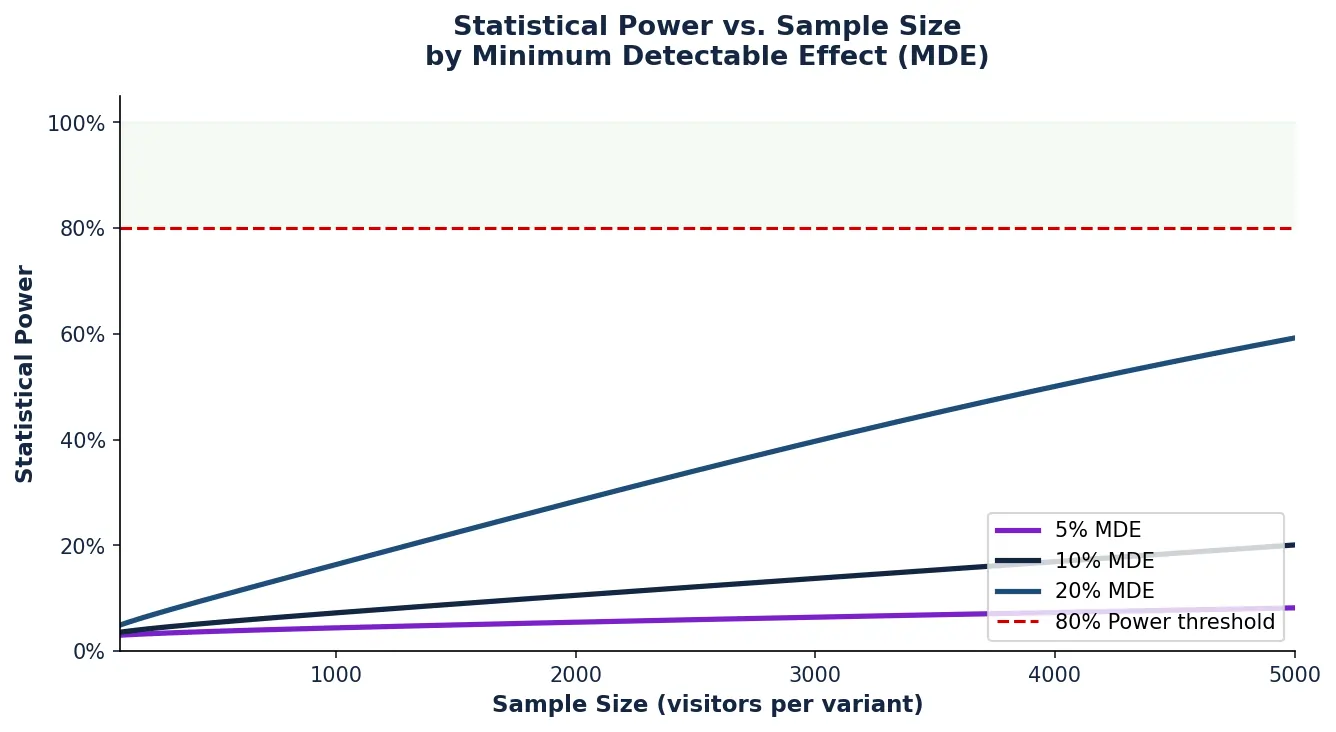
- Sample Size (N): This is the most direct lever for increasing power. As the number of participants in a test increases, the "noise" of random individual behavior begins to smooth out, making the "signal" of the variation’s impact easier to see. In a low-traffic environment, achieving 80% power may take months, whereas high-traffic platforms can reach it in days.
- Minimum Detectable Effect (MDE): The MDE is a pre-test decision regarding the smallest lift the business cares about detecting. There is an inverse relationship between MDE and required sample size: detecting a massive 20% lift requires very little data, while detecting a subtle 2% lift requires a massive influx of visitors.
- Significance Level (Alpha): This is the threshold for evidence. If a business demands extreme certainty (e.g., a 99% confidence level), it inadvertently reduces the test’s power. By being overly cautious about false positives, the test becomes more likely to return a false negative unless the sample size is increased to compensate.
- Data Variability (Variance): This factor is often overlooked but remains crucial for e-commerce. Metrics like "Revenue Per Visitor" (RPV) are notoriously high-variance because while most people spend nothing, a single "whale" might spend thousands. This "noise" in the data makes it much harder for a statistical model to confirm that a lift is real rather than a result of a few lucky high-value orders.
The Financial Cost of Underpowered Testing
The implications of low statistical power are not merely academic; they are deeply financial. Consider a mid-sized e-commerce platform generating $100 million in annual revenue. If the team runs an underpowered test on a new checkout flow that actually improves conversions by 3%, but the test returns an "inconclusive" result, the company loses $3 million in annual recurring growth. Because the test was not sensitive enough to catch the 3% lift, the team reverts to the original "Control" version, unaware they have just discarded a multi-million dollar improvement.
Furthermore, underpowered testing leads to what statisticians call the "Winner’s Curse" or "Effect Size Overestimation." When a test has low power, the only way it can reach statistical significance is if the observed result is an extreme outlier. This means that when underpowered tests actually do show a "win," the reported lift is almost always much higher than the true reality. When the company rolls out the change globally, they are often disappointed to find that the massive 15% lift seen in the test evaporates into a mere 2% in production.
Chronology of a Professional Power Analysis
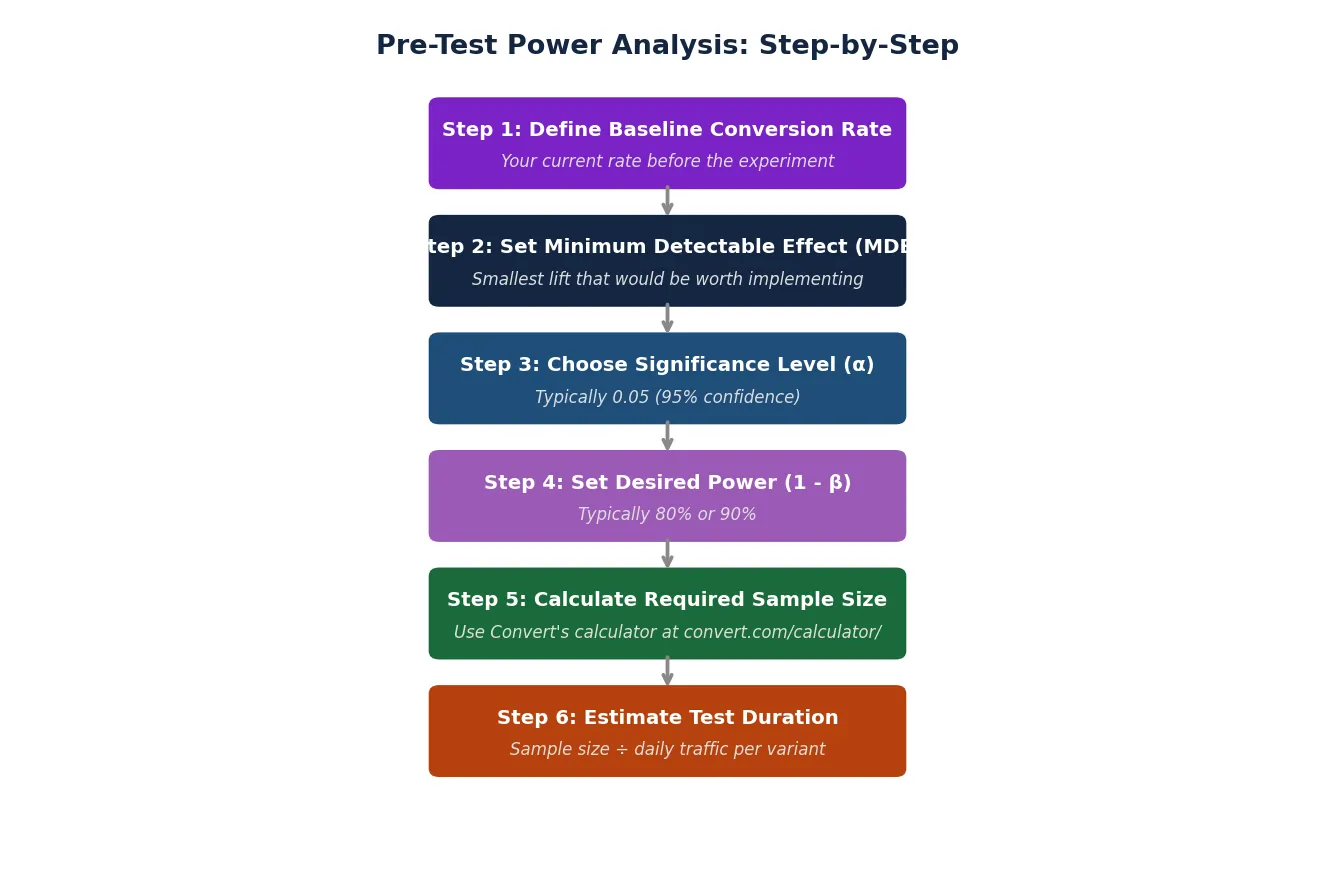
To mitigate these risks, industry leaders have moved toward a standardized pre-test protocol. This timeline ensures that data integrity is maintained from the moment of hypothesis to the final rollout.
- Phase 1: Baseline Establishment: Analysts examine historical data (usually the last 30 to 90 days) to determine the current conversion rate and the standard deviation of the target metric.
- Phase 2: MDE Calibration: Stakeholders decide on the MDE. This is a business decision, not a mathematical one. It asks: "How much of an improvement do we need to see to justify the engineering cost of this change?"
- Phase 3: Sample Size Calculation: Using the baseline, MDE, and desired power (usually 80%), a calculator determines the total number of visitors needed.
- Phase 4: Duration Estimation: The required sample is divided by daily traffic to set a fixed end date for the experiment.
- Phase 5: Execution and Non-Peeking: The test is launched. A critical rule in Frequentist statistics is "no peeking." Ending a test early because it "looks like a winner" before the required sample size is reached is a violation of statistical principles that drastically increases false positive rates.
Methodological Responses: Frequentist vs. Bayesian Approaches
The debate over how to handle power has also sparked a rift between different statistical schools of thought. The traditional Frequentist approach, which relies on p-values and fixed sample sizes, requires a strict adherence to power analysis before the test begins. It is the gold standard for scientific rigor but can be slow and inflexible for fast-moving startups.
In response, many modern testing platforms have adopted Sequential Testing and Bayesian Statistics. Sequential testing allows for "early stopping" by adjusting the significance boundaries as data accumulates, effectively offering a middle ground between speed and rigor. Bayesian methods, on the other hand, do not use the concept of "power" in the traditional sense. Instead, they provide a "probability of being the best" and an "expected loss" (the risk of being wrong). While Bayesian methods are more intuitive for business stakeholders, they do not eliminate the need for sensitivity; a Bayesian test with too little data will simply report a high level of uncertainty, preventing a confident decision.
Broader Industry Implications and Analysis
As the digital landscape becomes more competitive, the "Culture of Experimentation" is shifting toward "Experimentation Quality." It is no longer enough to run many tests; those tests must be reliable. Industry experts note that Twyman’s Law—the principle that any piece of data that looks too good to be true usually is—is often triggered by underpowered tests. When a small-scale test shows a massive win, experienced data scientists are now more likely to demand a "power-up" re-test with a larger sample rather than celebrating the result.
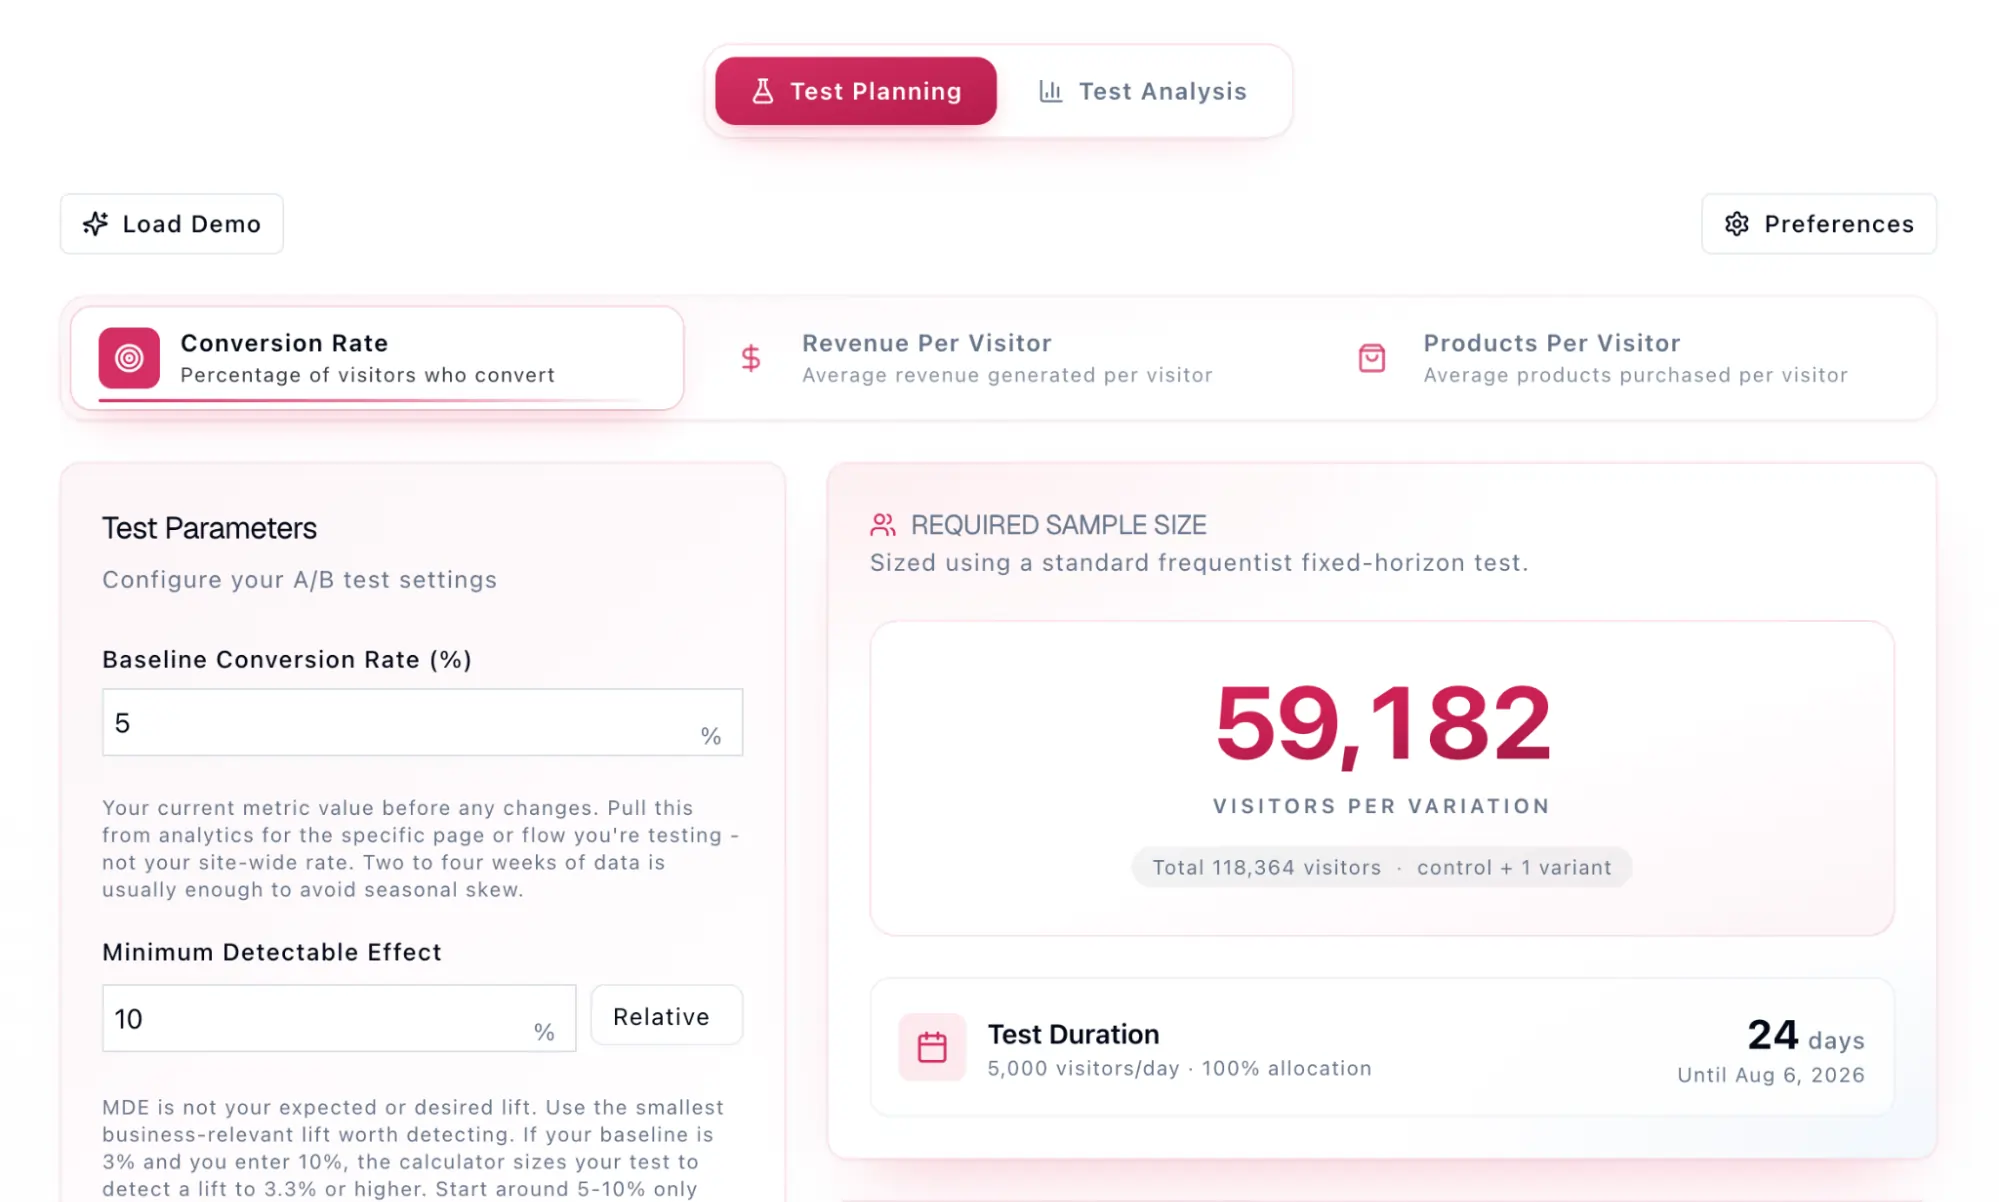
The move toward higher power and more rigorous analysis also reflects a growing sophistication in how companies view data. Experimentation is increasingly seen as a form of risk management. By investing in statistical power, companies are essentially buying "information insurance." They are ensuring that their R&D efforts are not wasted on invisible wins and that their strategic decisions are based on a foundation of mathematical certainty rather than the luck of the draw.
In conclusion, statistical power is the silent engine of the modern growth stack. While statistical significance guards the gate against errors of commission (doing the wrong thing), statistical power guards against errors of omission (failing to do the right thing). For organizations looking to scale, mastering this metric is no longer optional—it is the prerequisite for a truly data-driven future.







