The discipline of digital experimentation has reached a critical crossroads where the demand for rapid business insights often clashes with the fundamental laws of mathematical probability. As organizations transition from occasional testing to a culture of "continuous experimentation," a recurring behavioral pattern has emerged among practitioners: the "peeking problem." In response to this industry-wide challenge, VWO has unveiled a sophisticated approach to sequential testing designed to maintain statistical integrity without hindering the natural workflow of product managers and marketers. By applying corrections directly to the variance of the improvement distribution rather than using traditional moving decision boundaries, the platform ensures that early data checks do not lead to inflated false-positive rates.
The Evolution of the Peeking Problem in Digital Testing
The history of A/B testing is rooted in fixed-horizon frequentist statistics, a methodology originally designed for clinical trials and agricultural experiments where data is collected in a single, terminal batch. However, the digital economy operates on real-time dashboards. In a modern corporate environment, stakeholders—ranging from UX designers to Chief Product Officers—frequently monitor live experiments to gauge performance.
The danger of this "peeking" is well-documented but often underestimated. In a standard test with a 95% confidence level, there is a 5% chance of a false positive (Type I error). However, each time an experimenter "peeks" at the data and considers stopping the test early because it looks significant, they effectively give the experiment a new opportunity to fail. If a tester checks a result 10 times during its lifecycle, the cumulative probability of encountering a false positive can skyrocket from 5% to nearly 30% or 40%. The engineering team at Spotify famously highlighted this phenomenon, noting that repeated checks can cause the false-positive rate to exceed intended targets by several hundred percent, leading companies to implement "winning" features that actually provide zero or negative value.
Sequential Testing: A Chronology of Methodology
To combat the risks of early stopping, statisticians developed sequential testing. The timeline of these developments reflects a growing need for flexibility:
- Fixed-Horizon Testing (Pre-2000s): Required a pre-calculated sample size and a single check at the end. This was the standard for early web testing but proved too slow for agile development.
- Group Sequential Testing (GST): Introduced in the late 20th century, GST allowed for a set number of "interim analyses." Methodologies like the O’Brien-Fleming and Pocock boundaries provided a mathematical way to "spend" the alpha (error budget) across multiple checks.
- Continuous Monitoring (2010s-Present): As computing power increased, platforms began seeking ways to allow for checks at every new data point.
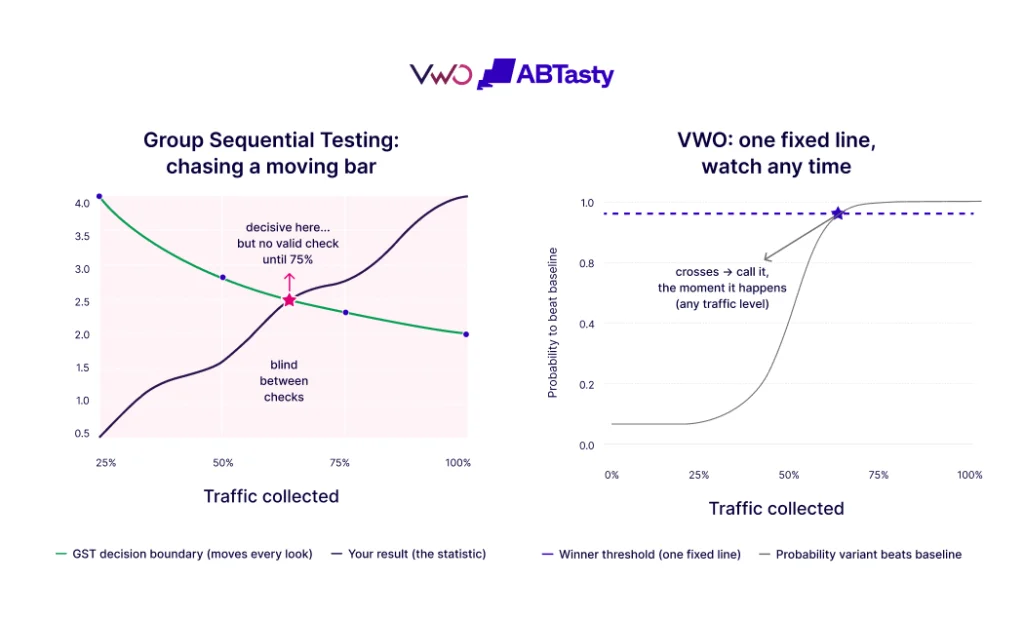
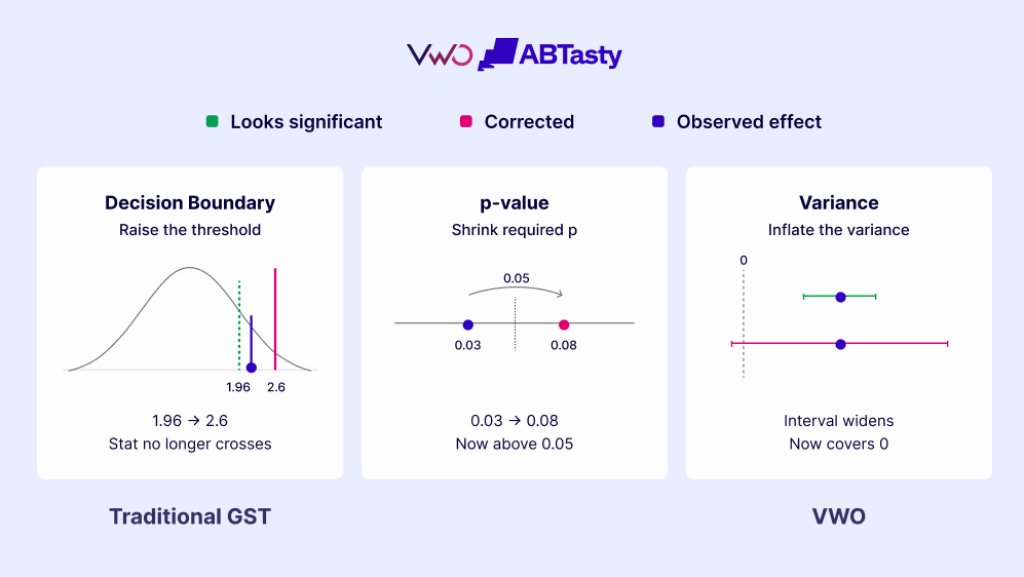
While GST solved the mathematical error, it introduced a new "usability" problem. Traditional GST uses a moving decision boundary. Early in a test, the bar for significance is set extremely high to account for the lack of data. As the test progresses, the bar gradually lowers toward the standard 95% line. For a non-statistician, this creates a "moving target" effect where a result that looks like a winner on Tuesday might appear insignificant on Wednesday simply because the threshold shifted.
VWO’s Innovation: The Stationary Significance Threshold
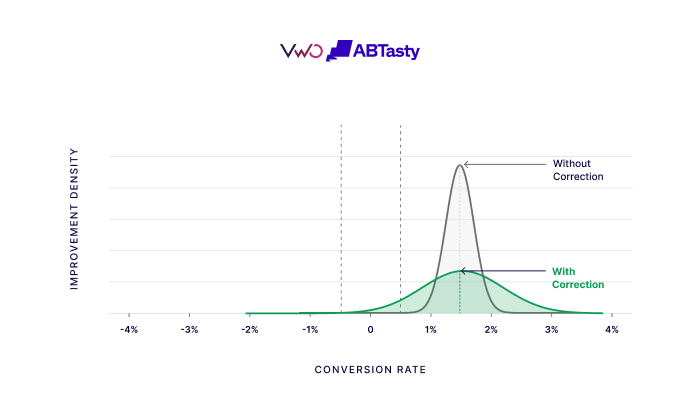
VWO’s approach diverges from the industry standard by keeping the significance threshold stationary. Instead of moving the goalposts (the decision boundary), VWO applies the statistical correction to the variance of the improvement distribution itself.
By widening the "uncertainty band" by the exact amount required by the peeking correction, VWO is able to bake the complexity into a single, stable metric: the "Probability to be Better." This methodology ensures that the number a user monitors—such as a 95% probability of improvement—remains consistent throughout the duration of the experiment. When the metric crosses the threshold, it stays there with statistical validity, allowing the user to call a winner the moment it happens without waiting for a "planned checkpoint."
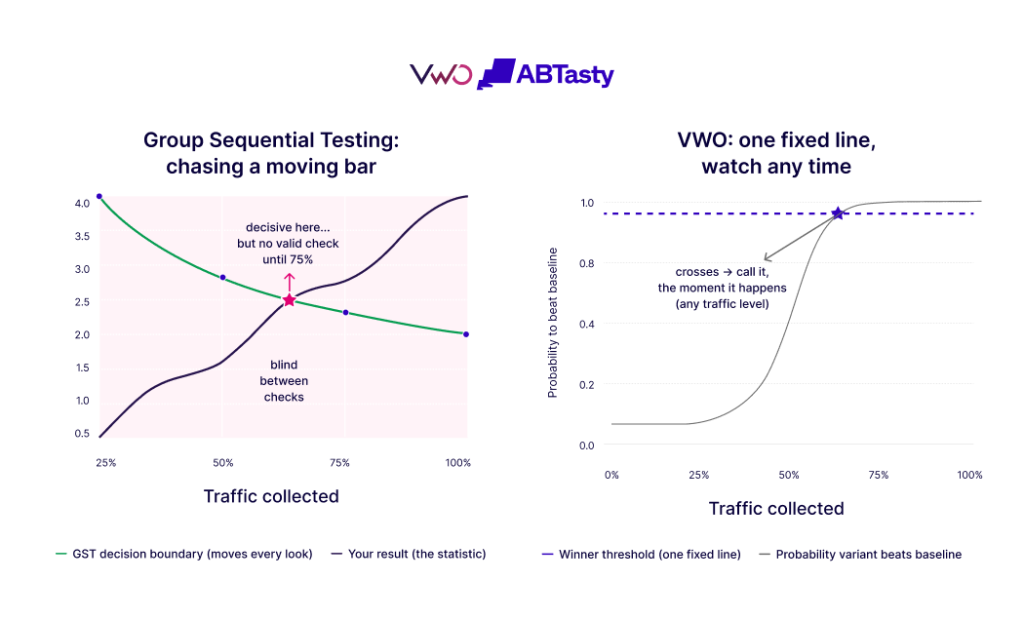
This approach addresses a major blind spot in traditional GST. In a standard group sequential design, if a variation starts causing a catastrophic drop in conversions between the 25% and 50% checkpoints, the mathematical model technically does not grant a valid decision until the next scheduled look. VWO’s continuous correction eliminates these blind spots, providing a safety net that operates in real-time.
Supporting Data: Head-to-Head Simulation Results
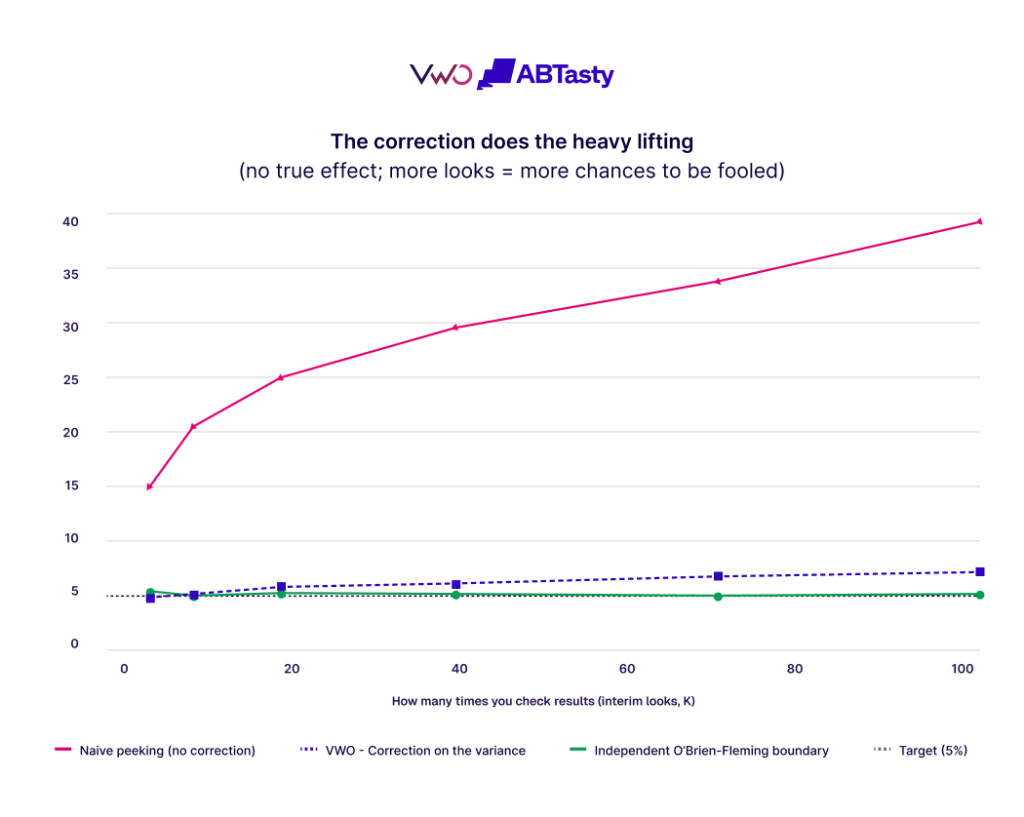
To validate this approach, VWO conducted extensive simulations comparing their variance-side correction against the textbook O’Brien-Fleming boundary design. The simulations involved thousands of iterations, ranging from occasional peeks to "relentless peeking" (checking after every new visitor).
The data revealed three critical findings:
- False-Positive Control: In scenarios with no real difference between variations, "naive peeking" (testing without correction) resulted in false-positive rates as high as 40%. In contrast, both the O’Brien-Fleming method and VWO’s correction kept the error rate near the 5% target.
- Stability Under Stress: Under extreme, continuous peeking (100+ looks), VWO’s method showed a modest drift to approximately 7%, whereas the O’Brien-Fleming boundary held precisely at 5%. VWO maintains that this 2% variance is a deliberate trade-off for the increased readability and usability of a fixed threshold.
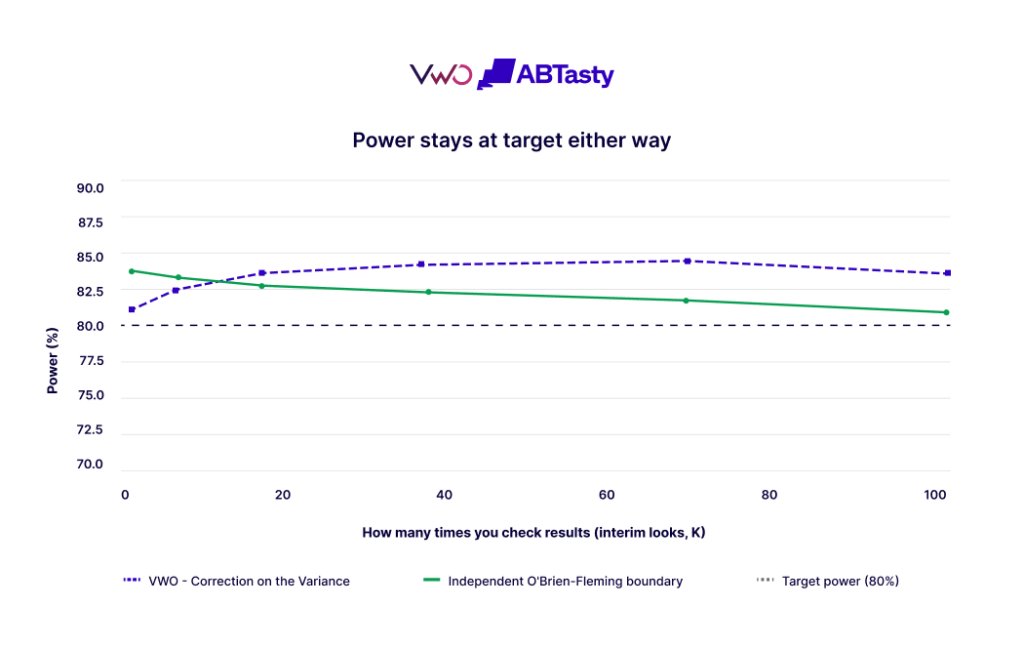
- Statistical Power: "Power" refers to the ability of a test to detect a winner when one actually exists. The simulations confirmed that VWO’s method reached the 80% power target across the board, matching the performance of more rigid frequentist models.
Integration with Bayesian and Frequentist Frameworks
A long-standing debate in the experimentation community pits "Frequentists" (who rely on p-values and confidence intervals) against "Bayesians" (who focus on the probability of an outcome based on prior knowledge). Most testing platforms force users into one camp or the other.
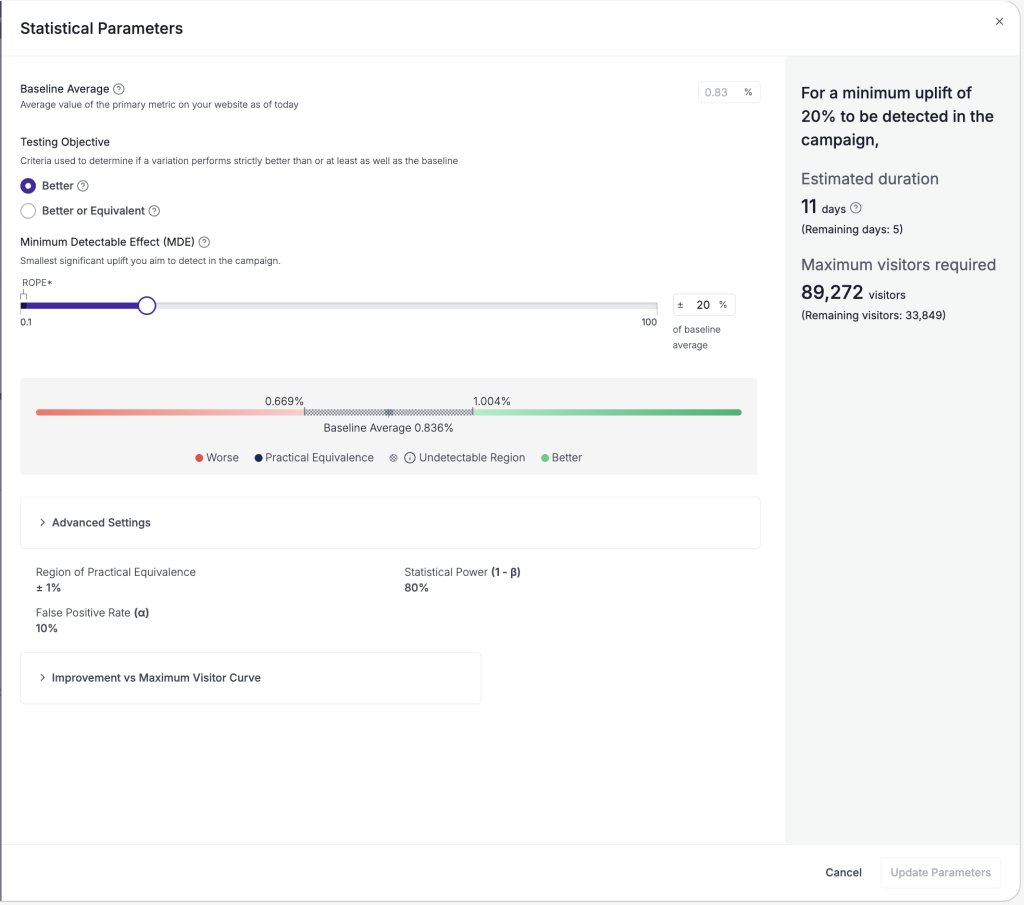
VWO has taken a neutral, "best-of-both-worlds" stance by building the same sequential correction into both reporting styles. This allows data scientists to defend results using p-values while allowing product managers to interpret results through the lens of probability. This flexibility is a response to the diverse needs of modern stakeholders; a Chief Financial Officer may want the rigor of a frequentist confidence interval, while a Marketing Manager needs the intuitive nature of Bayesian probability to make a quick decision on ad creative.
Beyond the Main Result: Opportunities and SRM
The application of sequential testing at VWO extends beyond the primary goal of an experiment. Two specific areas benefit from this rigor:
1. The "Opportunities" Feature
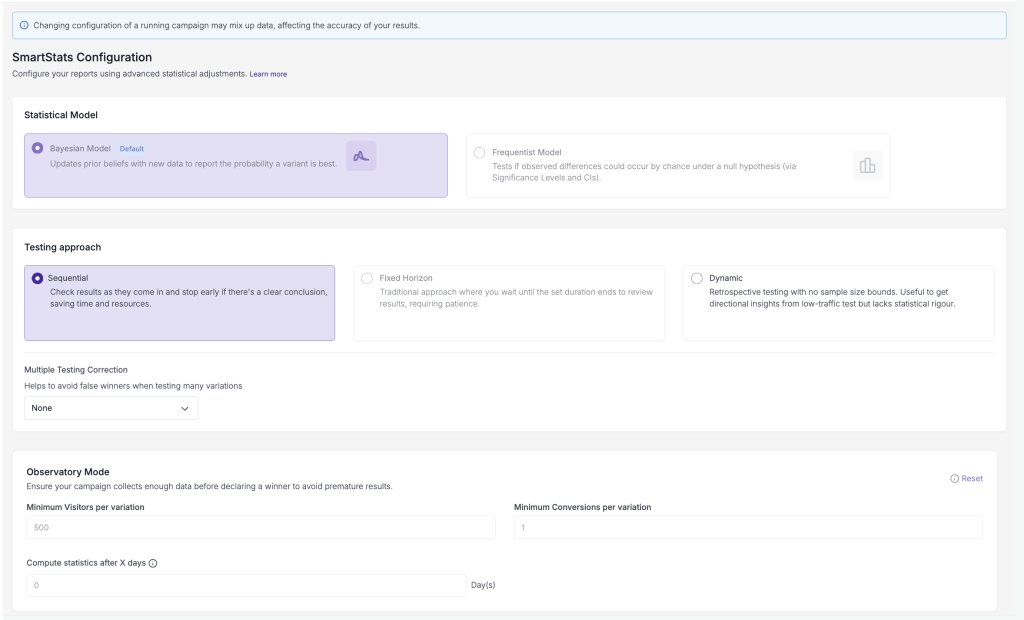
Modern testing often involves slicing data by segments (e.g., mobile users vs. desktop users). The "multiplicity problem" suggests that the more segments you check, the more likely you are to find a "false winner" in a sub-group. VWO applies the same sequential correction to its "Opportunities" dashboard, which automatically surfaces segments where a variation is over-performing. This ensures that a flagged opportunity is not merely a byproduct of data dredging or repeated peeking at segment-level data.
2. Sample Ratio Mismatch (SRM)
SRM is a critical health check that detects if the traffic split is imbalanced (e.g., a 50/50 test resulting in a 48/52 split). SRM is often an early indicator of technical bugs or "bot" interference. Interestingly, VWO uses a different design choice here: a chi-squared test with a moving boundary. Because SRM is a background safeguard that users do not actively "read" for business insights, VWO utilizes the classic moving threshold to provide the most precise protection possible against traffic bias.
Industry Implications and Analysis
The shift toward user-friendly sequential testing represents a broader maturation of the CRO (Conversion Rate Optimization) industry. For years, the barrier to entry for high-rigor testing was high, requiring dedicated statistical analysts to interpret results. By automating the "statistics homework," VWO is essentially democratizing data science.
Industry analysts suggest that this "frictionless rigor" will become the new standard. As privacy regulations like GDPR and CCPA make data collection more difficult, and as the "signal-to-noise" ratio on the web decreases, the cost of a false positive becomes higher. A company that implements a feature based on a false positive not only wastes engineering resources but also risks "opportunity cost"—the loss of time that could have been spent on a truly winning idea.
Furthermore, the ability to adjust reporting preferences mid-test without losing validity addresses the reality of corporate decision-making. Often, a test is started with one set of goals, but a shift in business priority requires a faster or more conservative answer. VWO’s model allows for this agility without the need to restart the experiment from scratch.
Conclusion: Reframing the Experimentation Experience
The core philosophy behind VWO’s approach is that A/B testing should not require a Ph.D. to execute correctly, nor should it force practitioners to suppress their natural curiosity. By absorbing mathematical complexity into the backend of the platform, VWO allows teams to focus on the qualitative aspects of experimentation—generating hypotheses and building better user experiences—while the software handles the quantitative safeguards. As digital competition intensifies, the ability to "peek freely" while maintaining statistical truth may well be the differentiator between companies that merely test and those that truly learn.